Fig. 2
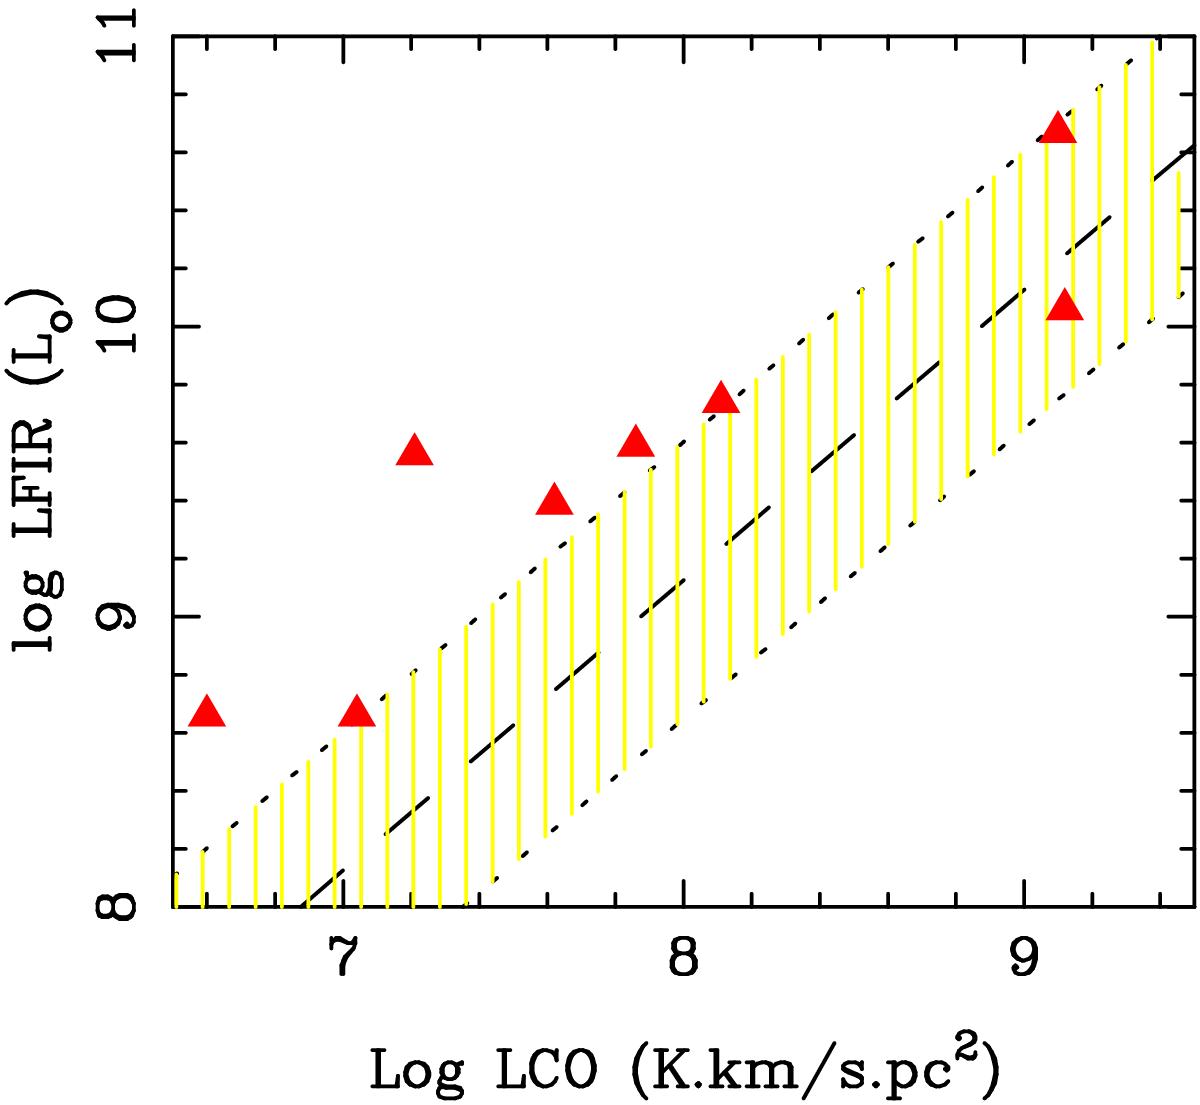
Correlation between FIR and CO luminosities, for the CLoGS sample (filled red triangles). The dashed line represents a depletion time-scale of 2 Gyr, assuming a conversion factor α = 4.6 M⊙ (K kms-1 pc2)-1. The shaded regions represent the main location of nearby spiral galaxies (from Bigiel et al. 2008), within a factor 3 around the mean depletion time-scale of 2 Gyr.
Current usage metrics show cumulative count of Article Views (full-text article views including HTML views, PDF and ePub downloads, according to the available data) and Abstracts Views on Vision4Press platform.
Data correspond to usage on the plateform after 2015. The current usage metrics is available 48-96 hours after online publication and is updated daily on week days.
Initial download of the metrics may take a while.