Fig. 1
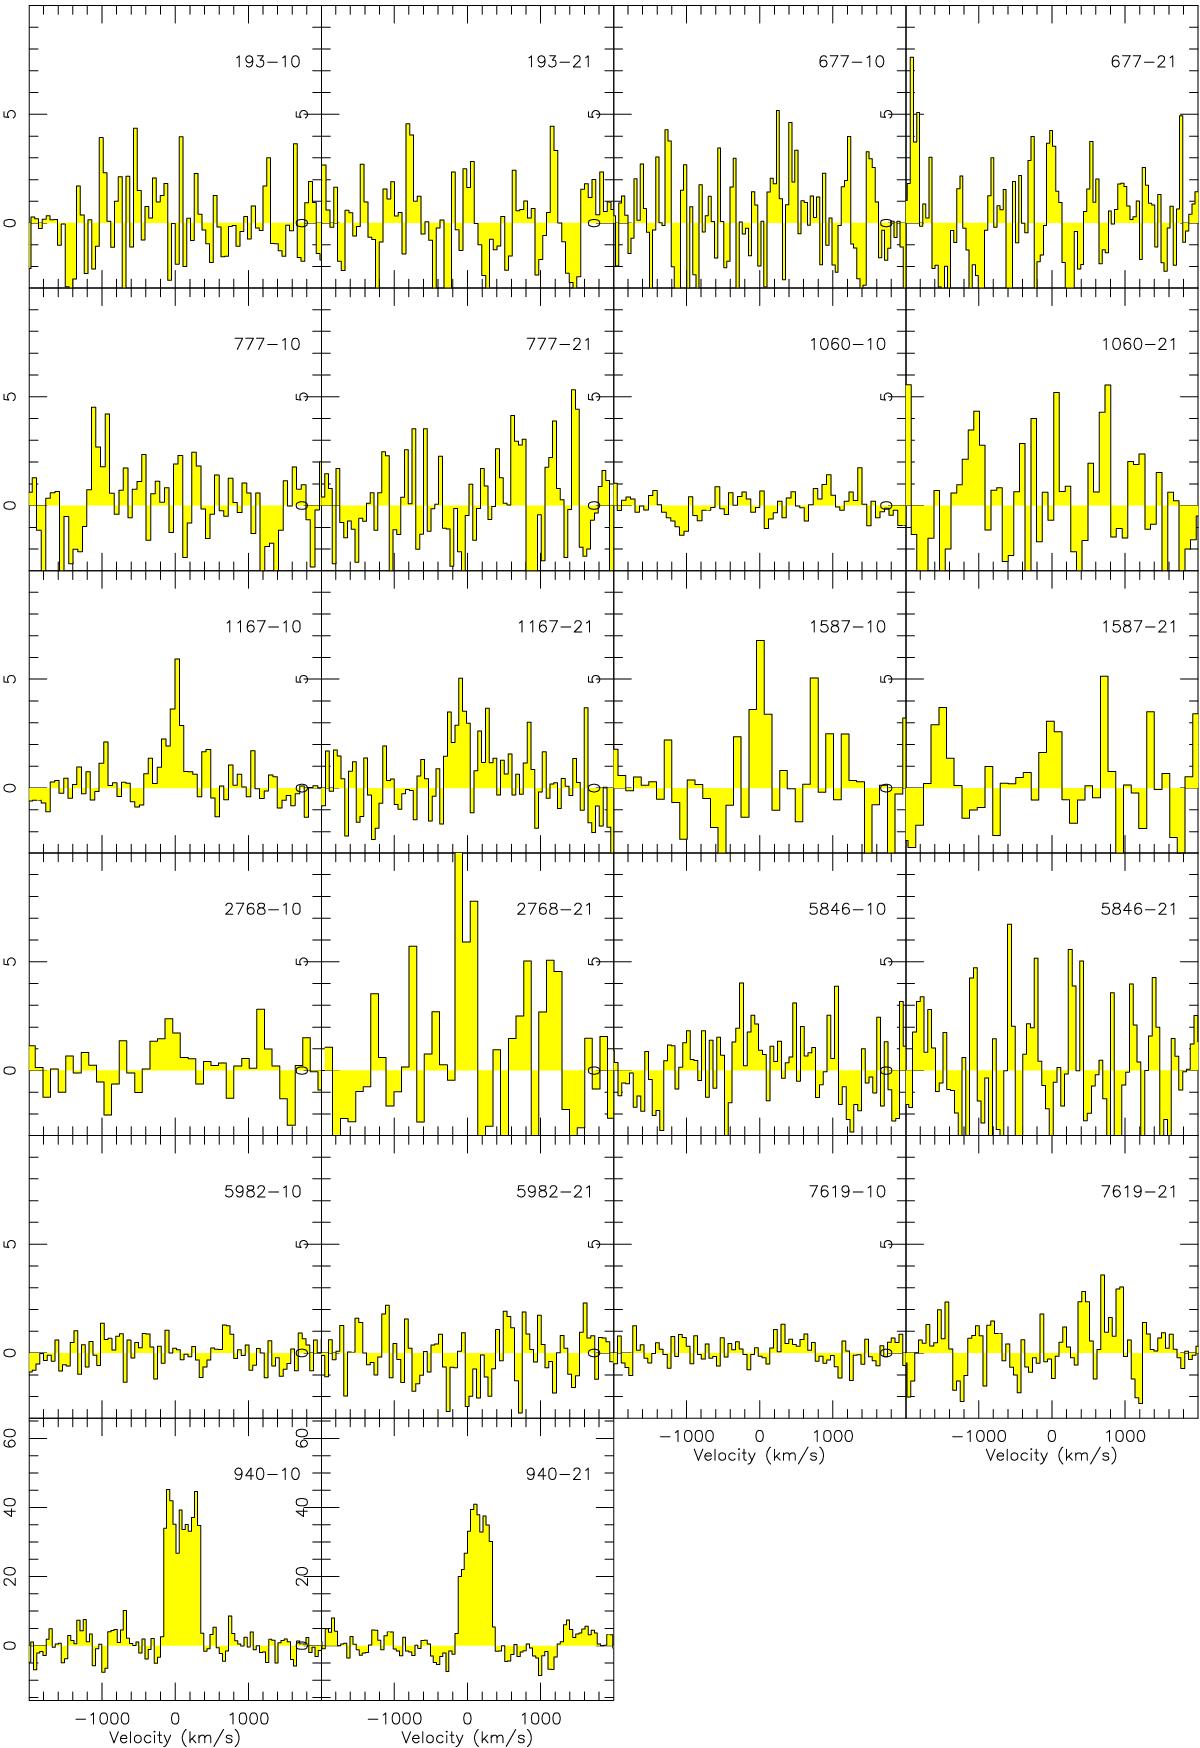
CO spectra of the observed group-dominant galaxies. In each column, the left-hand panel is the CO(1–0), and right-hand panel the CO(2–1) lines. The velocity scale is relative to the redshift displayed in Table 1. The vertical scale is Tmb in mK. All spectra have been plotted to the same scale, except the CO-rich NGC 940 galaxy, at the bottom.
Current usage metrics show cumulative count of Article Views (full-text article views including HTML views, PDF and ePub downloads, according to the available data) and Abstracts Views on Vision4Press platform.
Data correspond to usage on the plateform after 2015. The current usage metrics is available 48-96 hours after online publication and is updated daily on week days.
Initial download of the metrics may take a while.