| Issue |
A&A
Volume 572, December 2014
|
|
|---|---|---|
| Article Number | A5 | |
| Number of page(s) | 8 | |
| Section | Extragalactic astronomy | |
| DOI | https://doi.org/10.1051/0004-6361/201323279 | |
| Published online | 18 November 2014 | |
AGB populations in post-starburst galaxies
1
European Southern Observatory,
Av. Alonso de Cordova 3107, Casilla,
19001
Santiago
Chile
e-mail:
This email address is being protected from spambots. You need JavaScript enabled to view it.
2
Finnish Centre for Astronomy with ESO, University of
Turku, Väisäläntie
20, 21500
Piikkiö,
Finland
Received: 18 December 2013
Accepted: 11 September 2014
Abstract
In a previous paper we compared the spectral energy distributions of a sample of 808 K+A galaxies from the far ultraviolet to the mid infrared to the predictions of the spectrum synthesis models explicitly using asymptotic giant branch components. Here we use the new AGB-light models from C. Maraston (including less fuel for the later stages of stellar evolution and improved calibrations) to address the discrepancies between our observations and the AGB-heavy models used in our previous paper, which over-predict the infrared fluxes of post-starburst galaxies by an order of magnitude. The new models yield a much better fit to the data, especially in the near-IR, compared to previous realisations where AGB stars caused a large excess in the H and K bands. We also compare the predictions of the M2013 models to those with BC03 and find that both reproduce the observations equally well.We still find a significant discrepancy with both sets of models in the Y and J bands, which however is probably due to the spectral features of AGB stars. We also find that both the M2013 and the BC03 models still over-predict the observed fluxes in the UV bands, even invoking extinction laws that are stronger in these bands. While there may be some simple explanations for this discrepancy, we find that further progress requires new observations and better modelling. Excess mid-infrared emission longwards of 5 μm is well modelled by a Tdust = 300 K black body, which may arise from dust emission from the circumstellar envelopes of oxygen rich M stars (expected for a metal-rich population of AGB stars).
Key words: stars: AGB and post-AGB / galaxies: starburst
© ESO, 2014
1. Introduction
Post-starburst galaxies (sometimes also called E+A or K+A galaxies) have undergone a significant episode of star formation (Kaviraj et al. 2007; Choi et al. 2009; Melnick & De Propris 2013, hereafter Paper I), but now show no evidence that they are currently forming stars (Shin et al. 2011; Nielsen et al. 2012), leaving behind an intermediate-age (~0.5 Gyr) stellar population (see Quintero et al. 2004 for a review of their properties and scenarios for their formation). They are the best local examples of quenched galaxies and allow us to understand how formerly star-forming galaxies cross the “green valley” to join the red sequence and explain the persistent bimodality in galaxy properties across a wide range of environments (Wetzel et al. 2012).
A particular aspect we wish to emphasise here is the possibility of using these objects as calibrators of the effects of the asymptotic giant branch (AGB) phase of stellar evolution on the integrated spectral energy distribution (SED) of galaxies (Maraston 1998; Lancon et al. 1999). Models that include the AGB phase for intermediate-mass stars yield redder colours (and lower stellar masses) for “young” galaxies at high redshift (Maraston 2005; Tonini et al. 2009, 2010) and may help to solve the apparent discrepancy between observations suggesting the presence of old and massive galaxies at z ~ 2 and beyond (Yan et al. 2004; Cirasuolo et al. 2010; Henriques et al. 2011), and simulations where such objects are not easily formed at high look-back times. As post starburst galaxies contain a< 0.5 Gyr old population comprising a large fraction of their current light emission, these objects may be suitable counterparts to the putative young red galaxies at high redshifts, which are also dominated by intermediate-age stars.
In Paper I we explored these questions by using the SDSS DR7 (Abazajian et al. 2009) spectra for 808 K+A galaxies to model their stellar populations using Starlight (Cid Fernandes et al. 2005), and compared the results to SEDs from archival data spanning from 0.15 μm to 22 μm. We did not detect the luminosity boosting in the infrared expected from AGB stars in the models used by Tonini et al. (2009, 2010). This is in agreement with the observations of post-starburst galaxies at 0.7 <z< 2 by Kriek et al. (2010) and the lack of strong AGB features in the infrared spectra of z ~ 0.2 K+A galaxies in Zibetti et al. (2013), although we shall argue below that their spectra miss the most important putative AGB features. We also found some puzzling features, especially the lack of any correlation between model predictions and the metallicities derived from the spectra, suggesting that at least some of the discrepancies may be attributable to problems with the input physics or the reference spectra of AGB stars.
On the other hand, Miner et al. (2011) observe the predicted AGB features in the spectrum of the local K+A NGC 5102. Eminian et al. (2008) find red infrared colours for low redshift star-forming galaxies. MacArthur et al. (2010) show that a thermally pulsing (TP) AGB contribution is necessary to reproduce the broadband colours of spiral galaxy bulges. Melbourne et al. (2012) observe that AGB stars contribute a significant fraction of the infrared flux in resolved colour-magnitude diagrams of nearby starburst and post-starburst galaxies. Reviewing the available evidence Conroy & Gunn (2010) conclude that models where the contribution from the AGB phase is less prominent (i.e., less fuel is available for these stars) are more likely to provide a better match to the observations than the original Maraston (2005) models (although see Raichoor et al. 2011).
In our data we also observed an excess of near and far ultraviolet (FUV) light over the models, as well as emission at λ> 5μm significantly above the expected behaviour of a pure stellar component, suggesting the presence of hot (~300 K) dust. We tentatively argued that at least some K+A galaxies may be dusty starbursts (e.g. Poggianti & Wu 2000), where dust is heated by young stars in obscured super star clusters (responsible for the ultraviolet flux) and in the circumstellar envelopes of AGB stars (e.g. Kelson & Holden 2010; Chisari & Kelson 2012).
In this paper we revisit some of these issues in the light of updated models by Maraston (2013, priv. comm., hereafter M2013; see Noel et al. 2013 for a description) which assume less fuel for the AGB phase,and with the widely used models of Bruzual & Charlot (2003; henceforth BC03). Otherwise we use the same tools, photometry, and spectra as those used in Paper I. We adopt the standard cosmological parameters of ΩM = 0.27 and ΩΛ = 0.73 with H0 = 71 km s-1 Mpc-1.
2. Data and models
The Starlight code (Cid Fernandes et al. 2005) and its application to the K+A galaxies in our sample were fully described in Paper I, to which we refer for further details. Briefly, we use the full star formation histories1 provided by the Starlight population synthesis models of the SDSS spectra. These star formation histories for 24 ages and 5 metallicities are combined to predict the SEDs (i.e. the photometry) from the GALEX FUV (0.15 μm) to the WISE MIR (22 μm) bands using the M2013 models to generate synthetic SEDs, which are then compared with the observations.
The dataset is detailed in Paper I, but the essential characteristics are: optical photometry (ugriz) and spectroscopy from the SDSS (Abazajian et al. 2009); Vacuum UV data are from the GALEX imaging databases (Morrissey et al. 2007); infrared data in (Y)JHK come from either the 2MASS (Skrutskie et al. 2006) or UKIDSS (Lawrence et al. 2007). Mid-infrared data are taken from the Spitzer Heritage Archive or WISE (Wright et al. 2010) datasets. A full description of the aperture matching criteria between these catalogues is given in Paper I.
The observations are corrected for Galactic foreground extinction using the values of Schlafly & Finkelbeiner (2011) and for internal extinction within each galaxy using the values given by the Starlight models. The SDSS input spectra to Starlight were previously corrected for foreground extinction, so the internal extinction calculated in the population synthesis fits should, at least in principle, provide a reasonably reliable estimate of the average extinction affecting the overall stellar population within the fibre aperture. For both the internal and foreground extinction corrections we used a reddening curve typical of the Milky-Way as parametrised by Cardelli et al. (1989), which here we refer to as either CCM when used in the Starlight models, or MW when used to correct the photometric data.
Ages for the STARLIGHT and M2013 models.
We should point out that, as described in Paper I, the Starlight models use the BC03 (Bruzual & Charlot 2003) stellar library to fit the SDSS spectra, so our synthetic SEDs built using the M2013 models (chosen to explore the putative signatures of AGB stars in the photometric data of our galaxies) could in principle be affected by systematic effects due to imperfect matching between the ages and metallicities of these two libraries. In order to quantify any systematic effects, therefore, we also computed synthetic SEDs using only BC03. Our procedure introduces the relative fractions of stars in each age and metallicity bin in the Maraston and BC03 models by exploiting the extra information provided by the SDSS spectra, to predict the observable signatures of stellar populations, especially, in this case, the TP-AGB stars.
It is important to emphasise that we do not fit the model SEDs to the observations: the only free parameter in our SED models is the wavelength-independent photometric normalisation, for which we use the SDSS i′-band, and we examine how well these models reproduce the observations, in particular (but not solely) the expected IR contribution from TP-AGB stars. In Paper I we found that our synthetic SEDs failed to predict the observed mid-IR fluxes, so we arbitrarily added a Tdust = 300 K Black-Body component to all galaxies, which we normalised to the WISE 12 μm fluxes.
The M2013and BC03 models give populations for a wide range of ages and metallicities as summarised in Tables 1 and 2. As shown in Table 1, it is possible to match reasonably well the Starlight ages to the grid of M2013 without recourse to interpolation. The same is not the case for the metallicities, for which the match was done as indicated in Table 2. We verified that our synthetic SEDs are not sensitive to the choice of initial mass function (IMF) by using both the Salpeter and Kroupa realisations of the M2013 models.
Metallicity bins used to match STARLIGHT and M2013 models.
The synthetic SEDs are then calculated as 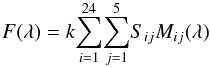 (1)
(1)
where Mij are either the M2013 or BC03 models for the i = 1,...,24 age bins and j = 1,...,5 metallicity bins, and Sij are the mass fractions returned by Starlight for the relevant age and metallicity bins (Tables 1 and 2). The normalisation constant k is independent of wavelength and is the only free parameter of the model.
3. Results
3.1. Comparison between the M2005 and the M2013 models
In order to remove the intrinsic variance in luminosity among the galaxies in the sample it is useful to normalise the fluxes to a fiducial wavelength, for which we chose the SDSS i′-band (F0.767 μm) with data for 800 galaxies. Figure 1 presents the comparison between the predictions of the average synthetic SED computed using Equation 1 for the mean of the Starlight stellar populations of all the galaxies in our sample, and the observations. The averaging of the observations was done for the rest-frame luminosities at each redshift and, in order to minimise the resulting smearing in the rest-frame wavelengths, only galaxies within the redshift range indicated in the figure legend (723 galaxies for z = 0.04−0.3) were included in these averages. The error-bars show the 1σ dispersion of the distribution of normalised fluxes for each bin, not observational errors. The orange line shows the SED predicted using the old Maraston (2005; M2005) models, and the black line shows the prediction of the new Maraston (2013, priv. comm.; M2013) models. Exactly the same Starlight stellar populations were used to compute both SEDs.
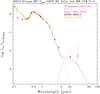 |
Fig. 1 Comparison between the predicted synthetic SED for the average of the 808 K+A galaxies in our sample and the average of the observed broad-band luminosities for a maximum of 723 galaxies (see Table 3) of redshifts 0.04 <z< 0.3 (selected to minimise wavelength smearing in the averaged SEDs) corrected for internal and foreground extinction using the typical MW extinction law, and normalised to the SDSS i′-band (F0.767 μm). The orange line shows the synthetic SED constructed using the Maraston (2005) models and the black line shows the result of using exactly the same stellar populations, but with the synthetic SED built using the Maraston (2013, priv. comm.) models. The magenta line represents the Tdust = 300 K Black-Body component that we added to match the mid-IR data. |
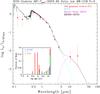 |
Fig. 2 Comparison between the photometric observations and the mean synthetic SED built using only the BC03 models. The averaging of the photometric data points was done as for Fig. 1 as well as the corrections for extinction using the CCM reddening law. The insert presents the average star-formation history − for three broad metallicity bins − of all galaxies in the sample used to compute the mean synthetic SEDs, for both the BC03 model shown in this figure, and the M2013 models shown in Fig. 1. |
Clearly the AGB-heavy M2005 models significantly overestimate the contribution of TP-AGB stars to the near-IR luminosities of intermediate-age stellar populations, while the new “lighter” Maraston (2013, priv. comm.; AGB-light) models with less fuel in the AGB phase adequately reproduce the observed near-IR fluxes of K+A galaxies. We note that the M2013 models make no pretence of predicting the mid-IR fluxes, for which they simply extrapolate the expected blackbody fall-off of stellar atmospheres beyond the K-band as shown by the cyan line in Fig. 1, and therefore that any discrepancy at wavelengths longer than K is not relevant for these models. In Paper I we found that the M2005 models systematically over-predict the UV luminosities of K+A galaxies. Figure 1 shows that this feature remains (as expected) unchanged in the new models. We note that the average synthetic SED is constructed by first averaging the Starlight stellar populations for the 808 galaxies in our sample, and then applying Eq. (1) to combine the average stellar populations with the Maraston models.
3.2. Comparison between M2013 and BC03 stellar libraries
As shown in Fig. 1, the new Maraston AGB-light models provide a much better fit than the M2005 models over a wide range of wavelengths, but not in the UV. It is interesting to compare the predictions of the M2013 models to those of “pure” BC03 synthetic SEDs. This is relevant not only for the contribution of AGB and post-AGB stars, but also in order to understand the discrepancy in the UV, which, as mentioned above, could be affected by our mixing of stellar libraries.
Figure 2 shows the synthetic SED built using only the BC03 models, for exactly the same age and metallicity bins as used in the Starlight population synthesis fits. The data points are the same as those shown in Fig. 1. The figure shows that the synthetic SED built using the BC03 stellar library seems to reproduce equally well than M2013 the photometric observations from the optical to the near-IR. The BC03 models also provide predictions for the WISE 3.5 μ and 4.6 μ bands which, as we will see later, may provide useful additional diagnostics on the AGB populations.
The UV discrepancy remains in the BC03 models. For both M2013 and BC03 we verified that this discrepancy is not due to our choice of reddening law: while the FUV fluxes increase significantly using a UV-strong reddening law, such as that of Gordon et al. (2003) for the SMC bar, the Starlight populations also change with extinction law such as to make the synthetic SEDs steeper in the UV, thus cancelling the improvement resulting from the augmented extinction corrections in the UV photometry.
3.3. Detailed object-by-object comparison between models and data
In order to better compare the predictions of our synthetic SED models, we show in Fig. 3 an object-by-object comparison between the models and the observations where for each band from the near-UV (NUV) to the mid-IR we plot the distribution of (Observed-Predicted) fluxes expressed in magnitudesfor both sets of models. For clarity we have omitted the FUV and the longest mid-IR bands in this figure, but the relevant parameters are listed in Table 3 that summarises the fit parameters for the 15 bands and for both M2013 and BC03.
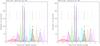 |
Fig. 3 Left: distributions of the difference between the observed and modelled photometric fluxes from the FUV to the mid-IR for the BC033 models. (The details of each histogram are summarised in Table 3.) The histograms have been shifted for clarity and the vertical bars show the zero points for each color (Observed − Model = 0). Right: same as left but for the M2013 models. |
Table 3 shows several interesting results: M2013 seems to provide better fits in the FUV to g′ bands and also in the KS-band, whereas both models fit equally well from r′ to H. Both models over-predict that Y and J fluxes, while the BC03 models also systematically over-predict the 3.5 μ and 4.6 μ fluxes (for which M2013 lacks predictive power).
Detailed comparison between models and observations.
The mean errors of the average values listed in Table 3 would be the dispersions divided by  . Thus, because of the large number of galaxies observed in each band, these systematic discrepancies are highly significant as illustrated in Fig. 4, which compares model and observed fluxes for four of the discrepant bands. The right panel on this figure shows that, with some differences for individual objects, these discrepancies are present in both the M2013 and BC03 models.
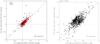 |
Fig. 4 Left: object-by-object comparison between models and observations for the UKIDSS Y and J bands for the BC03 models (black points) and the M2013 models (red points). Right: object-by-object comparison between models and observations for the WISE 3.5μ and 4.6μ bands. The dashed lines mark the zeroes (Model=Observed), and the solid line shows the locus of Y = X. |
We also note the discrepancy between the predictions of the BC03 and M2013 models for the SDSS u′ and g′ bands: while M2013 agrees with the observations within the errors, BC03 significantly over-predict the observed fluxes. For consistency with Paper I, the comparisons of Table 3 were done using monochromatic fluxes at the effective wavelengths of the corresponding filters, most of which are relatively free of strong absorption features except for g′, where the 4000 Å break is at the edge of the band and contributes to the integrated fluxes even for our lowest redshift galaxies (for z ≤ 0.3 the Lyman-break remains outside of the FUV band).
We calculated the “k-corrections” for the 15 bands by integrating the redshifted model fluxes over the 15 filter passbands. As expected, the effect is significant (>0.04 mag) only for the g′ band, for which the mean (Observed–Model) for BC03 is reduced by 0.08 mag with respect to the monochromatic values of Table 3, while the dispersions in all bands remain essentially unchanged. We will return to the UV discrepancy in the next section.
4. Discussion
4.1. Synthetic SEDs from SDSS spectra
In Paper I we asked the question: can we use the stellar populations derived from SDSS spectra to predict the photometric SEDs of post-starburst galaxies from the FUV to the mid-IR? Our study was based on publicly available models and observations; we used the library of population synthesis models for about 700 000 SDSS galaxies compiled by Cid Fernandes et al. (2005), which is publicly available at www.starlight.ufsc.br. Because we were mainly interested in exploring the effects of intermediate-age TP-AGB stars in the integrated IR colours of galaxies, we chose to use the Maraston (2005) stellar library for the reasons explained in the Introduction.
The answer to our original question was clear: No. Our synthetic SEDs predicted too much UV light, too much near-IR flux, and far too little flux for the WISE 12 μ and 24 μ mid-IR bands. While the last could be accounted for reasonably well by adding an ad-hoc hot dust component, we found no simple explanation for the other discrepancies. In this paper we investigated the same question using the new AGB-light models of Maraston, and also the BC03 models used for the Starlight fits, finding that with these libraries we can indeed build synthetic SEDs that reproduce remarkably well the observed broad-band photometric colours of K+A galaxies from the optical to the mid-IR without free parameters.
Independently of the stellar library, however, our new models still predict too much flux in the UV compared to the GALEX observations. We verified that the systematic discrepancy is not due to a particular choice of reddening law, which implies that it would be rather unlikely that the large scatter in the observed UV properties of K+A galaxies be due to differential reddening effects.
As mentioned above, the excellent agreement between the synthetic SEDs and the photometric observations in the optical and IR bands endows the models with a predictive power such that even small discrepancies with the observations need to be understood. Table 3 documents these discrepancies. For the M2013 library we have significant discrepancies in the FUV, NUV, u′, Y, and J bands, whereas, in addition to these bands, for the BC03 models we find discrepancies in the KS, 3.5 μ (L) and 4.6 μ (M) bands. In the following sections we explore the possible origin of these discrepancies.
4.2. Intermediate-age AGB stars
The massive AGB stars that should be present in K+A galaxies (from the stellar evolution of their younger stellar populations) should contribute to dust heating and provide an explanation for the apparent excess at mid-infrared wavelengths over the Rayleigh-Jeans tail of the stellar blackbodies seen in both sets of models. Massive AGB stars are observed as either carbon (C) stars or oxygen (M) stars depending on the surface C/O abundance ratio during the thermal-pulsing phase (Renzini & Voli 1981).
Population studies in nearby galaxies (Mouhcine & Lancon 2003; Groenewegen 2007) show that NC/NM, the ratio of the number of C stars to the number of M stars, is a strong function of the parent galaxy metallicity [Fe/H]. Metal-rich galaxies (like M31 or the Milky-Way) contain predominantly M stars, whereas the AGB populations of metal poor galaxies, like the SMC and other dwarf irregulars in the Local Group, are dominated by carbon stars. This would lead us to expect that the populations of AGB stars in the intermediate-age component of K+A galaxies, which for the most part have solar or greater metallicities, should be completely dominated by late-type M stars.
In fact this assumption is consistent with our observations. For example, the circumstellar envelopes (CSE) of oxygen-rich AGB stars (O-CSE) have SEDs in the mid-IR that are remarkably similar to those we observe in K+A galaxies, particularly, but not exclusively, for stars with optically-thick envelopes (Bedijn 1987; Sargent et al. 2010). If the O-CSE are optically-thick, their contribution to the optical-infrared colours and spectra would be reduced (in agreement with claims by Kriek et al. 2010 and Zibetti et al. 2013). Indeed, Jimenez-Esteban et al. (2005) find that about 1/3 of Galactic OH/IR stars lack an optical and even an infrared counterpart, while for optically-thin envelopes the near-IR features of M stars are significantly less prominent than those of C stars (Wright et al. 2009). This may account for their weakness in the spectra by Zibetti et al. (2013). Moreover, the mid-IR SEDs of C-CSE are bluer (hotter) than those of O-CSE consistent with our observations.
The spectra of late-type M stars exhibit deep VO and TiO molecular absorption bands in the 1.05−1.15μm wavelength range, precisely in the Y and J bands where we find a significant discrepancy between our models and the observations of K+A galaxies. Unfortunately, the spectra of Zibetti et al. (2013) do not cover these wavelengths, but if indeed K+A galaxies contain dominant O-rich AGB populations we should expect these absorption bands to show-up prominently in their spectra.
The BC03 models over-predict the KS-band fluxes, which is not the case for the M2013 models that would seem, therefore, to provide a better treatment for the AGB phases. While M giants have prominent CO features in the KS-band, even for the nearest galaxies in our sample the CO band-head at 2.3 μ is redshifted out of the KS filters of both UKIDSS and 2MASS, so it is unlikely that the discrepancy be due to CO absorption bands.
BC03 also predict too much flux in the L and M bands. M-giants have deep CO lines in the M band, but not at 3.5 μ (Plez 2005). There is evidence from Galactic M-giants and supergiants that the CO lines seem to become weaker with increasing metallicity (Cómeron et al. 2004), which would favour carbon stars as a possible explanation of the discrepancy at L and M. Unfortunately, observations of metal-rich cool giants in these bands are rather scarce, which makes it difficult to test this hypothesis empirically.
4.3. The UV discrepancy
Despite rather large differences in luminosity, the SEDs of K+A galaxies from the optical to the mid-IR below 5 μ are remarkably similar. This suggests that the large scatter we observe in the UV and mid-IR colours of these galaxies (Table 3) may have a common origin. Indeed, Fig. 5 shows that NUV and 12 μ fluxes are correlated. Since our models systematically over predict the UV fluxes, this correlation suggests that both the UV and mid-IR emission from these galaxies may arise from the same (short-lived) stellar populations. In this scenario stochastic effects would explain both the variance in UV and mid-IR fluxes, as well as the systematic discrepancy between models and observations in the UV.
This happens because simple stellar populations (ssp) models, such as M2013 and BC03, integrate the stellar libraries over an IMF (in our case Kroupa or Chabrier) and therefore systematically over-sample the progenitors of rare stellar populations by including fractions of stars in the integrations. In particular, even for the relatively massive intermediate-age populations in K+A galaxies, the number of hot post-AGB stars present at any given time will be small and their observations, therefore, subject to significant stochastic effects.
An alternative explanation could be differential extinction: if K+A galaxies evolve from anything like the starburst galaxies observed at higher redshifts, in the post-starburst phase they could retain some of this clumpiness. The extinction seen by Starlight in the SDSS spectra is some sort of ensemble average over the integrated stellar populations leaving, at least in principle, open the possibility for substantial spatial fluctuations in extinction. Clumpiness, however, introduces an extra degree of freedom in the modelling and one over which we have very limited direct observational constraints, if any. Therefore, while more in-depth modelling is clearly needed to elucidate the UV and mid-IR properties of post-starburst galaxies, we also need spatially resolved observations of a significant sample of objects if we want to constrain both spatial and temporal stochastic effects.
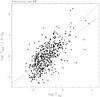 |
Fig. 5 Observed NUV flux corrected for extinction, and normalised to the average i′ band flux of the sample, versus the observed 12μ flux with the same normalisation. The solid line shows a least-squares fit to all the points, and the dashed line corresponds to X = Y. |
5. Conclusions
Post-starburst galaxies provide ideal laboratories to investigate the properties of evolved intermediate age stellar populations at super-solar metallicities, which are extremely rare in our own Galaxy. In particular, these galaxies are ideal to search for the effects of TP-AGB stars in the integrated colours and spectra of galaxies at redshifts of z = 2−3, when the age of the Universe was comparable to the typical ages of TP-AGB stars. Our findings are summarised as follows:
-
1.
K+A galaxies are a remarkably homogeneous class of objects when viewed at optical and IR wavelengths, but not in the ultraviolet or the mid-IR beyond 5 μ;
-
2.
The synthetic SEDs derived from population synthesis fits to the SDSS spectra reproduce remarkably well the observed broad-band SEDs of K+A galaxies, in particular in the SDSS bands. This means, in particular, that the SDSS 3′′ spectral fibres provide a fair sampling of the overall stellar populations of the K+A galaxies in our sample;
-
3.
The synthetic SEDs built using either the M2013 or the BC03 stellar libraries reproduce the broad-band IR colours very well, although small but significant discrepancies remain in the Y and J bands for both libraries and additionally for the KS, L, and M bands for BC03. We suggest that these discrepancies are likely due to insufficient modelling of metal-rich AGB and post-AGB stars in these libraries;
-
4.
Population synthesis modelling of SDSS galaxies provides a robust method for building synthetic templates for measuring photometric redshifts of moderate redshift galaxies. However, it is essential to check that the templates also work in the UV when applied to galaxies at z> 1.5.
These conclusions can be directly tested observationally through IR spectroscopy of metal-rich K+A galaxies, which should reveal prominent VO and TiO molecular features in the Y and J bands, strong CO lines in the M, and possibly also L, bands, and a strong Silicate feature at 10 μm.
Our models fail to reproduce the large variance in the integrated UV and mid-IR colours of K+A galaxies and systematically over predict the UV fluxes. Significant progress in understanding these issues will require spatially resolved observations of a reasonable sample of galaxies from the UV to the mid-IR, as well as a better understanding of AGB and post-AGB giants at high metallicity. In this context it seems particularly important to develop population-synthesis models based on Monte Carlo techniques explicitly taking into account stochastic effects introduced by short-lived stellar populations, for which ssp models are clearly inadequate.
In Paper I we binned the models into 3 broad age groups and 3 metallicity bins.
Acknowledgments
We are grateful to Claudia Maraston for providing us with the M2013 models ahead of publication, and for several very useful comments to the manuscript version of this paper, and to Enzo Brocato for pointing out the importance of stochastic effects starting at the IMF. We thank our anonymous referee for many suggestions leading to a much improved version of the paper.
References
- Abazajian, K., Adelman-McCarthy, J. K., Agüeros, M. A., et al. 2009, ApJS, 182, 543 [NASA ADS] [CrossRef] [Google Scholar]
- Bedijn, P. J. 1987, A&A, 186, 136 [NASA ADS] [Google Scholar]
- Bruzual, G., & Charlot, S. 2003, MNRAS, 344, 1000 [NASA ADS] [CrossRef] [Google Scholar]
- Cardelli, J. A., Clayton, G. C., & Mathys, J. S. 1989, ApJ, 345, 245 [NASA ADS] [CrossRef] [Google Scholar]
- Chisari, N. E., & Kelson, D. D. 2012, ApJ, 753, A94 [NASA ADS] [CrossRef] [Google Scholar]
- Choi, Y., Goto, T., & Yoon, S.-J. 2009, MNRAS, 395, 637 [NASA ADS] [CrossRef] [Google Scholar]
- Cid Fernandes, R., Mateus, A., Sodré, L., Stasińska, G., & Gomes, J. M. 2005, MNRAS, 358, 363 [NASA ADS] [CrossRef] [Google Scholar]
- Cirasuolo, M., McLure, R. J., Dunlop, J. S., et al. 2010, MNRAS, 401, 1166 [NASA ADS] [CrossRef] [Google Scholar]
- Cómeron, F., Torra, J., Chiappini, C., et al. 2004, A&A, 425, 489 [NASA ADS] [CrossRef] [EDP Sciences] [Google Scholar]
- Conroy, C., & Gunn, J. 2010, ApJ, 712, 833 [NASA ADS] [CrossRef] [Google Scholar]
- Eminian, C., Kauffmannm, G., Charlot, S., et al. 2008, MNRAS, 384, 930 [NASA ADS] [CrossRef] [Google Scholar]
- Gordon, K. D., Clayton, G. C., Misselt, K.A., Landolt, A. U., & Wolff, M. J. 2003, ApJ, 594, 279 [NASA ADS] [CrossRef] [EDP Sciences] [Google Scholar]
- Groenewegen, M. 2007 in Why Galaxies Care About AGB Stars; Their Importance as Actors and Probes eds. F. Kerschbaum, C. Charbonnel, & R. F. Wing, ASP Conf. Ser., 378, 433 [Google Scholar]
- Henriques, B., Maraston, C., Monaco, P., et al. 2011, MNRAS, 415, 3571 [NASA ADS] [CrossRef] [Google Scholar]
- Jimenez-Esteban, F. M., Agudo-Merida, L., Engels, D., & Garcia-Lario, P. 2005, A&A, 431, 779 [NASA ADS] [CrossRef] [EDP Sciences] [Google Scholar]
- Kaviraj, S., Kirkby, L. A., Silk, J., & Sarzi, M. 2007, MNRAS, 382, 960 [NASA ADS] [CrossRef] [Google Scholar]
- Kelson, D. D., & Holden, B. P. 2010, ApJ, 713, L28 [NASA ADS] [CrossRef] [Google Scholar]
- Kriek, M., Labbé, I., Conroy, C., et al. 2010, ApJ, 722, L64 [NASA ADS] [CrossRef] [Google Scholar]
- Lancon, A., Mouhcine, M., Fioc, M., & Silva, D. 1999, A&A, 344, L21 [NASA ADS] [Google Scholar]
- Lawrence, A., Warren, S. J., Almaini, O., et al. 2007, MNRAS, 379, 1599 [NASA ADS] [CrossRef] [MathSciNet] [Google Scholar]
- MacArthur, L. A., McDonald, M., Courteau, S., & Jesus Gonzalez, J. 2010, ApJ, 718, 768 [NASA ADS] [CrossRef] [Google Scholar]
- Maraston, C. 1998, MNRAS, 300, 872 [NASA ADS] [CrossRef] [Google Scholar]
- Maraston, C. 2005, MNRAS, 362, 799 [NASA ADS] [CrossRef] [Google Scholar]
- Melbourne, J., Williams, B. F., Dalcanton, et al. 2012, ApJ, 748, A47 [NASA ADS] [CrossRef] [Google Scholar]
- Melnick, J., & De Propris, R. 2013, MNRAS, 431, 2034 (Paper I) [NASA ADS] [CrossRef] [Google Scholar]
- Miner, J., Rose, J. A., & Cecil, G. 2011, ApJ, 727, L15 [NASA ADS] [CrossRef] [Google Scholar]
- Morrissey, P., Conrow, T., Barlow, T. A., et al. 2007, ApJS, 173, 682 [NASA ADS] [CrossRef] [Google Scholar]
- Mouhcine, M., & Lancon, A. 2003, MNRAS, 338, 572 [NASA ADS] [CrossRef] [Google Scholar]
- Nielsen, D., Ridgway, S. E., De Propris, R., & Goto, T. 2012, ApJ, 761, L16 [NASA ADS] [CrossRef] [Google Scholar]
- Noel, N. E. D., Greggio, L., Renzini, A., Carollo, M., & Maraston, C. 2013, ApJ, 772, A58 [NASA ADS] [CrossRef] [Google Scholar]
- Poggianti, B. M., & Wu, H. 2000, ApJ, 529, 157 [NASA ADS] [CrossRef] [Google Scholar]
- Plez, B. 2005, in Cosmic Abundances as Records of Stellar Evolution and Nucleosynthesis in honor of David L. Lambert, eds. T. G. Barnes, & F. N. Bash, ASP Conf. Ser., 336 [Google Scholar]
- Quintero, A. D., Hogg, D. W., Blanton, M. R., et al. 2004, ApJ, 602, 190 [Google Scholar]
- Raichoor, A., Mei, S., Nakata, F., et al. 2011, ApJ, 732, 12 [NASA ADS] [CrossRef] [Google Scholar]
- Renzini, A., & Voli, M. 1981, A&A, 94, 175 [NASA ADS] [Google Scholar]
- Sargent, B., Srinivasan, S., Meixner, M., et al. 2010, ApJ, 716, 878 [NASA ADS] [CrossRef] [Google Scholar]
- Schlafly, E., & Finkelbeiner, O. 2011, ApJ, 737, 103 [NASA ADS] [CrossRef] [Google Scholar]
- Skrutskie, M. F., Cutri, R. M., Stiening, R., et al. 2006, AJ, 131, 1163 [NASA ADS] [CrossRef] [Google Scholar]
- Shin, M.-S., Strauss, M. A., & Tojeiro, R. 2011, MNRAS, 410, 1583 [NASA ADS] [Google Scholar]
- Tonini, C., Maraston, C., Devriendt, J., Thomas, D., & Silk, J. 2009, MNRAS, 396, L36 [NASA ADS] [CrossRef] [Google Scholar]
- Tonini, C., Maraston, C., Thomas, D., Devriendt, J., & Silk, J. 2010, MNRAS, 403, 1749 [NASA ADS] [CrossRef] [Google Scholar]
- Wetzel, A. R., Tinke, J. L., & Conroy, C. 2012, MNRAS, 424, 232 [NASA ADS] [CrossRef] [Google Scholar]
- Wright, N. J., Barlow, M. J., Greimel, R., et al. 2009, MNRAS, 400, 1413 [NASA ADS] [CrossRef] [Google Scholar]
- Wright, E. L., Eisenhardt, Peter, R. M., et al. 2010, AJ, 140, 1868 [NASA ADS] [CrossRef] [Google Scholar]
- Yan, H., Dickinson, M., Eisenhardt, P. R. M., et al. 2004, ApJ, 616, 63 [NASA ADS] [CrossRef] [Google Scholar]
- Zibetti, S., Gallazzi, A., Charlot, S., Pierini, D., & Pasquali, A. 2013, MNRAS, 428, 1479 [NASA ADS] [CrossRef] [Google Scholar]
All Tables
All Figures
|
Fig. 1 Comparison between the predicted synthetic SED for the average of the 808 K+A galaxies in our sample and the average of the observed broad-band luminosities for a maximum of 723 galaxies (see Table 3) of redshifts 0.04 <z< 0.3 (selected to minimise wavelength smearing in the averaged SEDs) corrected for internal and foreground extinction using the typical MW extinction law, and normalised to the SDSS i′-band (F0.767 μm). The orange line shows the synthetic SED constructed using the Maraston (2005) models and the black line shows the result of using exactly the same stellar populations, but with the synthetic SED built using the Maraston (2013, priv. comm.) models. The magenta line represents the Tdust = 300 K Black-Body component that we added to match the mid-IR data. |
| In the text | |
|
Fig. 2 Comparison between the photometric observations and the mean synthetic SED built using only the BC03 models. The averaging of the photometric data points was done as for Fig. 1 as well as the corrections for extinction using the CCM reddening law. The insert presents the average star-formation history − for three broad metallicity bins − of all galaxies in the sample used to compute the mean synthetic SEDs, for both the BC03 model shown in this figure, and the M2013 models shown in Fig. 1. |
| In the text | |
|
Fig. 3 Left: distributions of the difference between the observed and modelled photometric fluxes from the FUV to the mid-IR for the BC033 models. (The details of each histogram are summarised in Table 3.) The histograms have been shifted for clarity and the vertical bars show the zero points for each color (Observed − Model = 0). Right: same as left but for the M2013 models. |
| In the text | |
|
Fig. 4 Left: object-by-object comparison between models and observations for the UKIDSS Y and J bands for the BC03 models (black points) and the M2013 models (red points). Right: object-by-object comparison between models and observations for the WISE 3.5μ and 4.6μ bands. The dashed lines mark the zeroes (Model=Observed), and the solid line shows the locus of Y = X. |
| In the text | |
|
Fig. 5 Observed NUV flux corrected for extinction, and normalised to the average i′ band flux of the sample, versus the observed 12μ flux with the same normalisation. The solid line shows a least-squares fit to all the points, and the dashed line corresponds to X = Y. |
| In the text | |
Current usage metrics show cumulative count of Article Views (full-text article views including HTML views, PDF and ePub downloads, according to the available data) and Abstracts Views on Vision4Press platform.
Data correspond to usage on the plateform after 2015. The current usage metrics is available 48-96 hours after online publication and is updated daily on week days.
Initial download of the metrics may take a while.