Fig. 4
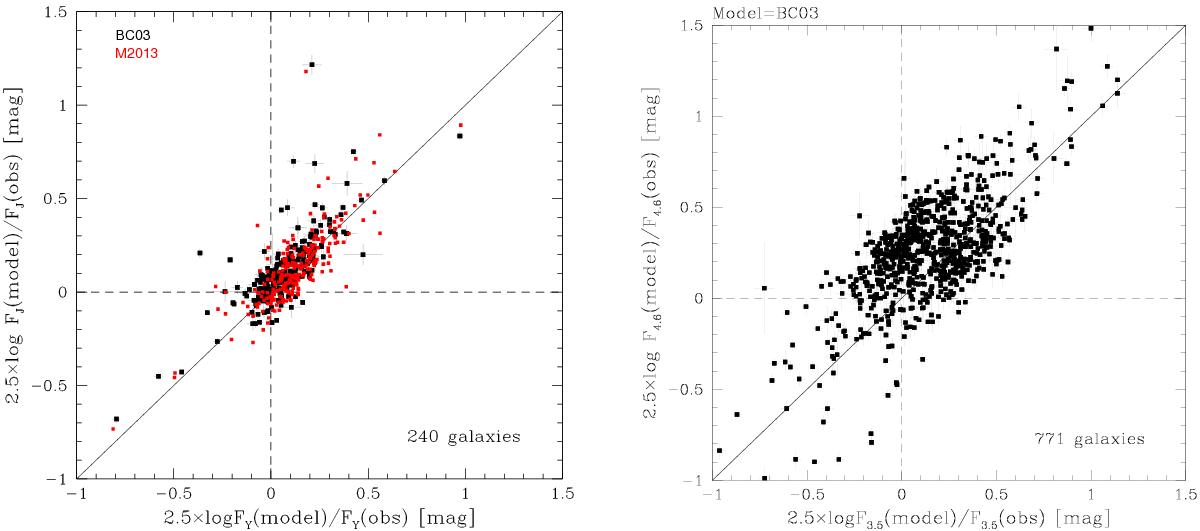
Left: object-by-object comparison between models and observations for the UKIDSS Y and J bands for the BC03 models (black points) and the M2013 models (red points). Right: object-by-object comparison between models and observations for the WISE 3.5μ and 4.6μ bands. The dashed lines mark the zeroes (Model=Observed), and the solid line shows the locus of Y = X.
Current usage metrics show cumulative count of Article Views (full-text article views including HTML views, PDF and ePub downloads, according to the available data) and Abstracts Views on Vision4Press platform.
Data correspond to usage on the plateform after 2015. The current usage metrics is available 48-96 hours after online publication and is updated daily on week days.
Initial download of the metrics may take a while.