Fig. 1
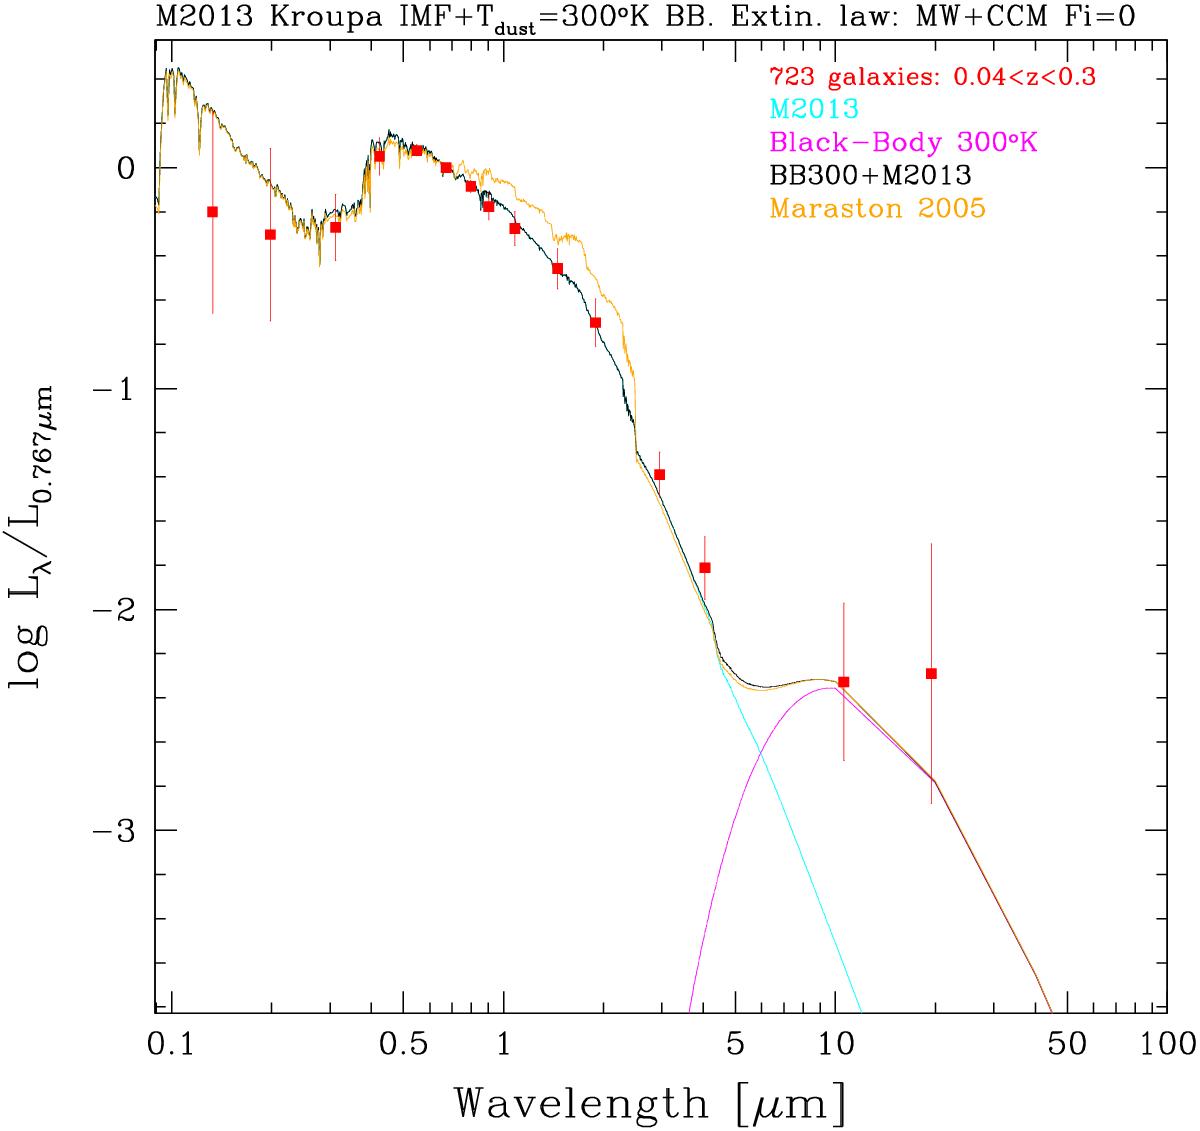
Comparison between the predicted synthetic SED for the average of the 808 K+A galaxies in our sample and the average of the observed broad-band luminosities for a maximum of 723 galaxies (see Table 3) of redshifts 0.04 <z< 0.3 (selected to minimise wavelength smearing in the averaged SEDs) corrected for internal and foreground extinction using the typical MW extinction law, and normalised to the SDSS i′-band (F0.767 μm). The orange line shows the synthetic SED constructed using the Maraston (2005) models and the black line shows the result of using exactly the same stellar populations, but with the synthetic SED built using the Maraston (2013, priv. comm.) models. The magenta line represents the Tdust = 300 K Black-Body component that we added to match the mid-IR data.
Current usage metrics show cumulative count of Article Views (full-text article views including HTML views, PDF and ePub downloads, according to the available data) and Abstracts Views on Vision4Press platform.
Data correspond to usage on the plateform after 2015. The current usage metrics is available 48-96 hours after online publication and is updated daily on week days.
Initial download of the metrics may take a while.