Fig. 3
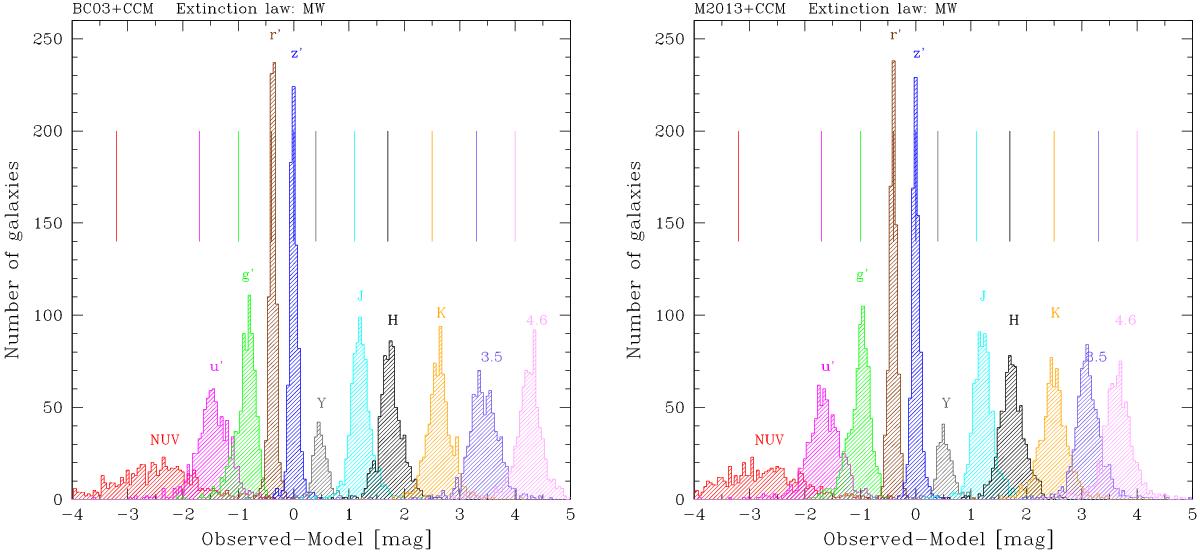
Left: distributions of the difference between the observed and modelled photometric fluxes from the FUV to the mid-IR for the BC033 models. (The details of each histogram are summarised in Table 3.) The histograms have been shifted for clarity and the vertical bars show the zero points for each color (Observed − Model = 0). Right: same as left but for the M2013 models.
Current usage metrics show cumulative count of Article Views (full-text article views including HTML views, PDF and ePub downloads, according to the available data) and Abstracts Views on Vision4Press platform.
Data correspond to usage on the plateform after 2015. The current usage metrics is available 48-96 hours after online publication and is updated daily on week days.
Initial download of the metrics may take a while.