Free Access
Fig. 5
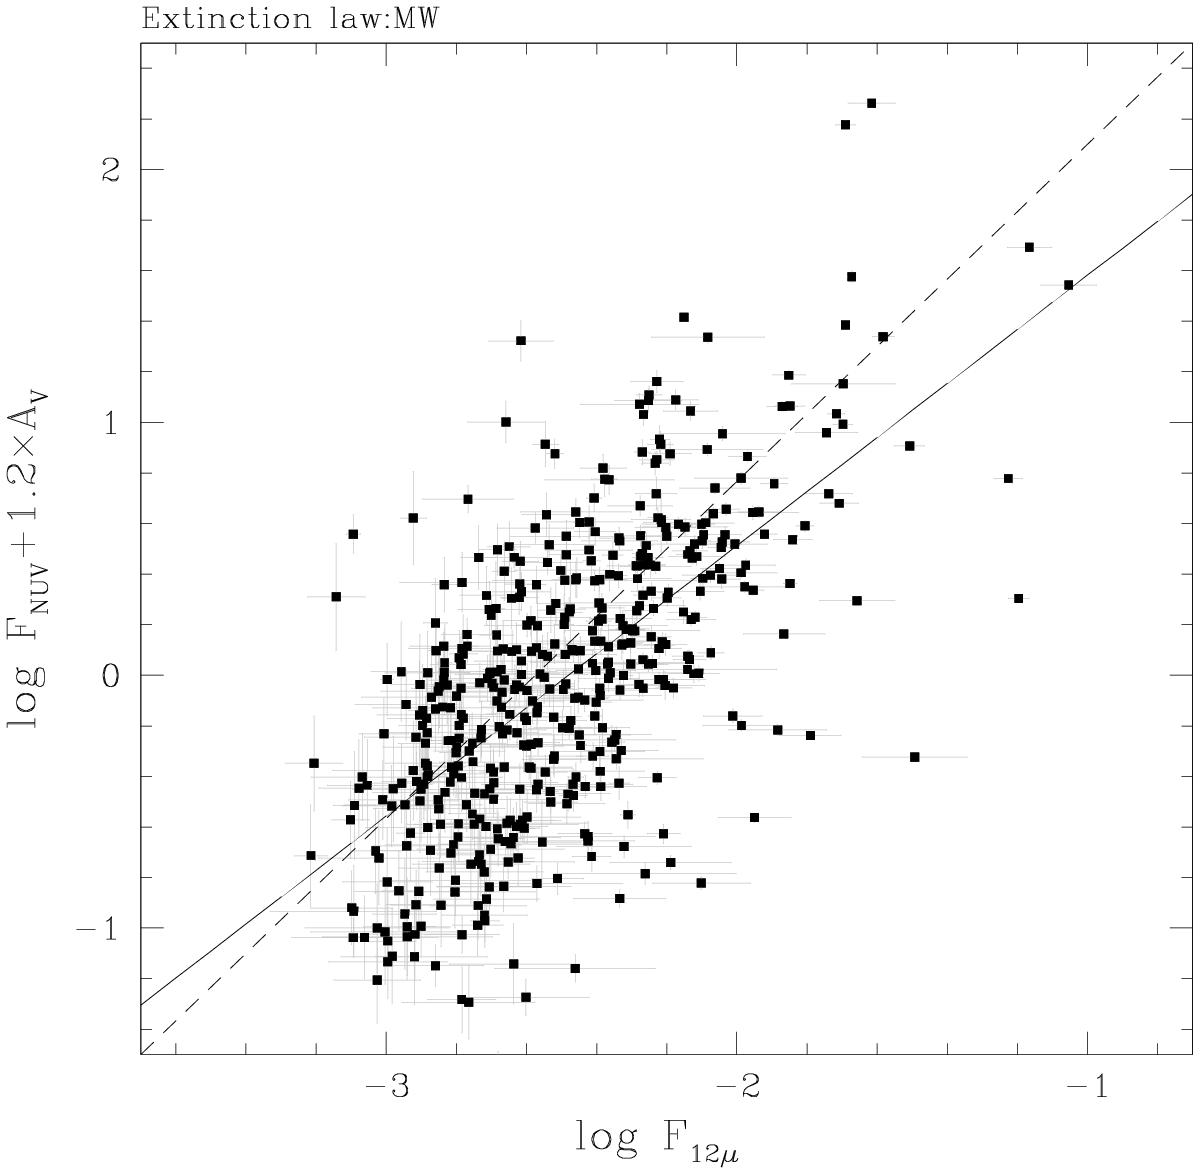
Observed NUV flux corrected for extinction, and normalised to the average i′ band flux of the sample, versus the observed 12μ flux with the same normalisation. The solid line shows a least-squares fit to all the points, and the dashed line corresponds to X = Y.
Current usage metrics show cumulative count of Article Views (full-text article views including HTML views, PDF and ePub downloads, according to the available data) and Abstracts Views on Vision4Press platform.
Data correspond to usage on the plateform after 2015. The current usage metrics is available 48-96 hours after online publication and is updated daily on week days.
Initial download of the metrics may take a while.