| Issue |
A&A
Volume 570, October 2014
|
|
|---|---|---|
| Article Number | A100 | |
| Number of page(s) | 20 | |
| Section | Stellar structure and evolution | |
| DOI | https://doi.org/10.1051/0004-6361/201424522 | |
| Published online | 03 November 2014 | |
Revisiting CoRoT RR Lyrae stars: detection of period doubling and temporal variation of additional frequencies⋆,⋆⋆,⋆⋆⋆,⋆⋆⋆⋆
1
Konkoly Observatory, MTA CSFK,
Konkoly Thege Miklós út
15-17
1121
Budapest
Hungary
e-mail:
This email address is being protected from spambots. You need JavaScript enabled to view it.
2
Laboratoire Lagrange, Université Nice Sophia-Antipolis, UMR 7293,
Observatoire de la Côte d’Azur 06300, Nice, France
3 INAF − Osservatorio Astronomico di Brera, via E. Bianchi 46,
23807 Merate ( LC), Italy
4
LESIA, Université Pierre et Marie Curie, Université Denis Diderot,
Observatoire de Paris, 92195
Meudon Cedex,
France
5
Institute of Astronomy, University of Vienna,
Türkenschanzstrasse 17,
1180
Vienna,
Austria
6
Harvard-Smithsonian Center for Astrophysics, 60 Garden
Street, Cambridge
MA
02138,
USA
7
Instituut voor Sterrenkunde, K.U. Leuven, Celestijnenlaan
200D, 3001
Heverlee,
Belgium
8
Max Planck Institute for Solar System Research,
Justus-von-Liebig-Weg 3,
37077
Göttingen,
Germany
9
Stellar Astrophysics Centre, Department of Physics and Astronomy,
Aarhus University, Ny Munkegade
120, 8000
Aarhus C,
Denmark
10
Université de Toulouse, UPS-OMP, IRAP, Toulouse, France
11
CNRS, IRAP, 14
avenue Edouard Belin, 31400
Toulouse,
France
Received: 3 July 2014
Accepted: 1 August 2014
Abstract
Context. High-precision, space-based photometric missions like CoRoT and Kepler have revealed new and surprising phenomena in classical variable stars. Such discoveries were the period doubling in RR Lyrae stars and the frequent occurrence of additional periodicities some of which can be explained by radial overtone modes, but others are discordant with the radial eigenfrequency spectrum.
Aims. We search for signs of period doubling in CoRoT RR Lyrae stars. The occurrence of this dynamical effect in modulated RR Lyrae stars might help us to gain more information about the mysterious Blazhko effect. The temporal variability of the additional frequencies in representatives of all subtypes of RR Lyrae stars is also investigated.
Methods. We preprocess CoRoT light curves by applying trend and jump correction and outlier removal. Standard Fourier technique is used to analyze the frequency content of our targets and follow the time-dependent phenomena.
Results. The most comprehensive collection of CoRoT RR Lyrae stars, including new discoveries is presented and analyzed. We found alternating maxima and in some cases half-integer frequencies in four CoRoT Blazhko RR Lyrae stars, as clear signs of the presence of period doubling. This reinforces that period doubling is an important ingredient for understanding the Blazhko effect – a premise we derived previously from the Kepler RR Lyrae sample. As expected, period doubling is detectable only for short time intervals in most modulated RRab stars. Our results show that the temporal variability of the additional frequencies in all RR Lyrae subtypes is ubiquitous. The ephemeral nature and the highly variable amplitude of these variations suggest a complex underlying dynamics of and an intricate interplay between radial and possibly nonradial modes in RR Lyrae stars. The omnipresence of additional modes in all types of RR Lyrae – except in non-modulated RRab stars – implies that asteroseismology of these objects should be feasible in the near future.
Key words: stars: variables: RR Lyrae / stars: oscillations / stars: interiors / techniques: photometric
The CoRoT space mission was developed and operated by the French space agency CNES, with participation of ESA’s RSSD and Science Programs, Austria, Belgium, Brazil, Germany, and Spain.
Follow-up observations were obtained at Piszkés-tető, the Mountain Station of Konkoly Observatory.
Appendices are available in electronic form at http://www.aanda.org
Full Table 3 is only available at the CDS via anonymous ftp to cdsarc.u-strasbg.fr (130.79.128.5) or via http://cdsarc.u-strasbg.fr/viz-bin/qcat?J/A+A/570/A100
© ESO, 2014
1. Introduction
Basic parameters of the CoRoT RR Lyrae stars.
The advent of space photometry has opened up new vistas in investigating stellar pulsations and oscillations. Pulsating variable stars located in the classical instability strip are no exception. RR Lyrae stars in particular have benefited from the continuous and ultra-precise space photometric data delivered by MOST (Walker et al. 2003), CoRoT (Baglin et al. 2006), and Kepler (Borucki et al. 2010).
One of the surprising findings was the period-doubling phenomenon (hereafter PD) in the ultra-precise Kepler RR Lyrae light curves (Kolenberg et al. 2010; Szabó et al. 2010), which shows up as the alternating height of maximum brightness and alternating light curve shape from cycle to cycle in the photometric light curve and half-integer frequencies (HIFs) between the dominant pulsation mode and its harmonics in the frequency domain. So far only the Kepler stars have been investigated to describe the phenomenon, but such a detailed analysis is still missing for CoRoT RR Lyrae stars. This prompted us to re-examine the published CoRoT RR Lyrae light curves and extend the study by adding new ones, as well.
This PD is found only in the case of modulated (Blazhko) RR Lyrae stars, though a thorough search was done on unmodulated Kepler RRab stars, too (Szabó et al. 2010; Nemec et al. 2011). Therefore, it is plausible to assume that either PD plays an important role as a nonlinear dynamical phenomenon in causing the Blazhko-modulation (see Smolec et al. 2012 for a hydrodynamic example of PD causing modulation in BL Herculis stars) or at least it shows up as a frequent companion effect of the modulation. In either case, it is important to find well-documented cases, establish the frequency of the PD occurrence, and investigate its temporal behavior and other characteristics. In addition, the physical explanation of PD itself was unambiguously traced back to a 9:2 resonance between the fundamental pulsational mode and a high-order radial (strange) overtone (Kolláth et al. 2011), which opens a new way to study the dynamics of these high-amplitude variable stars belonging to the horizontal branch.
In recent years a new picture has started to emerge regarding the frequency spectrum of RR Lyrae stars. Thanks to dedicated telescopes (Jurcsik et al. 2009a) and space-based photometry, additional frequencies have been found in many stars that were observed with at least millimagnitude precision: AQ Leo (RRd) (Gruberbauer et al. 2007), MW Lyr (Jurcsik et al. 2008), CoRoT (Poretti et al. 2010; Chadid et al. 2010), and Kepler stars (Benkő et al. 2010).
These additional periodicities do not fit the series of radial pulsational modes (or the occasional half-integer series due to PD) and present a low-amplitude variability in each case. Presently, the best explanation for their presence is the excitation of nonradial modes. If this turns out to be true, we may have another handle on the interior of horizontal branch stars to understand the stability, pulsation, and evolution of these standard candles better. In some cases we unexpectedly found frequencies with low amplitudes at or near the radial overtones (e.g., Benkő et al. 2010) that might correspond to radial modes excited by resonances or nonradial modes with frequencies in 1:1 resonance with the corresponding radial mode (Dziembowski & Mizerski 2004; Van Hoolst et al. 1998). The era of exploiting the power of nonlinear seismology using radial modes in RR Lyrae stars is imminent (Molnár et al. 2012).
In this work we embarked on investigating all the known CoRoT Blazhko RR Lyrae stars up to LRc04 in order to detect period doubling. The detection or nondetection would help for finding out how frequent this phenomenon is, further strengthening its role in and connection to the mysterious Blazhko effect. Our second aim is to investigate the recently found new periodicities in all types of RR Lyrae stars. This kind of research is only possible with the photometric precision of CoRoT for these stars. We are especially interested in the temporal stability of these additional frequencies.
The structure of this paper is the following. In Sect. 2 we introduce the original space-borne and ground-based follow-up data we use in this analysis. In Sect. 3 we discuss the methods for finding period doubling and to detecting the variations in low-amplitude periodicities. In Sect. 4 we present our results, then in Sect. 5 we discuss them and draw our conclusions followed by a short summary in Sect. 6. Hitherto unpublished frequency tables and other complementary results can be found in the Appendices.
Throughout this work we use the notations f0, f1, f2, etc. to denote the frequency of the radial pulsation modes (fundamental, first overtone, second overtone, etc.), while f′ and f′′ stand for additional, independent frequencies. We refer to the CoRoT stars with the last three digits of their ID number for a brief notation, which provides a unique identification, e.g. 962 for CoRoT 0100689962.
2. Observations
2.1. CoRoT observations
CoRoT has conducted long-duration, continuous, very-high-precision relative photometry on a few very bright stars and on a large number of faint ones (Baglin et al. 2006). As an attempt to review the CoRoT RR Lyrae stars, we investigate 13 stars listed in Table 1. Table 1 gives the CoRoT ID, the coordinates, the V magnitude, the CoRoT run in which the object was observed and discovered, its pulsation and modulation parameters (if applicable), as well as references if the star has been already analyzed.
The brightness of the targets that were observed in the exofield of CoRoT are measured through a prism that creates images that contain red, green, and blue fluxes. The color fluxes are not available for all stars, and in such cases only the sum of them (white light) is retained. Though these fluxes are not related to any photometric systems, they are still useful, such as comparing the amplitudes of variability in some of our cases. The interested reader can find an example for the use of CoRoT color fluxes in Paparó et al. (2011).
The CoRoT RR Lyrae group analyzed those stars that were classified as such by the CoRoT Variability Classifier (CVC; Debosscher et al. 2009) up to the fourth pointing (LRc04). We note that one of these stars, CoRoT 1027817750 (observed during LRa01, originally classified as an RR Lyrae star with a 67% probability), is found to be non-RR Lyrae by Paparó et al. (2011). We took those targets that were classified as RRab pulsators with non-zero probability and found eight bona fide RRab stars out of 14. In addition to that sample we found CoRoT RR Lyrae star 648 early in the mission. Furthermore, we added one more object to the classified RR Lyrae stars that was found by Affer et al. (2012) while investigating stellar rotation periods in CoRoT light curves in runs LRc01 and LRa01. Upon inspecting the published light curves manually, we confirmed that 488 is a new RRab variable. Light curve characteristics, frequencies, epoch, and more details on this target can be found in Appendix A.
RRc classification is more problematic, since eclipsing binaries (e.g. W UMa stars) can exhibit similar light curve shapes, thus the contamination of a sample originating from automated classification is much higher. Therefore we chose the >80% probability level assigned by CVC and found only two genuine RRc stars out of 17 candidates. We note that decreasing the probability limit to 50% or 10% did not help to find more RRc stars, but increased the number of eclipsing binaries and other types enormously.
Interestingly, we have RR Lyrae stars only in the direction of the Galactic center. This obviously might be a selection effect because we observe mostly disk-population stars when the satellite points in the anticenter direction. The length of observations varies from 158 days (LRc01) and 150 days (LRc02) to 88 days (LRc04), in all cases the duty cycle being over 90%. Time is given in heliocentric Julian date throughout the paper; however, when showing light curves we use the CoRoT Julian date (CJD). The relation between the heliocentric Julian date and the CJD is  We used the N2 level calibrated CoRoT light curves. We applied trend and jump filtering and outlier removal as described in detail in Chadid et al. (2010). Because we usually deal with relatively faint targets, only two RR Lyrae in our sample have CoRoT colors (544 and 818), but we use only the integrated (white) light to increase the signal-to-noise ratio. The nominal sampling is 512 s for all the stars, except these two targets, where the initial part of the light curves were observed with the 512 s mode, while the rest of the light curve was observed with the much denser short cadence mode (32 s).
Observations of the CoRoT LRc01 RR Lyrae stars at the Konkoly Observatory that were used in this paper.
2.2. Ground-based follow-up observations
Ground-based multi-color observations on some of the CoRoT RR Lyrae stars discussed in this paper were collected in 2008 and 2009 with the 1-m Ritchey-Chrétien-Coudé (RCC) telescope mounted at Piszkés-tető Mountain Station of the Konkoly Observatory. These observations were especially helpful in determining the true pulsational nature in the cases where our targets are heavily blended in the CoRoT apertures.
A Versarray 1300B camera with an UV-enhancement coating constructed by Princeton Instruments was used. This device contains a back-illuminated EEV CCD36-40 1340 × 1300 chip that corresponds to a  field of view (FOV) with 0.303″/pixel scale. Standard Johnson BV and Kron-Cousins RC filters were used in the observations. The typical exposure times were 300, 180, 100 s for bands B, V, and RC, respectively. Each night dome flats, bias, and dark frames were taken as main calibration images.
We used the IRAF/CCDRED1 package for the standard reduction procedures: bias, dark, and flat-field correction. The brightness of stars was determined by using the aperture photometry task DAOPHOT/PHOT of IRAF. We carried out differential photometry with carefully selected comparison stars. These were found to be constant and fit the target stars both in their brightness and colors. The telescope constants were obtained using the standard stars of the open cluster M 67 (Chevalier & Ilovaisky 1991). The typical errors of the individual observations were between 0.01 and 0.02 mag in BVRC. The log of the observations is presented in Table 2, while the ground-based BVRC light curves are available in electronic form via the website of the journal. A sample of this file is shown in Table 3 for guidance.
Ground-based, multi-color observations of CoRoT RR Lyrae stars taken with the 1m RCC telescope of the Piszkés-tető Mountain Station of the Konkoly Observatory.
3. Methodology
We applied standard packages, such as MuFrAn (Kolláth 1990) and Period04 (Lenz & Breger 2005), to perform Fourier analysis.
3.1. Detection of period doubling
There is no obvious, strongly alternating pattern in the CoRoT RR Lyrae maxima that could have triggered a thorough analysis earlier, though in some cases a detailed inspection does show period doubling persisting through a few pulsational cycles as we show later in this work.
CoRoT light curves are shorter than the Kepler ones and have lower precision at the same apparent brightness. The typical error of the individual data points for a 16th-magnitude RR Lyrae is 0.006−0.012 mag for the CoRoT observations, and 0.0008−0.003 mag for an RR Lyrae of the same brightness observed by Kepler. In addition, since period doubling is usually only temporarily noticeable in the light curves (but see Le Borgne et al. 2014), we do not expect to see PD signs in both the light curve and the frequency spectrum in each case. The strength of PD is not correlated with the Blazhko phase, as we saw earlier in the example of RR Lyrae itself and other modulated RRab stars. Therefore here we need to relax the strict criteria applied in Szabó et al. (2010), where we required the presence of PD signs in both the time and the frequency domains. Consequently, in this work we investigate both the Fourier spectrum between the dominant mode and its harmonics, aiming at finding HIFs at exactly between two consecutive harmonics and the light curves themselves, looking for suspicious alternating pattern. We report tentative detection in those cases where PD is present in either or both domains.
For detecting PD in the Fourier spectrum we set a conservative limit, i.e. 3σ detection for the HIFs. The rms for half-integer frequencies ((2k + 1) / 2·f0) was computed in the intervals between consecutive harmonics of the dominant pulsational mode [k·f0;(k + 1)·f0] after prewhitening with significant additional frequencies and the Blazhko side peaks. The [f0;2f0] frequency interval is the most interesting one, because all the known stars undergoing the period-doubling bifurcation found in the Kepler sample show the highest half-integer frequency amplitude in this particular interval (Szabó et al. 2010).
To investigate the alternating nature of the pulsational cycles, the photometric maxima were fitted with seventh or ninth-order polynomials (Chadid et al. 2010) to get rid of the detrimental effects of missing photometric points or (in the case of blended Blazhko stars) large scatter. For more details of this process, we refer to Chadid et al. (2010).
 |
Fig. 1 Test results for detection of the temporal variation of low-amplitude frequencies. Left panel: the amplitude of the constant, 3 mmag amplitude frequency injected at ftest = 3.0 d-1 into the light curve of 241, a CoRoT RRc star (see Sect. 4.3). Right panel: a more complex case: we added a constant (3 mmag) amplitude frequency to the light curve of the strongly modulated Blazhko RR Lyrae, 962. We chose ftest = 3.4 d-1. Horizontal lines show the amplitude of the injected signal, points with error bars come from our method. The upper row shows the shape and the vicinity of the recovered frequency in the applied eight bins. |
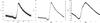 |
Fig. 2 Jump- and trend-filtered, phased light curves of CoRoT non-Blazhko RRab stars. Left panel: the newly found RR Lyrae, 488. The small amplitude and the relatively large scatter indicate a blended CoRoT target. Middle panel: the new, unmodulated RR Lyrae, 818. Having over 177 000 data points, we plot only every 10th data point for visualization purposes. Right panel: light curve of the new, unmodulated RR Lyrae, 804. |
3.2. Frequency analysis and time-dependent frequencies
To get the time dependence of the properties of a frequency peak, we cut the photometric data into chunks of equal length, and the respective amplitudes and frequencies and their uncertainties were obtained from these shorter data sections with Period04. We tried to cut the light curve into two-four-eight, etc., pieces, and stopped where the uncertainties (primarily due to the shortening of the data sections) precludes the derivation of any meaningful information. In most of the cases, eight bins were used for uniformity. This is a compromise between the time resolution of the variabilities and the frequency resolution permitted by the lengths of the data chunks, which could not be deteriorated arbitrarily, because close-by frequency peaks often occur. We performed simulations to make sure that any arbitrary time shift (i.e. the exact starting epoch of the subsections) does not have a significant effect on the amplitudes of the studied frequencies.
In all cases the main pulsation mode(s), their harmonics, the Blazhko frequency, its harmonics, and the modulation side peaks (where applicable) were subtracted before we embarked on computing the time variable amplitude of the additional peaks. Error bars were derived by a Monte Carlo method available in Period04.
To check whether the successive prewhitening, the strong Blazhko modulation and other time-dependent features have an appreciable effect on the method we used to detect temporal variation of low-amplitude frequency peaks, we designed a series of tests. First we added a 3.0 mmag, constant amplitude sinusoidal signal with a frequency of 3.0 d-1 to the light curve of 241, an RRc star (see Sect. 4.3). The vicinity of 3.0 d-1 in the Fourier spectrum is relatively clean, i.e. free of contaminating frequencies. This light curve was subjected to the same procedure as all the CoRoT targets, namely the light curve was cut into eight bins, and the main pulsation frequency and its harmonics were subtracted in each bin. As we see in the left hand panel of Fig. 1, the injected constant amplitude signal was preserved, the error introduced by the process is a few percent, and it does not exceed 10% in any case. This means that in a sparse frequency spectrum we can confidently detect the time dependence of low-amplitude signals without introducing amplitude variability with our methods.
The right hand panel of Fig. 1 shows a more complex case. We chose 962, a strongly modulated Blazhko star. The frequency spectrum of this star contains more frequencies (Chadid et al. 2010), making the analysis more complicated. This time we squeezed an ftest = 3.4 d-1 signal with 3-mmag constant amplitude in between other frequencies. As suspected, in this case we got higher scatter around the constant amplitude. A ten percent deviation from the nominal value is not unusual, and even larger excursions occur in some cases. The computed error bars more or less capture this scatter, and the deviation rarely exceeds the assigned sigma. Evidently, in case of a dense frequency spectrum with evidence of strong temporal variations (such as a Blazhko modulation and period doubling), one has to exercise extra care when interpreting amplitude variability of low-amplitude signals. It is reassuring, however, that the structure of the frequency peaks does not deform because of the procedure, as long as there are no close immediate frequency peaks in the vicinity of our test signal.
4. Results
In the next sections we discuss our targets one by one, focusing on those stars and features that have not been discussed earlier. In the case of previously published results or those in preparation, we refer to the corresponding paper(s). However, for the sake of completeness, we decided to list all CoRoT objects reliably classified as RR Lyrae stars up to LRc04. First we describe unmodulated RRab stars followed by Blazhko stars, then RRc stars are listed, finally the only double-mode (RRd) star is discussed.
4.1. Non-Blazhko RRab stars
CoRoT 0101370131: this mono-periodic RRab star was analyzed in detail in Paparó et al. (2009). In the course of this work we checked again that no additional frequencies, including signs of HIFs, can be found in the frequency spectrum. We give an upper limit of 0.30 mmag for the latter (Table 4). We also checked whether the maxima show any periodicity or pattern, as a sign of a thus far hidden, low-amplitude Blazhko-effect, but failed to find any significant periodicities.
CoRoT 0101315488: Affer et al. (2012) found 169 pulsating stars while investigating stellar rotation periods and ages in CoRoT light curves of spotted stars in runs LRc01 and LRa01. Upon inspecting the published light curves manually, we encountered a new RR Lyrae-like object, 488, besides finding other, already known RR Lyrae variables.
As this is a new finding, we discuss the properties of this object in detail. The coordinates of the new variable are RA = 19h27m , Dec = 0°
 . For the brightness of the main target, the ExoDat database gives the following values: B = 17.163, V = 16.152, R = 15.740, I = 15.072. Based on the contamination index (0.222), blending can be considered to be severe.
The light curve shape is of a typical RRab, but the total amplitude is rather small ( ). We therefore suspect that this variable star is indeed blended. The relatively high scatter also corroborates this argument (see Fig. 2, left panel). The pulsation period is constant during the CoRoT run.
Figure 3 shows the DSS and the EXODAT images of our target. EXODAT lists six close-by stars of magnitude 17.5−20.5, within the CoRoT aperture. It is conceivable that one of these might be the RR Lyrae, but based on the available data, we cannot tag the exact source of variation. The pulsation parameters, frequency table, epoch, and discussion of the frequency spectrum can be found in Appendix A. We note here only that no PD was found in the spectrum with an upper limit of 0.10 mmag for any half-integer frequencies.
CoRoT 0103800818: this star was observed by CoRoT in LRc04, and it is described here for the first time. It started to be observed with nominal cadence (512 s) but soon after it was switched to short cadence (32 s) observations in color mode. To enhance the signal-to-noise here we only use the integrated (white) light curve. With a period of 0.4659348 days it is a unmodulated RRab star. We did not detect period doubling with an the upper limit of 0.10 mmag set for the half-integer frequencies. The phase-folded light curve is shown in the middle panel of Fig. 2.
Owing to the early switch to high cadence observations, fifty-six harmonics has been found in the frequency spectrum. So far this is the largest number we are aware of. The amplitude distribution is very similar to 131 (Paparó et al. 2009), i.e. there is a local minimum in the amplitudes of the harmonics around the 15th harmonics (32 d-1). The harmonics in the higher frequency range come with a different slope after this trough in the distribution. While we cannot confirm this behavior with the other two unmodulated CoRoT RRab stars (488 and 804) because of the lower cadence observations, it would be interesting to see the amplitude distribution in the case of other RRab stars observed from space with high cadence.
Apart from that, only the CoRoT orbital frequencies and some residuals around the main frequency peaks are visible in the frequency spectrum. We could identify neither regular frequency side peaks that would signal the presence of the Blazhko effect nor half-integer or any other frequencies. The frequency table is given in Appendix B.
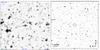 |
Fig. 3 Left: 2.6′ × 2.6′ DSS image showing the neighborhood of 488. Right: a larger surroundings of the star 488 showing the applied aperture as well. Several faint stars are shown within the aperture. North is up and east to the left in both images. |
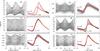 |
Fig. 4 Phase-folded CoRoT Blazhko light curves. Left: folded by the Blazhko-period, right: folded by the pulsational period. Representative averaged light curves are shown in two extreme modulation phases in each case in the right panels. |
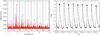 |
Fig. 5 Left panel: low-frequency part of the Fourier spectrum of 962. The dominant pulsation frequency (f0), its harmonics and the modulation triplets were pre-whitened. Black lines show the location of f0 and its harmonics, while the blue dash-dotted lines show the location of the half-integer frequencies. To visualize the distribution of the amplitudes of the HIFs we plotted black points on top of the frequencies stemming from the PD effect. The HIFs are significant up to 11 / 2f0. Right panel: small part of the CoRoT light curve of 962 clearly showing alternating maxima, i.e. period doubling. Fitted maxima are plotted to guide the eye. |
CoRoT 0104315804: this star was also observed in LRc04, and it has not been published yet. It was monitored with nominal cadence (512 s) and only in white light. It is a non-Blazhko star with a period of 0.7218221 days. We could not detect period doubling with an upper limit of 0.30 mmag. The frequency spectrum is also devoid of statistically significant additional periodicities. The frequency table is given in Appendix C, while the phase-folded light curve is plotted in the right hand panel of Fig. 2.
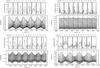 |
Fig. 6 Temporal variation of the amplitude of additional frequencies in CoRoT Blazhko RR Lyrae stars. The CoRoT photometric light curves were split into eight chunks, the dominant pulsational frequency, its harmonics and the modulation side peaks were prewhitened. The Fourier spectrum in the vicinity of the additional frequencies (denoted by small vertical lines) are shown in the upper parts of the subfigures. Upper left: temporal variation of the half-integer frequency at 3 / 2f0 = 4.1916 d-1 and the independent frequency f′ = 4.03265 d-1 in the Blazhko RR Lyrae 962. Upper right: the same for the CoRoT Blazhko RR Lyrae star 793. The frequencies are 3 / 2f0 = 3.159 d-1 and f1 = 3.63088 d-1. Lower left: the variation of f′ = 2.389287 d-1 additional frequency in the blended CoRoT Blazhko RR Lyrae star 544. Lower right: the same for the Blazhko star 363, where f′ = 2.98400 d-1. |
4.2. RRab stars showing the Blazhko effect
CoRoT 0100689962 is identical with V1127 Aql. It has a strongly modulated light curve, with a high pulsational amplitude and a pronounced phase modulation as is easily seen in the left hand panel of Fig. 4. The modulation is not sinusoidal (Benkő et al. 2011) and is asymmetric in the sense that the maximum of the maxima and the minimum of the minima shows considerable shift. A detailed study has been published on this object by Chadid et al. (2010).
We found alternating cycles in the light curve of 962 (see the right hand panel of Fig. 5.) Half-integer frequencies between the fundamental mode and its harmonics up to 11 / 2f0 are also found, demonstrated in the left panel of Fig. 5. A forest of peaks can be found around the HIFs. This may be a consequence of the excitation of additional (nonradial) modes, or due to the interplay of the time-variable PD and the modulation itself (see a simulation suggesting this scenario in Szabó et al. 2010), or both. The amplitude distribution of the HIFs is very similar to other cases (see Szabó et al. 2010): the highest peak is at 3 / 2f0, then there is a monotonous decrease with the order, however, at 9 / 2f0 there is a local maximum (a standstill in the case of 962), which is the consequence of the 9:2 resonance with the ninth overtone (Kolláth et al. 2011). We could identify HIFs up to 11 / 2f0 above the 3σ significance level. The alternating cycles in the light curve and the presence of the half-integer frequencies in the frequency domain constitute an unambiguous detection of the period doubling phenomenon in 962. It is evident that the PD is not always present with the same strength throughout the 142-day CoRoT observations. Instead, we see it in the light curve for short time intervals, e.g. CJD[2750:2754] as shown in Fig. 5 or CJD[2794:2798] (not shown).
In the frequency spectrum of 962 there is another, independent frequency peak, f′ = 4.03265 d-1. This is quite close to the 3/2f0 frequency value, and there is a dense region of frequencies around them (Fig. 7 of Chadid et al. 2010), which makes the detection of the temporal variation of these frequencies extremely challenging. We made a series of tests to take the effects of the decreased frequency resolution due the splitting of the original data set into account, and we found variation in the amplitude in both the 3/2f0 HIF and f′ (upper left panel of Fig. 6), although this conclusion is quite weak and may be a consequence of contamination from other close-by frequencies.
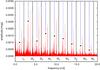 |
Fig. 7 Same as the left panel of Fig. 6, but for CoRoT Blazhko RRab 793. The dominant pulsation frequency (f0), its harmonics, the Blazhko-frequency (fB) and 2fB (Poretti et al. 2010) were prewhitened. The HIFs are significant up to 17 / 2f0. |
CoRoT 0101128793 is a CoRoT RR Lyrae star with a low Blazhko modulation amplitude (the amplitude of the highest side peak due to the modulation is 4.6 mmag) and a Blazhko period of 18.66 d (see Fig. 4). This star shows one of the lowest modulation amplitudes detected so far (Jurcsik et al. 2006; Skarka 2014). Poretti et al. (2010) studied this object in detail. In the course of this work we find clear sign of period doubling in the frequency spectrum in the form of half-integer frequencies (see Fig. 7). Poretti et al. (2010) interpreted f2 = 3.159 d-1 and f0 + f2 = 5.279 d-1 as combination frequencies, but in our context the period-doubling interpretation seems to be more plausible, especially that it is found in all possible places from 1 / 2f0 to 17 / 2f02. In our interpretation these frequencies are located closer than 1% to 3 / 2f0 = 3.178 d-1 and 5 / 2f0 = 5.297 d-1, so we identify them as HIFs.
We note that there is another additional frequency, f1 = 3.63088 d-1, which might be the second radial overtone (Poretti et al. 2010). Its combinations with the fundamental mode frequency and its harmonics (f1 + kf0,k = 0,1,2...) are clearly visible in Fig. 7 with high amplitudes in between the main harmonics and the HIFs. As in the previous cases, temporal variability is easily seen for both the 3 / 2f0 half-integer frequency and the additional frequency f1 = 3.63088 d-1 (upper right panel of Fig. 6).
CoRoT 0100881648 is a Blazhko star exhibiting a typical asymmetric RR Lyrae light variation with a pulsation period of 0.607186 d and a Blazhko cycle of 59.77 d (Szabó et al. 2009). The modulation is sinusoidal and symmetric (Fig. 4).
The typical RRab light variation is diluted by a string of three close stellar companions to west-northwest and a fainter star to the north (Fig. 8). The flux from these stars are contained by the CoRoT aperture together with that of the star 648, and their presence is revealed by our ground-based observations that easily resolved the near-by contaminating sources. These follow-up observations allow us to make a crude estimate of the intrinsic light variation amplitude of this Blazhko star. One V image was taken in July 2008 (HJD 2 454 676.44742) with the Konkoly Observatory 1m RCC telescope which corresponds to a pulsational minimum and is slightly past the Blazhko-maximum (ψ = 0.06, where ψ denotes the Blazhko phase). Based on the fluxes of the contaminating stars (assumed to be constant) and the variable in its minimum and using the apparent total amplitude we calculate the true light variation to be 0 36 in the Blazhko maximum and 030 in the Blazhko minimum. This is still a bit lower than the amplitude of the light variation of a normal, unblended Blazhko RRab star, but to reconstruct the undiluted light variation more precisely, much longer follow-up observations would be necessary. Other fainter stars have negligible effect on our estimate.
We detect ten harmonics of the 1.64694 d-1 frequency and a triplet around f0 and 2f0. The right peaks are much higher and are detected around all the harmonics. No additional frequency is detected above the 3σ level. Also, we could not detect any signs of the period doubling phenomenon. The frequency table is available at Appendix D.
CoRoT 0101503544 is a Blazhko star with an asymmetric light variation. Its pulsation period is 0.605087 d, and a Blazhko-variation of 25.60 d is clearly seen (Fig. 4). The color light curves are preserved for this object. The star exhibits a typical skewed RRab light curve, with its amplitude diminished to 0021 in red, 0045 in green, and 0052 in blue passbands. Based on the CoRoT data this object is most probably an intrinsically high-amplitude RR Lyrae star. This conclusion is supported by the relatively high modulation (e.g., 0028 in the green light compared to the overall light variation amplitude 0045). We note that the color amplitude ratios are typical of an RR Lyrae variable. The L1 (level-1) contamination value given by the ExoDat catalog is 0.13871 ± 0.00663, which might be too low an estimate.
CCD frames taken by one of us (Benkő) with the Konkoly Observatory 1m RCC telescope and a Johnson V filter allowed us to reconstruct the true light variation of this heavily blended object. The contaminating star is brighter by 20 in V compared to the brightest phase of 544. One image was taken in June 2008 (HJD 2 454 639.49092), which corresponds to a pulsational maximum and is slightly past the Blazhko-maximum (ψ = 0.10). Using a similar process that was applied in the case of 648 (and assuming that the Johnson V filter is reasonably close to the CoRoT green passband), we calculated the true light variation to be 039 in the Blazhko maximum and 023 in the Blazhko minimum in the V passband. The frequency content of 544 can be found in Appendix E.
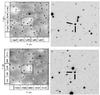 |
Fig. 8 Left: EXODAT image showing the aperture applied to 648 (upper panel) and 544 (lower panel). Right: 1′ × 1′V image of the targets taken by the 1m RCC telescope at Piszkés-tető. North is to the right and east to the bottom. The variable star is located between the thick lines. We transformed our frames to match the EXODAT images except a slight (30 degrees) rotation. 648 was caught around pulsational minimum, and 544 around pulsational maximum. |
After a few days of normal sampling (8-min), the observations were switched to the oversampling mode (32-s). Before embarking on the frequency analysis we resampled the oversampled data to normal sampling to get a more tractable number of points (23 915 vs. 351 086). We checked that no information was lost in the relevant low-frequency range, which is the main focus of this study.
High-precision space-based observations frequently show additional frequencies in RR Lyrae stars. This Blazhko star is no exception, it also has additional periodicities in the frequency spectrum. One of them is f′ = 2.389287 d-1. The lower left hand panel of Fig. 6 shows the temporal variation of the f′. Again, one can easily recognize the time-variability of the appearance of this frequency peak during the CoRoT observations.
We have not found any signatures pointing to period doubling in the frequency spectrum, whether in the white light or in the color observations, which is not surprising, given the blended nature of our target. However, a close inspection of the light curve reveals that there are sections where the alternating pulsating cycles are clearly visible (Fig. 9). We checked that the frequency spectrum does not contain any other additional frequency peaks with high enough amplitude to cause the observed variation in the maxima from cycle to cycle. Clearly, the 0.15 mmag f′ cannot cause fluctuation exceeding several mmag as seen in Fig. 9. Interestingly, CoRoT’s detection capability allowed us to reveal the temporary nature of the period doubling phenomenon in this heavily blended CoRoT Blazhko RR Lyrae star.
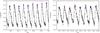 |
Fig. 9 Sections of light curve where period doubling is present in the blended Blazhko CoRoT RRab star 544. Even and odd maxima are marked with different symbols. Original data points are denoted by small black points. |
CoRoT 0105288363 is an RR Lyrae star showing a strong Blazhko modulation with a period of 35.06 d. The lower right hand panel of Fig. 4 shows that the maxima of the pulsational cycles do not move considerably in sharp contrast with 962. The amplitude of the Blazhko modulation is not constant. A detailed study was presented by Guggenberger et al. (2011). After analyzing the CoRoT light curve again, we saw no sign of period doubling either in the light curve or in the frequency spectrum down to 0.35 mmag in accordance with Guggenberger et al. (2011). There is an additional frequency in the star (f′ = 2.98400 d-1) with a frequency ratio of 0.591, which can be identified as the second radial overtone. Despite its low amplitude and the cluttered frequency spectrum, we tried to analyze its temporal variation (Fig. 6, lower right panel). Although there are hints that the amplitude of this frequency peak varies in time as well, we cannot draw firm conclusions about its temporal variability because of the difficulties mentioned. Also, there is a non-negligible chance that this periodicity comes from a different, nearby source (Guggenberger et al. 2011). According to Guggenberger et al. (2012), the star also shows a frequency around its first radial overtone (f1 = 2.3793 d-1, frequency ratio 0.741) and another one that is most probably a nonradial mode3 (fnr = 2.4422 d-1, f0/fnr = 0.722). Owing to their low amplitude we did not try to analyze their temporal behavior in this study.
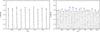 |
Fig. 10 Same as Fig. 9, but for the Blazhko CoRoT RRab star 434. The switch back and forth between the two branches in the right panel is a clear signal pointing to more complex dynamical behavior. |
CoRoT 0103922434: this is a new Blazhko RRab star (also known as V922 Oph) that will be discussed in detail in Poretti et al. (in prep.). Its period is 0.5413828 days and shows a Blazhko-modulation of roughly 54.5 days, so CoRoT LRc04 observations cover two modulation cycles.
Here we only note that even though we do not see half-integer frequencies in the frequency spectrum of this star, there are hints that the period doubling might be present temporarily. Namely, we find six to ten consecutive pulsational cycles in the light curve that are alternating (Fig. 10). One is found around CJD 3490 and lasts only for ten pulsational cycles. The other one is at the end of the CoRoT observations (starting from CJD 3548). Such regularity cannot be seen in any of the other RRab stars that do not show PD. The amplitudes of the additional frequencies are not sufficient to cause as large as many hundredths of a magnitude alternation from maximum to maximum even in the most favorable (constructive interference) case. In addition, finding alternating maxima by chance more than once has a very low probability4. We also note that in RR Lyrae and other Kepler PD-stars, the temporal nature of the period doubling is also clearly demonstrated (Szabó et al. 2010). Thus, we conclude that 434 is a Blazhko RRab star showing the period doubling temporarily. One can notice that there are switches between the different branches connecting even and odd maxima (Fig. 10). The switch between the two branches of the lower and higher maximum strings is a definite sign of more complex dynamical behavior besides the high-order resonance causing the period doubling. It points to the presence of additional resonances (see, e.g., Molnár et al. 2012) or low-dimensional chaos (Plachy et al. 2013).
Although there are indications that the second radial overtone is excited in this star with f2 = 3.165859 d-1, we examined only the strongest additional frequency f′ = 2.612196 d-1 and the result is presented in the upper right hand panel of Fig. 11. There is a clear amplitude variation (lower panel). The figure was made after prewhitening with the fundamental mode f0, its harmonics and the modulation side peaks. A large number of combination frequencies (kf0 + nfm) are present as well, suggesting that these signals come from the star itself. The frequency ratio is f0/f′ = 0.707091, thus f′ cannot be a radial mode.
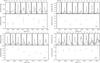 |
Fig. 11 Temporal variability of additional frequencies in RRab, RRd, and RRc stars. Upper left: lower panel: amplitude variation of the additional f′ = 2.61219586 d-1 frequency of CoRoT Blazhko RR Lyrae star 434. The fundamental mode frequency, its harmonics, and the side peaks related to the modulation (and the modulation frequency itself) were removed. Upper panels: the vicinity of f′ in the frequency spectrum, lower panels: amplitude variation. Upper right: the same for the temporal variability of f′ = 4.4786159 d-1 CoRoT RRd star 812. The first overtone frequency and its harmonics were removed. Lower left: temporal variation of the f′ = 4.37783 d-1 frequency of CoRoT RRc star 241. The first overtone frequency and its harmonics were removed. Lower right: the same as for the RRc star 241, but for 652. The amplitudes are smaller than in 241, but the variation in the structure of the f′ = 5.82484 d-1 peak is strikingly similar. |
4.3. RRc stars
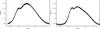 |
Fig. 12 Phased light curves of two CoRoT RRc stars. Left: 241. Right: 652. |
CoRoT 0105036241: we have found two RR Lyrae stars predominantly pulsating in the first radial overtone (RRc) by CoRoT, one of them is 241. The phased light curve can be seen in the left hand panel of Fig. 12. Besides the first overtone mode (f1 = 2.68153 d-1), this RRc star has an additional frequency f′ = 4.37783 d-1 with a frequency ratio f1/f′ = 0.613. This frequency ratio occurs surprisingly often in overtone RR Lyrae and Cepheid stars, as in Moskalik (2013). 241 represents another member of this class of classical pulsators. If – as it is conceivable – f1 belongs to the first radial overtone, then f′ cannot be a radial mode, it is most probably a nonradial one.
The Fourier spectrum and sequential prewhitening with the highest amplitude frequencies in 241 are displayed in Fig. 13. After successively removing the dominant pulsation frequency, its harmonics, and the additional f′ frequency, two sets of side peaks appear. We denote the corresponding frequency differences with fm and fb in Fig. 13 and in Appendix F. The first one (fm) may be a long-period (longer than the length of our data set) Blazhko modulation, although more data would be needed to establish its exact nature, while the second one (fb) most probably appears because a clear amplitude variability is seen in the additional frequency, f′ (see below).
After removing all the previously mentioned frequencies, there are still a lot of remaining peaks in the spectrum, the highest among them is f′′ = 2.345174 d-1 with an amplitude of 0.57 mmag. However, instead of (over)interpreting the data we prefer to stop at this level. The average of the residual frequency spectrum is 0.09 millimagnitude. A detailed discussion of the frequency spectrum can be found in Appendix F.
We computed the temporal variation of the amplitude of f′ by using eight bins. The lower left hand panel of Fig. 11 shows that the amplitude of f′ very clearly varies on long time scales. In the same figure we also plotted the close neighborhood of f′ in the frequency spectrum corresponding to the bins for which the amplitude was calculated (upper panel). It is interesting to see the structural variation of the peak. Sometimes the frequency peak is split into two separate peaks. The variation over the 145 day-interval is striking.
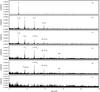 |
Fig. 13 Frequency spectrum of the star 241 with sequential prewhitening. Some characteristic frequencies are labeled with their identification. Sat refers to frequencies connected to the orbit of the CoRoT satellite. a) The original spectrum dominated by the first overtone pulsation mode (f1). b) After prewhitening with f1 and its harmonics. c) The result of removing f′ and all combination terms involving f1 and f′. d) Prewhitening with all f1 ± k ∗ fm and f′ ± k ∗ fm frequencies. e) After removing all significant f1 ± k ∗ fb and f′ ± k ∗ fb frequencies. f) Removing another 13 frequencies including those from the satellite and third order linear combinations of {f1,f′,fm,fb}. |
CoRoT 0105735652 is similar to 241 in many aspects. Its phased light curve is shown in the right hand panel of Fig. 12. However, this star has a B5 II spectrum in the CoRoT observation log Release 13 (COROT Team 2014). This and the presence of many low-amplitude frequencies (that may be nonradial modes) might imply a β Cep scenario. On the other hand, the light curve shape resembles that of an RRc star with the characteristic bump just before maximum light, though some β Cep variables show a similar feature (Sterken et al. 1987). The CoRoT classification algorithm (Debosscher et al. 2009) assigns a probability of more than 80% for an RRc variable, while giving less than a 10% chance for the β Cep variation. In addition, the frequency ratio f1/f′= 0.615 is seen frequently in recent space-based photometric observations (e.g., Moskalik 2013), which makes it likely that the star is a first-overtone RR Lyrae star, so we stick to this scenario.
The temporal variation of the amplitude of the f′ frequency is plotted in lower right hand panel of Fig. 11. The f′ frequency shows similar structural variations as its sibling, the other CoRoT RRc star, 241, that we discussed above. Although this star does not show as large an amplitude variation as 241, the change in the structure of this secondary frequency is obvious. While the time scale of the variation is similar, the variations in the two stars are not identical, and other frequencies do not show the same effect, so we conclude that they cannot come from instrumental effects. We also checked the well-behaved spectral window to see whether the first side lobe is able to cause any trouble in combination with f′, but this possibility can be safely excluded. The frequency table of the star is shown in Appendix G.
4.4. CoRoT RRd star
CoRoT 0101368812: while the original Kepler field does not contain any classical double-mode RR Lyrae stars, this RRd star has been found in CoRoT’s LRc01 run and analyzed by Chadid (2012). The period of the fundamental mode is 0.4880408 d, while that of the first overtone is 0.3636016 d. The period ratio is 0.7450 and the amplitude ratio A1/A0 2.7055, with the first overtone the dominant mode. We note in passing that RR Lyrae, the eponym of its class, is an example of a modulated RR Lyrae pulsating in the fundamental mode and exhibiting the first overtone mode in addition (Molnár et al. 2012), with an exceedingly tiny amplitude (non-classical double-mode RR Lyrae).
It is of interest to investigate whether classical double-mode RR Lyrae show the period doubling, because of the lack of RRds in the original Kepler field. Based on the CoRoT data, we see no half-integer frequencies in the Fourier-spectrum of 812 down to 0.07 mmag. We mention here that MOST observations of AQ Leo, another classical RRd star, do not show any PD frequencies, either (Gruberbauer et al. 2007).
We examined the additional frequency f′ = 4.4786159 d-1 (Chadid 2012) (f2 in the original paper) and the result is presented in the upper right hand panel of Fig. 11. The figure was made after prewhitening with the fundamental mode f0 (and its harmonics), the first overtone f1 (along with all harmonics), and all the visible linear combinations of these. The f′ periodicity shows a clear amplitude variation. We tested that the same variation is present in the original (unprewhitened) spectrum as well, so the effect is not caused by the prewhitening process. We also checked that the observed change is not caused by any variation in the f0 or f1 themselves or by an interaction with the spectral window sidelobes.
4.5. Brief summary of the results
After discussing individual objects it is worth summarizing the most important results. We discovered signs of period doubling in four CoRoT RR Lyrae stars by reanalyzing their light curves. These are 962, 793, 544, and 434. Although these stars were known before, the presence of period doubling has not been recognized. These objects are all Blazhko RRab stars showing either characteristic alternating maxima (or pulsating cycles) in the time domain, half-integer frequencies between the dominant pulsation mode and its harmonics (Szabó et al. 2010), or both (see Table 4 for a summary).
In Table 4 we list additional frequencies reported here for the first time, as well as a few previously found ones. These frequencies can be interpreted as
-
the second radial overtone in Blazhko RRab stars (or at leastfrequencies around its expected location with a frequency ratio≈0.58) in case of 962, 793, and 434. Here we investigated only theone belonging to 793 in detail;
-
the well-known frequency with a frequency ratio of 0.61 mostprobably corresponding to a nonradial mode in RRc and RRdstars: 241, 652, 812 (we use the notation fX throughout this work);and
-
other nonradial modes in 962, 544 and 434.
We emphasize that the list in Table 4 is by no means exhaustive or complete, since we do not investigate and discuss all the significant additional frequencies here, only the most prominent ones. Interestingly, based on this work and Nemec et al. (2011), non-Blazhko RRab stars do not show additional periodicities down to the exquisitely low-amplitude limits provided of CoRoT and Kepler.
Another interesting conclusion of this work is that in many cases the amplitudes of additional frequencies vary over time on shorter time scales than the typical length of the CoRoT runs, irrespective of their nature (HIF, second radial overtone, or hypothesized nonradial modes). We found clear temporal variability of the amplitudes of a frequency peak close to the second radial overtone of 793, the probable nonradial modes with a frequency ratio of 0.61 in 241 (RRc) and 812 (RRd), and other possibly nonradial modes in 544 and 434. Variability is also obvious in the structure of the frequency peak f′ = 5.82484 d-1 in 652 (another RRc, f′/f = 0.615). Only marginal evidence is found for temporal variability of the amplitudes of a possibly nonradial mode and the second radial overtone in the Blazhko-modulated RRab stars 962 and 363, respectively.
5. Discussion and conclusions
5.1. Period doubling
Summary of the main results: period doubling search and additional frequencies that were investigated in detail along with their most probable identification.
We confirm earlier results (Szabó et al. 2010) that period doubling occurs only in Blazhko-modulated RR Lyrae stars, and none of the non-modulated RRab stars shows this phenomenon. In this work we added four non-modulated RRab stars to the list of RR Lyrae not showing PD with CoRoT’s precision.
Although the amplitude of the HIFs is empirically expected to be highest in the [f0;2f0] frequency interval, we nevertheless checked the whole frequency spectrum of each object when searching for the PD. Indeed, the HIFs are significant up to 11 / 2f0 in case of 962 and 17 / 2f0 in 793. In two cases (544 and 434), only the alternating maxima betray the presence of PD. In 434 the reason may be twofold: the PD is rather weak and it is only present for a very brief time period. The star 544 is heavily blended, and we had not expected to see anything in the frequency spectrum beyond a few harmonics of the fundamental mode and some modulation side peaks. On the contrary, with CoRoT data we were able to uncover PD in this blended Blazhko RR Lyrae star (its total amplitude is only about  ), nicely demonstrating the capabilities of high duty-cycle, extreme-precision space photometry. We checked the frequency spectrum of 544 and 434 to see whether any single additional frequency or a combination of them can cause this conspicuous alternation of consecutive maxima. It turned out that the amplitudes of these frequencies are much lower than what would be required to cause the observed effect, so we conclude that the hypothesis of the presence of PD is plausible in these cases.
As seen in the Kepler RR Lyrae sample, the strength of period doubling is changing with time in the CoRoT PD stars as well, and in most cases it crops up only temporarily for a few pulsational cycles. For estimating of the occurrence rate of the period-doubling effect in Blazhko and possible non-Blazhko stars, it is very important to monitor RR Lyrae stars with high-precision photometry (preferably from space) for a long time (several Blazhko-modulation periods, meaning several months or years), and uninterrupted because of the time variability of the phenomenon. CoRoT and Kepler data sets are ideal for this purpose, because both missions delivered many month- and year-long, high-precision, uninterrupted observations, respectively. The four stars with PD out of six modulated RRab targets is entirely consistent with the results of Benkő et al. (2014) who found PD in nine out of 15 Blazhko-modulated Kepler stars. This can be augmented to 10/16, if RR Lyrae, the prototype, is accounted for (Szabó et al. 2010). This means that roughly two Blazhko-modulated RRab stars out of three show the period-doubling phenomenon. One is tempted to speculate that because of the finite length of space data (60−150 days in case of CoRoT, 4 years for Kepler) and the temporary presence of PD, it is possible that the occurrence rate is higher. To take this argument to the extreme, it is possible that all Blazhko-modulated stars would show period doubling if long enough time series data were taken.
The connection between the Blazhko modulation and the period doubling is obvious. The high occurrence rate of PD in Blazhko-modulated stars stresses the possible underlying physical connection of the two dynamical phenomena. Indeed, the 9:2 resonance between the fundamental mode and the 9th overtone which explains the period doubling (Szabó et al. 2010; Kolláth et al. 2011), might be the culprit for causing the Blazhko modulation itself, as well (Buchler & Kolláth 2011). Given that the resonance paradigm is partly based on hydrodynamic models and partly on the successful and simple amplitude equation formalism, in our opinion this is currently the most plausible explanation for the century-old Blazhko enigma. It is backed up by the results of this paper.
Interestingly, alternating cycles are found in other pulsating star types, such as RV Tauri where the alternating deep and shallow minima are characteristic, and also in BL Her stars (Smolec et al. 2012). Surprisingly, white dwarfs may show alternating cycles, as well (Paparó et al. 2013). Although in some cases this may be a result of an interaction of several independent modes in the frequency spectrum, at least in one case a period-doubling bifurcation event seems to be well-documented (Goupil et al. 1988), showing close resemblance of RR Lyrae star pulsational dynamics (Kolláth et al. 2011).
5.2. Time-dependent additional frequencies
With the thorough analysis of CoRoT RR Lyrae data, we confirm earlier emerging trends that additional periodicities are ubiquitous in RR Lyrae stars. RRd stars were the first type of object where frequencies not fitting in the radial eigenspectrum were found (Gruberbauer et al. 2007), but soon − with the advent of regular space photometric observations − Blazhko-modulated RRab (Chadid et al. 2010; Guggenberger et al. 2012) and RRc stars (Moskalik 2013, 2014) followed. It is especially interesting that most of the RRc stars that were observed from space show periodicities with a frequency ratio of f1/f′ ≈ 0.61 with the first radial overtone mode (Moskalik 2014). These additional frequencies seem to be present in all stars in our sample showing normal amplitude first-overtone pulsation, i.e. RRc and RRd stars (see Table 4, where we identified them with fX). The most plausible explanation for their origin is nonradial modes (Dziembowski 2012). Interestingly, modulated RRab stars also show various, low-amplitude additional periodicities (Benkő et al. 2010; Chadid et al. 2010; Molnár et al. 2012; Guggenberger et al. 2012).
In this work we attempted to unveil the temporal behavior of the ubiquitously seen additional, low-amplitude frequencies that are usually attributed to nonradial oscillations by the virtue of the extended coverage and high duty cycle provided by CoRoT. We found that in almost all cases, where the brightness of the star, the data coverage, and the crowdedness of the frequency spectrum allowed a detailed analysis, these frequencies showed amplitude variation over time, followed by a variation in the shape of the frequency peak. The structure of the peaks already suggests temporal variability of the amplitude and/or frequencies, since amplitude and/or frequency modulation manifests itself as side peaks around the corresponding frequency peaks (Benkő et al. 2011). This is exactly what we see around the HIFs in many cases (Szabó et al. 2010, see also Fig. 5 in this work). This same variation maybe occur in other additional frequencies, as well. It is possible that the amplitude and the structure of these additional frequency peaks vary because there are close, unresolved frequencies around them. We consider this possibility unlikely based on our experiences with the Kepler RR Lyrae data that have better frequency resolution.
Finding a physical explanation for ubiquitous time variability of the additional frequencies, which at the same time does not affect the dominant pulsational mode, is challenging. We are tempted to think that the additional frequencies might be nonradial modes. (i) Maybe these modes are not self-excited and are only present when they experience resonances. That would explain nonstationarity, if resonance conditions governed by the stellar structure are not always met. This might be the case in Blazhko-modulated stars, where the period and stellar structure also vary (quasi)periodically (Jurcsik et al. 2009b; Sódor et al. 2009; Szabó et al. 2010; Kolláth et al. 2011). The typical time scale of the variation we found is several tens of days, although the variation may be seriously undersampled because of the attainable frequency resolution. This might be compared to typical theoretical mode growth rates or the time scale of interactions, as we see in stars showing period doubling (Kolláth et al. 2011). The variation is most probably a consequence of the interaction with the large-scale, long-term modulation, which may be a plausible explanation for the observed phenomena. However, this explanation is challenged by the fact that the amplitude, hence non-linearity in RRc stars is much lower than in RRab stars, still the same variation also occurs in these stars. (ii) If not only one, but several closely spaced nonradial modes are excited (Van Hoolst et al. 1998), they can interact causing a complex behavior in the frequency space. In this case not only the time scale of the excitation, but also that of the nonlinear interaction becomes relevant. While the found variations are quite diverse, the magnitude and the time scale of the newly found variations of the additional frequencies suggest a common origin. (iii) Rotational splitting is less likely, since we would not expect temporal variation unless an other mechanism is at work. Invoking some other modes might come to the rescue if further nonlinear interactions are assumed, hence creating a complex, unresolvable (even with continuous CoRoT observations) pattern in the frequency domain. Detailed investigation of these mechanisms is beyond the scope of this paper, but we may conclude that the discovery of these variations leads us to an unexplored territory of fine details of RR Lyrae pulsation.
5.3. Interpretation of the frequency spectra of Blazhko RRab stars
In Chadid et al. (2010) and Poretti et al. (2010), the frequency spectrum of the Blazhko-modulated 962 and 793 were interpreted as the result of the presence of independent, additional frequencies (presumably nonradial modes) and their combinations besides the well-known pulsational frequency, harmonics, modulation multiplets, the modulation frequency itself, and its harmonics. Here, we offer a simpler explanation, since the presence of half-integer frequencies, as a result of the period doubling, removes one independent frequency, together with all the related combination terms.
In many Blazhko RR Lyrae stars, peaks appear around the expected frequencies of the second (and first) radial overtone (Benkő et al. 2010). This is the case for 962 and 793, as well. Here we identify the frequencies with a frequency ratio of 0.58 with the radial second overtone, while keeping in mind that the excitation of nonradial modes in the vicinity of radial overtones is also predicted and plausible (Dziembowski 1977; Van Hoolst et al. 1998).
Other significant frequencies were found by previous studies and this work (see in Table 4. denoted by “nr”) which do not fit the above described picture. Their frequency ratio (f0/f′) is about 0.7. As we mentioned it in Benkő & Szabó (2014), these frequencies can also be interpreted as linear combination: 2(f2 − f0). Indeed, the components and the simplest combination (f0, f2, and f2 − f0) of these frequencies are detectable for all Blazhko RR Lyrae stars except for the heavily blended 544 and 648.
The linear combination assumption simplifies the mathematical description, but is it a plausible physical explanation? Do these frequencies belong to radial modes? Not necessarily, since the amplitudes seem to contradict this scenario. For example, the amplitudes of f2 − f0 and f2 in 962 are about three times smaller than the amplitude of 2(f2 − f0). Such behavior is highly unlikely for simple linear combinations. It is possible, however, that f2 and f0 excite a nonradial mode (fnr) through a three-mode resonance fnr ≈ 2(f2 − f0), in which case the amplitude of the excited mode is higher. A similar effect has been detected for δ Scuti stars, B, A, F stars, and a peculiar roAp star (Balona et al. 2013; Breger 2014; Breger & Montgomery 2014). All of these papers suggest the presence of coupled nonradial modes showing quasi-periodic amplitude and frequency variations similar to our presented results. Further developments of multi-dimension hydrocodes, such as Geroux & Deupree (2011) and Mundprecht et al. (2013), will eventually make it possible to test this scenario.
6. Summary
The main results of this work can be summarized as follows.
-
The most comprehensive collection to date of CoRoT RR Lyrae variables was presented, including new discoveries. The sample consists of all RR Lyrae subtypes: Blazhko and unmodulated RRab stars, two RRc, and one RRd star. We publish epochs, periods, frequency tables, and phased light curves for those object that have not been analyzed earlier.
-
Thanks to the CoRoT high cadence observations, we could detect 56 harmonics of the pulsation frequency corresponding the fundamental mode in the case of non-modulated 818 RRab star. To our knowledge this is the highest number of observed Fourier terms describing an RR Lyrae light curve, hence the most precise one that will serve as a benchmark for model computations.
-
Period doubling is detected in CoRoT Blazhko RRab stars for the first time. We discovered brief sections of alternating maxima typical of PD effect in four CoRoT RR Lyrae stars. It means that two out of three modulated RR Lyrae show this dynamical phenomenon, at least temporarily, in accordance with the Kepler RR Lyrae statistics. Given the usually short time intervals where PD is detectable, the percentage can be even higher. The strong correlation of the PD occurrence with the Blazhko phenomenon and the fact that no PD was detected in unmodulated CoRoT and Kepler RR Lyrae suggests a causal relation, such as the “resonance paradigm” proposed by Buchler & Kolláth (2011). In some cases the presence of PD offers a simpler explanation of the frequency spectrum of Blazhko-modulated RR Lyrae.
-
Our work corroborates those recently found trends toward additional frequencies (most probably higher radial overtones and nonradial modes) being ubiquitous in all subtypes of RR Lyrae stars (RRc, RRd, Blazhko RRab), except the unmodulated RRab pulsators. This is an extremely strict rule, since none of the non-Blazhko RRab stars observed by Kepler and CoRoT shows any additional frequency peaks beyond the dominant pulsational mode and its harmonics, while all the other types − except some blended objects – do show this feature with high-precision space-based photometric observations. If the additional frequencies proved to be nonradial modes, then we anticipate that asteroseismology of RR Lyrae stars should be feasible in the near future.
-
We analyzed the temporal variability of additional frequencies for the first time in all subtypes of RR Lyrae stars based on the CoRoT sample. The amplitude or the shape of these frequencies vary in time in most cases where we could draw firm conclusions. This variability can be connected to the Blazhko cycle in modulated stars, much like the half-integer frequencies signaling the period doubling are strongly variable. A physical explanation in this case may be the changes in the stellar structure during the Blazhko cycle and the consequent close or near-miss encounters with different resonances between radial and/or nonradial modes. That would explain the temporal excitation of nonradial modes (Kolláth et al. 2011). In unmodulated stars, such as RRd and RRc stars, however, a different mechanism should be at work, and it is not clear at this point whether a common mechanism can explain the temporal variability of additional frequencies in all RR Lyrae subtypes. Through investigations similar to this work, we may get closer to understanding the excitation mechanism and origin of these periodicities.
Online material
Appendix A: Frequency content of the new CoRoT RR Lyrae star: 0101315488
Frequency table of the newly discovered CoRoT RRab star, 488.
Table A.1 contains the frequencies that we found during the frequency analysis. The star pulsates with a period of 0.485299 days. The following epoch for maxima was found:  (A.1)Digits in parentheses denote the uncertainties. Nine harmonics can be found in the frequency spectrum. No additional frequencies were found.
Appendix B: Frequency table of the new CoRoT RRab star: 0103800818
Frequency table of the unmodulated CoRoT RRab star, 818.
Table B.1 enumerates the frequencies of the unmodulated RR Lyrae, 818. The period of this star is 0.4659348 days. No modulation was found in this RRab star. We found the following epoch for maxima:  (B.1)After prewhitening, “forests” of peaks remain around the harmonics. These do not show any obvious modulation pattern, so we decided not to list them in Table B.1.
Appendix C: Frequency table of the new CoRoT RR Lyrae star: 0104315f804
In Table C.1 we give the frequency content of 804. The star pulsates with a period of 0.7218221 days. No signs of modulation or additional frequencies were found in this object. The following epoch for maxima was obtained:  (C.1)
(C.1)
Frequency table of the non-modulated CoRoT RRab star, 804.
Appendix D: Frequencies of 0100881648
In Table. D.1 we present the result of the Fourier analysis of the blended CoRoT Blazhko RRab star, 648. The following epoch for maxima was found:  (D.1)
(D.1)
Frequency table of the blended Blazhko RRab star, 648.
This is a heavily blended Blazhko RRab star. The spectrum shows the frequency corresponding to the fundamental mode pulsation (f0) and nine harmonics. In addition, the right components of the modulation triplets are seen prominently around the harmonics after prewhitening. In a few cases, the left hand side peaks are also detected. The remaining spectrum consists of the known orbital frequencies of CoRoT, their linear combinations with the sideral day, many peaks due to low-frequency variations in the frequency interval 0.1−0.7 d-1, and some residuals around the main frequency and around the low-order harmonics. The residual peaks are at the level of 73 μmag. The amplitude and frequency variation of the star due to the Blazhko-modulation was already presented in Szabó et al. (2009).
Appendix E: Frequencies of the blended Blazhko RRab star 0101370544
Table E.1 lists the result of the Fourier analysis of the second blended CoRoT Blazhko RRab star, 544. This object was observed in the color mode of CoRoT, but we chose to present the co-added (white) light frequencies, because this data set is superior to the individual color observations. The following epoch for maxima was found:  (E.1)
(E.1)
Frequency table of the white band light curve of the blended Blazhko RRab star, 544.
Despite the heavy blending, the spectrum shows the frequency corresponding to the fundamental mode pulsation (f0), and ten harmonics. In addition, the triplet components of the modulation found around f0 are revealed around most of the harmonics after pre-whitening. The right side-lobes (k ∗ f0 + fm) are present with higher amplitudes than their left hand counterparts. The remaining spectrum consists of the known orbital frequencies of CoRoT, and their linear combinations with the sideral day, many peaks due to low-frequency variations in the frequency interval 0.2−0.8 d-1, some residuals around the main frequency and low-order harmonics, and a few remaining peaks close to or below the significance level between f0 and 2f0. The residual peaks are at the level of 28 μmag. The amplitude and frequency variation due to the Blazhko-modulation was presented in Szabó et al. (2009).
Appendix F: Frequencies of the CoRoT RRc star 0105036241
Frequency table of the CoRoT RRc star, 241.
Besides the dominant first overtone frequency (f1 = 2.68153 d-1) and its harmonics, we see f′ in the spectrum with a characteristic 0.613 frequency ratio with the first-overtone
radial pulsation (Table F.1). In addition, several frequencies were found in the [0.5; 1.5] d-1 frequency range. Upon inspecting the data, we found that their origin can be traced back to two remaining discontinuities, therefore these portions of the data set CJD [3046.0−3048.0] and [3156.5−3157.5] were removed. In the following we analyze the remaining data set.
We found high left-hand side peaks around the main frequency and its harmonics. If we suppose that fm = 0.00585 d-1 is a modulation frequency, the period of the modulation would be longer than the data set. According to that this star may show a long-period Blazhko-modulation, but more data would be needed to confirm this finding. Another set of modulation-like frequency difference appears in the data set (Fig. 13, Table F.1). We denote the corresponding frequency fb. Neither fm, nor fb can be found in the frequency spectrum, but they only appear through combination frequencies. Even combination frequencies involving both fm and fb can be identified. We note here that as we demonstrated in Sect. 4.3, f′ has temporal amplitude variation, and this is the most probable culprit causing the appearance of the fb modulation frequencies. The strongest argument favoring this scenario is that fb appears only close to and in combination with f′, and is not seen around the main pulsation frequency, f1. In addition, frequencies associated with the orbital period of the satellite and its daily aliases are seen at f = 13.967924,14.974027,12.969585 d-1 as usual in CoRoT data. We omitted these peaks from Table F.1. The following epoch for maxima was found:  (F.1)or taking a gradual period change into account:
  (F.2)
(F.2)
Appendix G: Frequencies of the CoRoT RRc star 0105735652
We detect the main frequency f1 = 3.58218 d-1 and its harmonics, but also many other frequencies with lower amplitude. Among them we found a highly significant frequency at f′ = 5.82484 d-1 with several peaks around it, then additional peaks around f1. The frequencies are available in Table G.1. The following epoch for maxima and period were found:  (G.1)After prewhitening with the frequencies enumerated in Table G.1, a dense forest of frequencies remains around f1. We also see similar residual power around the second and third harmonics, frequencies around 5.9,9.4,16.5,20.1 d-1, and frequencies related to the orbital frequency of CoRoT.
The large number of side frequencies seen around frequencies f′ and 9.470874 d-1 may be the result of their non-stationary nature (modulation). We gave an example in Szabó et al. (2010) where the frequency forest found around the the half-integer frequencies was modeled and explained by the varying amplitude of these frequencies. We see a very similar situation here.
Frequency table of the CoRoT RRc star, 652.
IRAF is distributed by the National Optical Astronomy Observatory, which is operated by the Association of Universities for Research in Astronomy (AURA) under cooperative agreement with the National Science Foundation.
We make an exception here and retain the original designation of f1 and f2 from Poretti et al. (2010).
Denoted by fN in the original paper.
To be more specific: in a very simplistic approach, the probability of n jump (up or down) is 1 / (2n − 1), since the random variable X of the height of the pulsational maximum follows a binomial distribution assuming an equal probability (p = 1 / 2) of an up or down jump. Thus, the chance configuration of n = 8 switches in the left panel of Fig. 10 is 1 / 127 ≈ 0.0079.
Acknowledgments
This research made use of the ExoDat database, operated at LAM-OAMP, Marseille, France, on behalf of the CoRoT/Exoplanet program. R.S.z., M.P., and J.M.B. acknowledge the support of the ESA PECS project No. 4000103541/11/NL/KML. This project has been supported by the Hungarian OTKA grant K83790 and the European Community’s Seventh Framework Program (FP7/2007−2013) under grant agreements No. 312844 (SPACEINN), No. 269194 (IRSES/ASK) and ERC grant agreement No. 338251 (StellarAges). R.S.z. wishes to acknowledge the support from the János Bolyai Research Scholarship of the Hungarian Academy of Sciences. W.W. was supported by the Austrian Science Fonds (FWF P22691-N16). The authors thank Ákos Győrffy, Péter Pápics, and László Molnár for their help with the ground-based observations.
References
- Affer, L., Micela, G., Favata, F., & Flaccomio, E. 2012, MNRAS, 424, 11 [NASA ADS] [CrossRef] [Google Scholar]
- Baglin, A., Auvergne, M., Boisnard, L., et al. 2006, in 36th COSPAR Scientific Assembly, COSPAR Meeting, 36, 3749 [NASA ADS] [Google Scholar]
- Balona, L. A., Catanzaro, G., Crause, L., et al. 2013, MNRAS, 432, 2808 [NASA ADS] [CrossRef] [Google Scholar]
- Benkő, J. M., & Szabó, R. 2014, in IAU Symp. 301, eds. J. A. Guzik, W. J. Chaplin, G. Handler, & A. Pigulski, 383 [Google Scholar]
- Benkő, J. M., Kolenberg, K., Szabó, R., et al. 2010, MNRAS, 409, 1585 [NASA ADS] [CrossRef] [Google Scholar]
- Benkő, J. M., Szabó, R., & Paparó, M. 2011, MNRAS, 417, 974 [NASA ADS] [CrossRef] [Google Scholar]
- Benkő, J. M., Plachy, E., Szabó, R., Molnár, L., & Kolláth, Z. 2014, ApJS, 213, 31 [NASA ADS] [CrossRef] [Google Scholar]
- Borucki, W. J., Koch, D., Basri, G., et al. 2010, Science, 327, 977 [NASA ADS] [CrossRef] [PubMed] [Google Scholar]
- Breger, M. 2014, in IAU Symp. 301, eds. J. A. Guzik, W. J. Chaplin, G. Handler, & A. Pigulski, 93 [Google Scholar]
- Breger, M., & Montgomery, M. H. 2014, ApJ, 783, 89 [NASA ADS] [CrossRef] [Google Scholar]
- Buchler, J. R., & Kolláth, Z. 2011, ApJ, 731, 24 [NASA ADS] [CrossRef] [Google Scholar]
- Chadid, M. 2012, A&A, 540, A68 [NASA ADS] [CrossRef] [EDP Sciences] [Google Scholar]
- Chadid, M., Benkő, J. M., Szabó, R., et al. 2010, A&A, 510, A39 [NASA ADS] [CrossRef] [EDP Sciences] [Google Scholar]
- Chadid, M., Perini, C., Bono, G., et al. 2011, A&A, 527, A146 [NASA ADS] [CrossRef] [EDP Sciences] [Google Scholar]
- Chevalier, C., & Ilovaisky, S. A. 1991, A&AS, 90, 225 [NASA ADS] [Google Scholar]
- COROT Team 2014, VizieR Online Data Catalog: II/28 [Google Scholar]
- Debosscher, J., Sarro, L. M., López, M., et al. 2009, A&A, 506, 519 [NASA ADS] [CrossRef] [EDP Sciences] [Google Scholar]
- Dziembowski, W. 1977, Acta Astron., 27, 95 [NASA ADS] [Google Scholar]
- Dziembowski, W. A. 2012, Acta Astron., 62, 323 [NASA ADS] [Google Scholar]
- Dziembowski, W. A., & Mizerski, T. 2004, Acta Astron., 54, 363 [NASA ADS] [CrossRef] [Google Scholar]
- Geroux, C. M., & Deupree, R. G. 2011, ApJ, 731, 18 [NASA ADS] [CrossRef] [Google Scholar]
- Goupil, M. J., Auvergne, M., & Baglin, A. 1988, A&A, 196, L13 [Google Scholar]
- Gruberbauer, M., Kolenberg, K., Rowe, J. F., et al. 2007, MNRAS, 379, 1498 [NASA ADS] [CrossRef] [Google Scholar]
- Guggenberger, E., Kolenberg, K., Chapellier, E., et al. 2011, MNRAS, 415, 1577 [NASA ADS] [CrossRef] [Google Scholar]
- Guggenberger, E., Kolenberg, K., Nemec, J. M., et al. 2012, MNRAS, 424, 649 [NASA ADS] [CrossRef] [Google Scholar]
- Howell, S. B., Sobeck, C., Haas, M., et al. 2014, PASP, 126, 398 [NASA ADS] [CrossRef] [Google Scholar]
- Jurcsik, J., Szeidl, B., Sódor, Á., et al. 2006, AJ, 132, 61 [NASA ADS] [CrossRef] [Google Scholar]
- Jurcsik, J., Sódor, Á., Hurta, Z., et al. 2008, MNRAS, 391, 164 [NASA ADS] [CrossRef] [Google Scholar]
- Jurcsik, J., Sódor, Á., Szeidl, B., et al. 2009a, MNRAS, 400, 1006 [NASA ADS] [CrossRef] [Google Scholar]
- Jurcsik, J., Sódor, Á., Szeidl, B., et al. 2009b, MNRAS, 393, 1553 [NASA ADS] [CrossRef] [Google Scholar]
- Kolenberg, K., Szabó, R., Kurtz, D. W., et al. 2010, ApJ, 713, L198 [NASA ADS] [CrossRef] [Google Scholar]
- Kolláth, Z. 1990, Konkoly Observatory Occasional Technical Notes, 1, 1 [Google Scholar]
- Kolláth, Z., Molnár, L., & Szabó, R. 2011, MNRAS, 414, 1111 [NASA ADS] [CrossRef] [Google Scholar]
- LeBorgne, J. F., Poretti, E., Klotz, A., et al. 2014, MNRAS, 441, 1435 [NASA ADS] [CrossRef] [Google Scholar]
- Lenz, P., & Breger, M. 2005, Comm. Asteroseismol., 146, 53 [Google Scholar]
- Molnár, L., Kolláth, Z., Szabó, R., et al. 2012, ApJ, 757, L13 [Google Scholar]
- Moskalik, P. 2013, in Stellar Pulsations: Impact of New Instrumentation and New Insights, eds. J. C. Suárez, R. Garrido, L. A. Balona, & J. Christensen-Dalsgaard, Astrophys. Space Sci. Proc., 31, 103 [Google Scholar]
- Moskalik, P. 2014, in IAU Symp. 301, eds. J. A. Guzik, W. J. Chaplin, G. Handler, & A. Pigulski, 249 [Google Scholar]
- Mundprecht, E., Muthsam, H. J., & Kupka, F. 2013, MNRAS, 435, 3191 [NASA ADS] [CrossRef] [Google Scholar]
- Nemec, J. M., Smolec, R., Benkő, J. M., et al. 2011, MNRAS, 417, 1022 [NASA ADS] [CrossRef] [Google Scholar]
- Paparó, M., Szabó, R., Benkő, J. M., et al. 2009, in AIP Conf. Ser. 1170, eds. J. A. Guzik, & P. A. Bradley, 240 [Google Scholar]
- Paparó, M., Chadid, M., Chapellier, E., et al. 2011, A&A, 531, A135 [NASA ADS] [CrossRef] [EDP Sciences] [Google Scholar]
- Paparó, M., Bognár, Z., Plachy, E., Molnár, L., & Bradley, P. A. 2013, MNRAS, 432, 598 [NASA ADS] [CrossRef] [Google Scholar]
- Plachy, E., Kolláth, Z., & Molnár, L. 2013, MNRAS, 433, 3590 [NASA ADS] [CrossRef] [Google Scholar]
- Poretti, E., Paparó, M., Deleuil, M., et al. 2010, A&A, 520, A108 [NASA ADS] [CrossRef] [EDP Sciences] [Google Scholar]
- Rauer, H., Catala, C., Aerts, C., et al. 2013, Exp. Astron. submitted [arXiv:1310.0696] [Google Scholar]
- Ricker, G. R., Winn, J. N., Vanderspek, R., et al. 2014 [arXiv:1406.0151] [Google Scholar]
- Skarka, M. 2014, A&A, 562, A90 [NASA ADS] [CrossRef] [EDP Sciences] [Google Scholar]
- Smolec, R., Soszyński, I., Moskalik, P., et al. 2012, MNRAS, 419, 2407 [NASA ADS] [CrossRef] [Google Scholar]
- Sódor, Á., Jurcsik, J., & Szeidl, B. 2009, MNRAS, 394, 261 [NASA ADS] [CrossRef] [Google Scholar]
- Sterken, C., Young, A., & Furenlid, I. 1987, A&A, 177, 150 [NASA ADS] [Google Scholar]
- Szabó, R., Paparó, M., Benkő, J. M., et al. 2009, in AIP Conf. Ser. 1170, eds. J. A. Guzik & P. A. Bradley, 291 [Google Scholar]
- Szabó, R., Kolláth, Z., Molnár, L., et al. 2010, MNRAS, 409, 1244 [NASA ADS] [CrossRef] [Google Scholar]
- Van Hoolst, T., Dziembowski, W. A., & Kawaler, S. D. 1998, MNRAS, 297, 536 [NASA ADS] [CrossRef] [Google Scholar]
- Walker, G., Matthews, J., Kuschnig, R., et al. 2003, PASP, 115, 1023 [NASA ADS] [CrossRef] [Google Scholar]
All Tables
Observations of the CoRoT LRc01 RR Lyrae stars at the Konkoly Observatory that were used in this paper.
Ground-based, multi-color observations of CoRoT RR Lyrae stars taken with the 1m RCC telescope of the Piszkés-tető Mountain Station of the Konkoly Observatory.
Summary of the main results: period doubling search and additional frequencies that were investigated in detail along with their most probable identification.
Frequency table of the white band light curve of the blended Blazhko RRab star, 544.
All Figures
|
Fig. 1 Test results for detection of the temporal variation of low-amplitude frequencies. Left panel: the amplitude of the constant, 3 mmag amplitude frequency injected at ftest = 3.0 d-1 into the light curve of 241, a CoRoT RRc star (see Sect. 4.3). Right panel: a more complex case: we added a constant (3 mmag) amplitude frequency to the light curve of the strongly modulated Blazhko RR Lyrae, 962. We chose ftest = 3.4 d-1. Horizontal lines show the amplitude of the injected signal, points with error bars come from our method. The upper row shows the shape and the vicinity of the recovered frequency in the applied eight bins. |
| In the text | |
|
Fig. 2 Jump- and trend-filtered, phased light curves of CoRoT non-Blazhko RRab stars. Left panel: the newly found RR Lyrae, 488. The small amplitude and the relatively large scatter indicate a blended CoRoT target. Middle panel: the new, unmodulated RR Lyrae, 818. Having over 177 000 data points, we plot only every 10th data point for visualization purposes. Right panel: light curve of the new, unmodulated RR Lyrae, 804. |
| In the text | |
|
Fig. 3 Left: 2.6′ × 2.6′ DSS image showing the neighborhood of 488. Right: a larger surroundings of the star 488 showing the applied aperture as well. Several faint stars are shown within the aperture. North is up and east to the left in both images. |
| In the text | |
|
Fig. 4 Phase-folded CoRoT Blazhko light curves. Left: folded by the Blazhko-period, right: folded by the pulsational period. Representative averaged light curves are shown in two extreme modulation phases in each case in the right panels. |
| In the text | |
|
Fig. 5 Left panel: low-frequency part of the Fourier spectrum of 962. The dominant pulsation frequency (f0), its harmonics and the modulation triplets were pre-whitened. Black lines show the location of f0 and its harmonics, while the blue dash-dotted lines show the location of the half-integer frequencies. To visualize the distribution of the amplitudes of the HIFs we plotted black points on top of the frequencies stemming from the PD effect. The HIFs are significant up to 11 / 2f0. Right panel: small part of the CoRoT light curve of 962 clearly showing alternating maxima, i.e. period doubling. Fitted maxima are plotted to guide the eye. |
| In the text | |
|
Fig. 6 Temporal variation of the amplitude of additional frequencies in CoRoT Blazhko RR Lyrae stars. The CoRoT photometric light curves were split into eight chunks, the dominant pulsational frequency, its harmonics and the modulation side peaks were prewhitened. The Fourier spectrum in the vicinity of the additional frequencies (denoted by small vertical lines) are shown in the upper parts of the subfigures. Upper left: temporal variation of the half-integer frequency at 3 / 2f0 = 4.1916 d-1 and the independent frequency f′ = 4.03265 d-1 in the Blazhko RR Lyrae 962. Upper right: the same for the CoRoT Blazhko RR Lyrae star 793. The frequencies are 3 / 2f0 = 3.159 d-1 and f1 = 3.63088 d-1. Lower left: the variation of f′ = 2.389287 d-1 additional frequency in the blended CoRoT Blazhko RR Lyrae star 544. Lower right: the same for the Blazhko star 363, where f′ = 2.98400 d-1. |
| In the text | |
|
Fig. 7 Same as the left panel of Fig. 6, but for CoRoT Blazhko RRab 793. The dominant pulsation frequency (f0), its harmonics, the Blazhko-frequency (fB) and 2fB (Poretti et al. 2010) were prewhitened. The HIFs are significant up to 17 / 2f0. |
| In the text | |
|
Fig. 8 Left: EXODAT image showing the aperture applied to 648 (upper panel) and 544 (lower panel). Right: 1′ × 1′V image of the targets taken by the 1m RCC telescope at Piszkés-tető. North is to the right and east to the bottom. The variable star is located between the thick lines. We transformed our frames to match the EXODAT images except a slight (30 degrees) rotation. 648 was caught around pulsational minimum, and 544 around pulsational maximum. |
| In the text | |
|
Fig. 9 Sections of light curve where period doubling is present in the blended Blazhko CoRoT RRab star 544. Even and odd maxima are marked with different symbols. Original data points are denoted by small black points. |
| In the text | |
|
Fig. 10 Same as Fig. 9, but for the Blazhko CoRoT RRab star 434. The switch back and forth between the two branches in the right panel is a clear signal pointing to more complex dynamical behavior. |
| In the text | |
|
Fig. 11 Temporal variability of additional frequencies in RRab, RRd, and RRc stars. Upper left: lower panel: amplitude variation of the additional f′ = 2.61219586 d-1 frequency of CoRoT Blazhko RR Lyrae star 434. The fundamental mode frequency, its harmonics, and the side peaks related to the modulation (and the modulation frequency itself) were removed. Upper panels: the vicinity of f′ in the frequency spectrum, lower panels: amplitude variation. Upper right: the same for the temporal variability of f′ = 4.4786159 d-1 CoRoT RRd star 812. The first overtone frequency and its harmonics were removed. Lower left: temporal variation of the f′ = 4.37783 d-1 frequency of CoRoT RRc star 241. The first overtone frequency and its harmonics were removed. Lower right: the same as for the RRc star 241, but for 652. The amplitudes are smaller than in 241, but the variation in the structure of the f′ = 5.82484 d-1 peak is strikingly similar. |
| In the text | |
|
Fig. 12 Phased light curves of two CoRoT RRc stars. Left: 241. Right: 652. |
| In the text | |
|
Fig. 13 Frequency spectrum of the star 241 with sequential prewhitening. Some characteristic frequencies are labeled with their identification. Sat refers to frequencies connected to the orbit of the CoRoT satellite. a) The original spectrum dominated by the first overtone pulsation mode (f1). b) After prewhitening with f1 and its harmonics. c) The result of removing f′ and all combination terms involving f1 and f′. d) Prewhitening with all f1 ± k ∗ fm and f′ ± k ∗ fm frequencies. e) After removing all significant f1 ± k ∗ fb and f′ ± k ∗ fb frequencies. f) Removing another 13 frequencies including those from the satellite and third order linear combinations of {f1,f′,fm,fb}. |
| In the text | |
Current usage metrics show cumulative count of Article Views (full-text article views including HTML views, PDF and ePub downloads, according to the available data) and Abstracts Views on Vision4Press platform.
Data correspond to usage on the plateform after 2015. The current usage metrics is available 48-96 hours after online publication and is updated daily on week days.
Initial download of the metrics may take a while.