Fig. 1
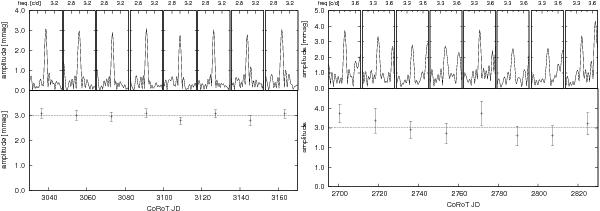
Test results for detection of the temporal variation of low-amplitude frequencies. Left panel: the amplitude of the constant, 3 mmag amplitude frequency injected at ftest = 3.0 d-1 into the light curve of 241, a CoRoT RRc star (see Sect. 4.3). Right panel: a more complex case: we added a constant (3 mmag) amplitude frequency to the light curve of the strongly modulated Blazhko RR Lyrae, 962. We chose ftest = 3.4 d-1. Horizontal lines show the amplitude of the injected signal, points with error bars come from our method. The upper row shows the shape and the vicinity of the recovered frequency in the applied eight bins.
Current usage metrics show cumulative count of Article Views (full-text article views including HTML views, PDF and ePub downloads, according to the available data) and Abstracts Views on Vision4Press platform.
Data correspond to usage on the plateform after 2015. The current usage metrics is available 48-96 hours after online publication and is updated daily on week days.
Initial download of the metrics may take a while.