Fig. 5
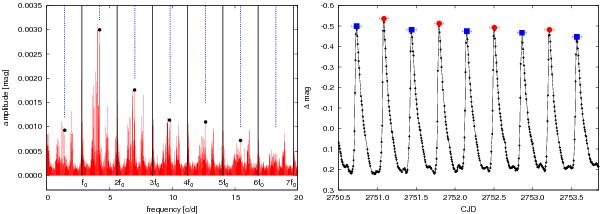
Left panel: low-frequency part of the Fourier spectrum of 962. The dominant pulsation frequency (f0), its harmonics and the modulation triplets were pre-whitened. Black lines show the location of f0 and its harmonics, while the blue dash-dotted lines show the location of the half-integer frequencies. To visualize the distribution of the amplitudes of the HIFs we plotted black points on top of the frequencies stemming from the PD effect. The HIFs are significant up to 11 / 2f0. Right panel: small part of the CoRoT light curve of 962 clearly showing alternating maxima, i.e. period doubling. Fitted maxima are plotted to guide the eye.
Current usage metrics show cumulative count of Article Views (full-text article views including HTML views, PDF and ePub downloads, according to the available data) and Abstracts Views on Vision4Press platform.
Data correspond to usage on the plateform after 2015. The current usage metrics is available 48-96 hours after online publication and is updated daily on week days.
Initial download of the metrics may take a while.