| Issue |
A&A
Volume 570, October 2014
|
|
|---|---|---|
| Article Number | A55 | |
| Number of page(s) | 19 | |
| Section | Cosmology (including clusters of galaxies) | |
| DOI | https://doi.org/10.1051/0004-6361/201423771 | |
| Published online | 15 October 2014 | |
An excess of dusty starbursts related to the Spiderweb galaxy⋆
1
Universität Wien, Institut für Astrophysik,
Türkenschanzstraße 17,
1180
Wien,
Austria
e-mail:
This email address is being protected from spambots. You need JavaScript enabled to view it.
2
Max-Planck-Institut für extraterrestrische Physik,
Giessenbachstraße
1, 85748
Garching,
Germany
3
European Southern Observatory, Karl Schwarzschild Straße 2, 85748
Garching,
Germany
4
INAF – Osservatorio Astrofisico di Arcetri, Largo E. Fermi 5,
50125
Firenze,
Italy
5
Optical and Infrared Astronomy Division, National Astronomical
Observatory of Japan, Mitaka,
181-8588
Tokyo,
Japan
6
Institute of Space Astronomical Science, Japan Aerospace Exploration Agency,
Sagamihara,
252-5210
Kanagawa,
Japan
7
International Centre for Radio Astronomy Research, Curtin
University, Perth,
Australia
8
Kavli Institute for the Physics and Mathematics of the Universe,
The University of Tokyo, 5-1-5
Kashiwanoha, Kashiwa-shi, 277-8583
Chiba,
Japan
9
School of Physics and Astronomy, University of Nottingham,
University Park, Nottingham
NG7 2RD,
UK
10
Herschel Science Centre, European Space Astronomy Centre, ESA,
28691
Villanueva de la Cañada,
Spain
11
INAF – Osservatorio di Roma, via Frascati 33,
00040
Monteporzio,
Italy
12
Leiden Observatory, PO Box 9513, 2300 RA
Leiden, The
Netherlands
13
Max-Planck Institut für Astronomie, Königstuhl 17, 69117
Heidelberg,
Germany
Received:
7
March
2014
Accepted:
7
September
2014
Abstract
We present APEX LABOCA 870 μm observations of the field around the high-redshift radio galaxy MRC1138−262 at z = 2.16. We detect 16 submillimeter galaxies (SMGs) in this ~140 arcmin2 bolometer map with flux densities in the range 3–11 mJy. The raw number counts indicate a density of SMGs that is up to four times that of blank field surveys. Based on an exquisite multiwavelength database, including VLA 1.4 GHz radio and infrared observations, we investigate whether these sources are members of the protocluster structure at z ≈ 2.2. Using Herschel PACS and SPIRE and Spitzer MIPS photometry, we derive reliable far-infrared (FIR) photometric redshifts for all sources. Follow-up VLT ISAAC and SINFONI NIR spectra confirm that four of these SMGs have redshifts of z ≈ 2.2. We also present evidence that another SMG in this field, detected earlier at 850 μm, has a counterpart that exhibits Hα and CO(1–0) emission at z = 2.15. Including the radio galaxy and two SMGs with FIR photometric redshifts at z = 2.2, we conclude that at least eight submm sources are part of the protocluster at z = 2.16 associated with the radio galaxy MRC1138−262. We measure a star formation rate density SFRD ~1500 M⊙ yr-1 Mpc-3, four magnitudes higher than the global SFRD of blank fields at this redshift. Strikingly, these eight sources are concentrated within a region of 2 Mpc (the typical size of clusters in the local universe) and are distributed within the filaments traced by the HAEs at z ≈ 2.2. This concentration of massive, dusty starbursts is not centered on the submillimeter-bright radio galaxy which could support the infalling of these sources into the cluster center. Approximately half (6/11) of the SMGs that are covered by the Hα imaging data are associated with HAEs, demonstrating the potential of tracing SMG counterparts with this population. To summarize, our results demonstrate that submillimeter observations may enable us to study (proto)clusters of massive, dusty starbursts.
Key words: galaxies: individual: MRC1138 / 262 / galaxies: clusters: individual: MRC1138 / 262 / galaxies: high-redshift / cosmology: observations / infrared: galaxies / submillimeter: galaxies
LABOCA and VLA images (FITS files) are only available at the CDS via anonymous ftp to cdsarc.u-strasbg.fr (130.79.128.5) or via http://cdsarc.u-strasbg.fr/viz-bin/qcat?J/A+A/570/A55
© ESO, 2014
1. Introduction
The questions of when and how present-day galaxy clusters formed at high redshift have driven extensive searches for protoclusters of galaxies in the distant Universe in the past two decades (e.g., Le Fevre et al. 1996; Steidel et al. 1998; Pentericci et al. 2000; Kurk et al. 2000, 2004a,b; Best et al. 2003; Matsuda et al. 2005; Daddi et al. 2009a; Galametz et al. 2010; Galametz et al. 2012; Hatch et al. 2011a,b; Mayo et al. 2012; Walter et al. 2012; Wylezalek et al. 2013). Powerful high-redshift radio galaxies (HzRGs; see the review by Miley & De Breuck 2008) are considered to be the most promising signposts of the most massive clusters in formation. Surveys of Lyα emitters (LAEs), Hα emitters (HAEs), Lyman break galaxies (LBGs), and extremely red objects (EROs) in several fields containing radio galaxies, up to redshifts of 5.2, produced evidence of galaxy overdensities in almost all cases (e.g., Kurk et al. 2000; Miley et al. 2006; Overzier et al. 2006; Pentericci et al. 2000; Venemans et al. 2002, 2004, 2005, 2007), even out to 10 Mpc (Intema et al. 2006). These surveys convincingly demonstrate that HzRGs are good signposts of overdensities of galaxies at high redshift, at least in optical and near-infrared (NIR) bands.
In the past decade (sub)millimeter surveys have revolutionized our understanding of the formation and evolution of galaxies by revealing a population of high-redshift, dust-obscured galaxies that are forming stars at a tremendous rate. Submillimeter galaxies (SMGs; see the review by Blain et al. 2002), first discovered by Smail et al. (1997), have intense star formation, with rates of a few hundred to several thousand solar masses per year, but due to strong dust obscuration inconspicuous at optical/NIR wavelengths (e.g., Dannerbauer et al. 2002, 2004). These dusty starbursts are massive (a few times 1011 M⊙, see e.g., Genzel et al. 2003; Greve et al. 2005), and are probably the precursors of present-day ellipticals (e.g., Lutz et al. 2001; Ivison et al. 2013). Furthermore, SMGs are not uniformly distributed (Hickox et al. 2012) and are excellent tracers of mass density peaks (Ouchi et al. 2004) and thus of so-called protoclusters – the precursors of structures seen in the local universe such as the Coma cluster. These early (proto)clusters place significant constraints on models of galaxy assembly at those redshifts (Stern et al. 2010), and offer us a unique opportunity to explore episodes of bursting star formation in a critical epoch of galaxy formation.
Up to now, large scale structures like overdensities of galaxies have only been found through optical/NIR observations. However, we note that these optical and NIR techniques mainly trace (rather low-mass) galaxies with unobscured star formation, making up only 50% of the cosmic star formation activity (Dole et al. 2006). As outlined above, overdensities of unobscured star forming galaxies have been detected around a significant sample of HzRGs, but the detection of obscured star forming galaxies in these fields is lagging behind. Several studies report an excess of SMGs near HzRGs and QSOs (e.g., Stevens et al. 2003; De Breuck et al. 2004; Greve et al. 2007; Priddey et al. 2008; Stevens et al. 2010; Carrera et al. 2011; Rigby et al. 2014). However, the recent analysis of Herschel observations of the field of 4C+41.17 at z = 3.8 by Wylezalek et al. (2013) illustrates the importance of determining the redshifts of the SMGs. Wylezalek et al. (2013) show that most of the Herschel sources are foreground to the radio galaxy, casting doubts on the earlier claim from Ivison et al. (2000) of an overdensity related to the radio galaxy based on SCUBA observations.
One of the best studied large scale structures so far is the protocluster associated with the HzRG MRC1138−262 at z = 2.16, the so-called Spiderweb galaxy (Miley et al. 2006). Lyα and Hα imaging/spectroscopy of this field reveal an excess of LAEs compared to blank fields (Kurk et al. 2000, 2004a,b; Pentericci et al. 2000; Hatch et al. 2011b). Two attempts to search for submillimeter overdensities on this field are known. Using SCUBA, Stevens et al. (2003) report the (tentative) excess of SMGs, and spatial extension of the submillimeter emission of the HzRG MRC1138−262. However, we note that the field of view of SCUBA only has a diameter of 2′ (~1 Mpc at z = 2.16), and thus the reported SMG excess is based on very small numbers. Rigby et al. (2014) present Herschel SPIRE observations of a larger field (~400 arcmin2), centered on the HzRG. They report an excess of SPIRE 500 μm sources but found no filamentary structure in the far-infrared (FIR) as seen in the rest-frame optical (Kurk et al. 2004a; Koyama et al. 2013a). However, in both cases no counterpart identification was attempted for the individual sources. In addition, Valtchanov et al. (2013) report the serendipitous discovery of an overdensity of SPIRE 250 μm sources 7′ south of the protocluster. Based on the modfied blackbody derived redshift distribution, incorporating both the color information and the SED shape, they conclude that the majority of the 250 μm sources in the overdensity are likely to be at a similar redshift. With the available scarce multiwavelength data they cannot exclude the attractive possibility that the overdensity is within the same structure as the Spiderweb at z ≈ 2.2.
In this paper, we present our search for SMGs in the field of MRC1138−262 using APEX LABOCA 870 μm observations. We discover 16 LABOCA sources, which is a significant excess of SMGs compared to blank field surveys. We identify the counterparts of the SMGs using the existing exquisite multiwavelength data on this field (Pentericci et al. 2000; Kurk et al. 2004a,b; Seymour et al. 2012; Koyama et al. 2013a). The main aim of this work is to verify how many of the 16 SMGs are part of the well-known protocluster structure at z ≈ 2.2. We mainly focus on Spitzer MIPS, Herschel PACS and SPIRE, and VLA data, complemented by narrow-band images of HAEs at z ≈ 2.2. We show that HAEs can readily be used to identify the counterparts of SMGs since several SMGs are bright in Hα.
The structure of this paper is as follows. Sections 2 and 3 describe the observations of the field around the HzRG MRC1138−262 and the associated LABOCA sources. In Sect. 4 we present the method for deriving FIR photometric redshifts, luminosities and star formation rates for the LABOCA sources. In Sect. 5 we discuss the sources individually and in Sect. 6 the properties of the SMG overdensity. We adopt the cosmological parameters Ωmatter = 0.27, ΩΛ = 0.73, and H0 = 71 km s-1 Mpc-1 (Spergel et al. 2003, 2007).
2. Observations and data reduction
2.1. LABOCA imaging
We mapped a field of ~140 arcmin2 around the HzRG MRC1138−262 with the bolometer camera LABOCA (Siringo et al. 2009) installed on the APEX telescope through ESO (ID: 084.A-1016(A), PI: Kurk) and Max-Planck-Gesellschaft (MPG, ID: 083.F-0022, PI: Kurk) time. The LABOCA instrument contains 295 bolometer elements and operates at an effective frequency of 345 GHz corresponding to 870 μm. The LABOCA array covers a field of view of 11.4′ with a FWHM of 19′′ at 870 μm. The observations were taken between August and December 2009 in service mode, under excellent atmospheric conditions with typical zenith opacities between 0.2 and 0.3 at 870 μm. The total on sky integration time was 16.6 h.
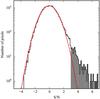 |
Fig. 1 Pixel signal-to-noise values of our LABOCA map. The red solid line shows a Gaussian fit. The significant excess of pixels with a S/N ≥ 3σ is shown in grey. Almost all of these pixels belong to selected sources and none to pixels at the edge of the map. |
We used the raster spiral scanning mode which combines the spiral scanning pattern with raster mapping. This mode has the advantage of producing a fully sampled map of the total field-of-view of LABOCA in a dense sampling pattern. The calibration observations were performed on a regular basis and included pointing, focus and flux calibration, see Siringo et al. (2009) for more details. Each scan was carefully inspected for the presence of possible outliers, anomalies, and the influence of instabilities in the atmosphere. The data were reduced using miniCrush (Kovács 2008), a commonly used software for the reduction of (sub)millimeter bolometric data. We used the option “-deep” that is optimized for the reduction of deep field data containing faint, point-like sources. The end product of the miniCrush reduction is a multi-frame FITS image containing a signal map, a noise map, a signal-to-noise map and an exposure time map.
In the central part of the LABOCA map (~56 arcmin2), we achieve an rms noise level of 1.3–1.9 mJy. In Fig. 1, we show the pixel signal-to-noise distribution of our LABOCA map. The main distribution of pixel values are well fit by a Gaussian centered at zero. However, there is significant excess of positive valued pixels with a signal-to-noise ratio (S/N) ≥ 3σ. This skewed distribution indicates that the pixels with excess are associated with real submillimeter sources. We have checked this by identifying all pixels with a S/N ≥ 3σ on the map and confirmed that almost all of these belong to sources identified in Sect. 5 and none lie near the edge of the map.
We have searched our LABOCA signal-to-noise map within the region where the noise is σ< 3.0 mJy/beam (Fig. 2) for S/N peaks down to 3.5σ. Furthermore, we cross-identified LABOCA S/N peaks below 3.5σ which are detected at similar submm wavelengths, in our case by Herschel (see below this and Sect. 2.3 for more details) as potential LABOCA sources. The detected sources had to have at least the size of the LABOCA beam. In Table 1 we list all 16 sources in order of signal-to-noise and from now on we use their alias (DKB01–DKB16). Twelve LABOCA sources are classified as secure (S/N ≥ 3.5), the remaining four sources are classified as cross-identified tentative. We give the position of the pixel with the highest S/N and list the peak fluxes – a standard technique in radio astronomy – obtained from the signal map. We used two approaches to verify the reliability of our selected sources. The first approach relies on checking observations of the same field at similar wavelengths. We use our Herschel PACS and SPIRE dataset, see forthcoming Sect. 2.3 for more details. With these deep and wide “auxiliary” Herschel data, we can very well discard spurious LABOCA sources. Only one out of 16 sources (DKB09) is not detected at any of the Herschel bands. Especially, all of the four “tentative” LABOCA sources have significantly detected Herschel counterparts, see also Table 2. The second approach is based on the so-called jackknife technique: We split the ESO and MPG data into two groups of similar integration time. All 16 sources were detected in both datasets. Finally, we investigated the reliability of our source extraction approach. For this sanity check, we used the source extraction tool detect, part of the software package Crush (Kovács 2008). Beside the 2.4σ source, all sources could be “recovered” by this extraction algorithm down to 3.0σ, giving us faith in our approach. For sources with ≳3.5σ, the false detection rate is estimated on 0.2 sources among the 12 secure sources, justifying that we call this sample “secure”. To guarantee a proper comparison with the only known LABOCA deep field on the ECDFS (LESS Weiß et al. 2009), we used only our 3.7σ sources for surface density calculations.
 |
Fig. 2 LABOCA signal map of the field around the high-z radio galaxy MRC1138−262 (#7). Encircled, we show the location of 16 SMGs extracted from our LABOCA map. Contours indicate the noise at 1.3, 1.9, 2.6, 3.0, 3.7, 5.2 and 7.4 mJy/beam. The dashed contour encompasses the region where the noise is σ< 3.0 mJy/beam, including all selected 16 LABOCA sources. The source density is up to 4× higher than in the ECDFS. North is at the top and east is to the left. |
870 μm LABOCA source catalog of the field of MRC1138−262.
2.2. VLA imaging
The MRC 1138-262 field was observed with the Karl G. Jansky Very Large Array (VLA; Napier, Thompson & Ekers 1983) on UT 2002 April 1–12 for a total of 12 h in A configuration at 20 cm (ID: AD0463, PI: De Breuck). We observed in a pseudo-continuum, spectral line mode with 7 × 3.125 MHz channels. The point source 1351−148 was monitored every 40 min to obtain amplitude, phase and bandpass calibration, and an observation of 3C 286 was used to obtain the absolute flux calibration.
Standard spectral-line calibration and editing of the data was performed using the NRAO
𝒜ℐ𝒫𝒮 package and standard wide field imaging techniques (Taylor, Carilli, & Perley 1999). The final
 image has an rms noise level of 19
μJy
beam-1, except in
an area close to the central radio galaxy which is limited by the ability to clean the
bright radio source. The dynamic range achieved is ~104. The FWHM resolution of the
restoring beam is
image has an rms noise level of 19
μJy
beam-1, except in
an area close to the central radio galaxy which is limited by the ability to clean the
bright radio source. The dynamic range achieved is ~104. The FWHM resolution of the
restoring beam is  at a position angle PA =
–10°.
at a position angle PA =
–10°.
2.3. Panchromatic observations
To analyse the 16 LABOCA sources we used several additional datasets (see also Fig. 9):
-
Hα spectroscopy: in February 2012 we conducted VLT ISAAClong-slit NIR spectroscopic observations(ID: 088.A-0754(A), PI: Kurk) of the redshiftedHα line in visitor mode in order to confirm the redshifts of several LABOCA sources that were likely to be protocluster members. A detailed discussion of these observations will be presented in Kurk et al. (in prep.). In the current paper we only use the redshifts from these NIR spectra for our analysis and discussion. Furthermore, very recently we obtained VLT SINFONI IFU spectrosopy (ID: 090.B-0712(A), PI: Kurk) data of four likely merging galaxies at z ≈ 2.2 that are in the LABOCA FWHM of one of the SMGs.
-
Hα imaging: a total area of ~50 arcmin2 was imaged with the MOIRCS camera on the SUBARU telescope using a narrow-band filter covering Hα emitted at the redshift of the radio galaxy (for a detailed description see Koyama et al. 2013a). The narrow-band filter NB2071 (λ = 2.068 μm, Δλ = 0.027 μm) covered the redshift range z = 2.13−2.17. These data encompassed the smaller (~12 arcmin2) but deeper Hα data taken with the VLT ISAAC by Kurk et al. (2004a,b).
-
Lyα imaging: a subsection of the LABOCA field (~49 arcmin2) was imaged in Lyα redshifted to z = 2.16. Details of these observations can be found in Kurk et al. (2000, 2004a).
-
Herschel data: this field was observed in the FIR with the instruments PACS and SPIRE onboard of the Herschel Space Observatory (Pilbratt et al. 2010; Poglitsch et al. 2010; Griffin et al. 2010) as part of the project scientist guaranteed time (PI: Altieri). These observations are presented in detail in Seymour et al. (2012) and Valtchanov et al. (2013). The PACS images achieve 3σ sensitivities of ~4.5 mJy and ~9.0 mJy at 100 μm and 160 μm, respectively. The SPIRE images achieve 3σ sensitivities of ~7.5 mJy, ~8.0 mJy and ~9.0 m Jy at 250 μm, 350 μm and 500 μm, respectively. The size of the PACS and SPIRE maps are ~120 arcmin2 and ~900 arcmin2 respectively (Valtchanov et al. 2013). The entire LABOCA map is covered by the SPIRE data and almost completely covered by PACS. There is also a wider SPIRE map (~30 arcmin radius) of similar depth that is presented in Rigby et al. (2014), however the extended regions are not required for the present analysis.
-
Spitzer MIPS 24 μm imaging: we use archival Spitzer 5′ × 5′ MIPS 24 μm images which are centered on the HzRG and cover about 20% of the LABOCA image. These data are used to derive FIR photometric redshifts and establish the SEDs of the LABOCA counterparts.
-
Optical/NIR photometric redshifts: Tanaka et al. (2010) derived photometric redshifts based on UgRIzJHKs and three IRAC channel photometry of the field covered by Spitzer.
Main properties of counterparts of the 870 μm LABOCA sources in the field arround MRC1138−256.
3. LABOCA source counterparts
We searched for LABOCA counterparts within  of the LABOCA detection in the MIPS 24
μm, PACS
100/160 μm and
VLA 1.4 GHz images (see Table 2). These wavelengths
(in particular 1.4 GHz) are well suited for finding SMG counterparts and obtaining more
precise positions than measured by the bolometer data (e.g., Dannerbauer et al. 2004, 2010; Pope et al. 2006). The search circle is consistent with
the FWHM of the LABOCA beam and guarantees that no reliable associations are missed. For
each candidate counterpart within the search radius we calculate the corrected Poissonian
probability p that the SMG association is a chance coincidence. This
approach corrects the simple Poissonian probability of a detected association for the
possibility of associations of different nature but similar probability (Downes et al. 1986) and is widely applied and accepted in
the community (e.g., Ivison et al. 2002; Dannerbauer et al. 2004, 2010; Biggs et al. 2011; Smail et al. 2014). It basically depends on the search
radius, the distance of the potential counterpart to the LABOCA source and the source
surface density down to the flux level of the potential LABOCA counterpart. More recent work
that uses this method for SMGs can be found e.g. in Biggs et
al. (2011).
of the LABOCA detection in the MIPS 24
μm, PACS
100/160 μm and
VLA 1.4 GHz images (see Table 2). These wavelengths
(in particular 1.4 GHz) are well suited for finding SMG counterparts and obtaining more
precise positions than measured by the bolometer data (e.g., Dannerbauer et al. 2004, 2010; Pope et al. 2006). The search circle is consistent with
the FWHM of the LABOCA beam and guarantees that no reliable associations are missed. For
each candidate counterpart within the search radius we calculate the corrected Poissonian
probability p that the SMG association is a chance coincidence. This
approach corrects the simple Poissonian probability of a detected association for the
possibility of associations of different nature but similar probability (Downes et al. 1986) and is widely applied and accepted in
the community (e.g., Ivison et al. 2002; Dannerbauer et al. 2004, 2010; Biggs et al. 2011; Smail et al. 2014). It basically depends on the search
radius, the distance of the potential counterpart to the LABOCA source and the source
surface density down to the flux level of the potential LABOCA counterpart. More recent work
that uses this method for SMGs can be found e.g. in Biggs et
al. (2011).
Several previous attempts to locate secure counterparts of SMGs have been done using optical and NIR broad-band images (e.g., Webb et al. 2003b), the most successful one is to use Spitzer IRAC data (e.g., Pope et al. 2006; Hainline et al. 2009; Biggs et al. 2011). However, finding counterparts by applying p-statistics on optical and NIR images has not been very successful (e.g., Webb et al. 2003b). This is primarily because of the high surface density of (faint) optical and NIR sources which are not associated to the FIR and radio sources. Applying the p-statistic method is most promising using data with low surface densities of sources, such as radio or FIR images. In addition to this we find counterparts to several LABOCA sources in the Hα imaging data. This motivates us to test a new approach by applying the p-statistic method to the HAEs in the field of MRC1138−262 (Koyama et al. 2013a); cf. with Smail et al. (2014) who associated [OII] emitters successfully in the field and at the redshift of the cluster Cl0218.3−0510 with SMGs selected in this region.
Due to the large beam size of the SPIRE data (FWHM = 18′′−36′′) there is a large uncertainty in the measured position and source blending is a big problem. We therefore do not apply the p-statistic method to the SPIRE data. The derived probabilities of PACS, MIPS and Hα emitter (HAE) associations are based on raw number counts in the LABOCA field. At all wavelengths we search for counterparts of SMGs down to a signal-to-noise of 3σ. Bright radio emission from MRC1138 causes spurious sources in the VLA map that can not be “cleaned”. We therefore decide to assess the reliability of VLA counterparts using published number counts from e.g. Fomalont et al. (2006). Similar to e.g. Dannerbauer et al. (2010), we define the following quality criteria for assessing the robustness of identified candidate counterparts: we classify SMG associations with p ≤ 0.05 as secure, and those with 0.05 <p ≤ 0.10 as possible or tentative counterparts. Below we briefly discuss the results of the associations at different wavelengths.
3.1. VLA 1.4. GHz counterparts
Due to the limited dynamic range caused by the strong emission of the radio galaxy itself, the VLA map is shallow in comparison to other deep VLA integrations of submillimeter fields (e.g., Morrison et al. 2010). Eight out of 16 LABOCA sources, including the radio galaxy, have a VLA counterpart down to 3σ. The shallow depth of the VLA map may explain the rather low identification rate of 50%, however it is consistent with previous identification rates which range between 40 to 60% (e.g., Ivison et al. 2002; Dannerbauer et al. 2004). There are no cases of multiple VLA counterparts to a single LABOCA source in the field of MRC1138−262 and all VLA associations are classified as secure counterparts with fluxes between 60 and 620 μJy. However, we note that mm-interferometric observations have recently shown that not all VLA sources within the (sub)mm bolometer beam produce (sub)mm emission (e.g., Younger et al. 2007; Barger et al. 2012; Karim et al. 2013; Hodge et al. 2013), so we must be cautious in the interpretation of the eight VLA counterparts.
3.2. PACS 100 and 160 μm counterparts
We uncover PACS counterparts for nine SMGs, corresponding to a PACS identification rate of 56% of our whole SMG sample (see Table 2 for details). We detect 9 (6) SMGs at 160 (100) μm. All PACS 100 μm LABOCA associations are also detected at 160 μm. Although the PACS data are shallower than that of the PEP data of GOODS-N (Lutz et al. 2011), we find a higher identification rate than that reported by Dannerbauer et al. (2010) for the GOODS-N field. This could indicate that a significant fraction of LABOCA sources are at redshift z = 2.16, a redshift still accessible by Herschel PACS (see e.g. Fig. 3 in Dannerbauer et al. 2010). The 160 μm measurements lie close to the FIR peak so it is unsurprising that the number of PACS counterparts at 160 μm is higher than at 100 μm (see also Dannerbauer et al. 2010). We note that based on the corrected Poissonian probability p, each PACS detection within the bolometer beam (our search circle) is classified as an associated SMG counterpart, being consistent with the results reported by Dannerbauer et al. (2010). PACS fluxes of these dust-obscured sources range between 5.2 mJy to 530.9 mJy at 100 μm and 15.7 mJy to 652.0 mJy at 160 μm. Due to the shallowness of the VLA data, two PACS counterparts are not detected in the radio regime.
3.3. MIPS 24 μm counterparts
Due to the high surface density of MIPS 24 μm sources compared to VLA or Herschel sources the p-statistic is not as useful as in the radio or FIR regime. However, for completeness we performed the p-statistic for MIPS sources as well. In total, seven LABOCA sources are covered by the Spitzer MIPS 24 μm map. Except in one case (DKB13), VLA/HAE counterparts are associated with MIPS 24 μm sources. However, only three of them are classified as secure. In two cases the MIPS 24 μm detections would not have been classified as statistical possible associations demonstrating the very limited use of p-statistic applied on this source population.
3.4. Hα emitting counterparts
Eleven LABOCA sources are covered by the map of HAEs at z = 2.16, of which seven SMGs (DKB01, DKB03, DKB07, DKB08, DKB12, DKB16, DKB15) have HAEs within their LABOCA beams. In three cases, DKB01, DKB07 and DKB12, we find two, three and four HAEs within the search radius, respectively. Thirteen HAEs from Koyama et al. (2013a) are LABOCA counterparts of which 10 are classified as robust counterparts and only three are tentative. Therefore, this seems to be a very promising approach in order to find SMG counterparts (with subarcsecond position accuracy) for a (proto)cluster with known redshift.
13 out of 83 HAEs in the field of MRC1138 are correlated with SMGs. Koyama et al. (2013a) report 15 MIPS 24 μm associations (classified as dusty HAEs) out of 60 HAEs in the MIPS FOV of 5′ × 5′. Interestingly, five out of 13 HAEs (covered by MIPS) have MIPS 24 μm counterparts. The higher rate of MIPS associations is consistent with SMGs being dusty. Except for the HzRG, only two SMG counterparts identified as a HAE coincides with a robust VLA counterpart. Recent rest-frame Hα spectroscopy (Kurk et al., in prep.) confirms the redshifts of seven HAEs which are associated with LABOCA sources.
The Herschel PACS detections at 100 and/or 160 μm of all secure HAEs associated with LABOCA sources except one, reinforces our hypothesis that these sources are the true SMG counterparts. In the case of DKB12 all four HAEs are within/at the edge of the PACS 160 μm detection (no detection at 100 μm). None of the remaining HAEs classified as tentative SMG counterparts and without redshift confirmation are detected by PACS. We primarily use the Hα imaging data from Koyama et al. (2013a) for our analysis, however, to be complete we check if there are more HAEs in the deeper data of Kurk et al. (2004a).
4. FIR photometric redshifts, luminosities and star formation rates
We derive FIR photometric redshifts of the LABOCA sources to test the hypothesis of how many of the 16 LABOCA sources are part of the protocluster structure at z = 2.2. Since the launch of Herschel FIR photometric redshift determination has been established as a reliable diagnostic tool in order to investigate SMGs (e.g., Amblard et al. 2010; Roseboom et al. 2012; Pearson et al. 2013; Swinbank et al. 2014). Our FIR photometric redshifts are calculated using the code hyperz (Bolzonella et al. 2000) which minimizes the reduced χ2 to find the best photometric redshift solution.
We use both synthetic and empirical AGN and starburst templates from the SWIRE template library (Polletta et al. 2007) complemented with self-constructed SED templates. The latter are obtained by spline interpolation of the mid- and FIR emission from LABOCA sources with confirmed spectroscopic redshifts. The FIR emission of submillimeter sources, particularly those at high redshift, will be a superposition of the emission from stellar-heated dust and AGN activity. In most cases SED template libraries are derived from low-redshift sources and therefore often fail in fitting the FIR dust-bump for high redshift sources, whose shape can vary greatly due to differing contributions from starburst and AGN (e.g., Lagache et al. 2005; Polletta et al. 2007; Skibba et al. 2011).
We choose sources DKB07, 12c, 13, and 14, which cover a wide range of FIR SED shapes, to derive empirical dust templates. The final set of templates consists of four empirical templates and ten templates from the SWIRE library covering a range of galaxy types (e.g., elliptical galaxies, spiral galaxies, QSOs), see also Table 3. The resulting χ2 distribution and the best χ2 are derived by considering all redshifts and all templates in the final set. Note that the final χ2 curve shows the minimum χ2 for the template set as a function of redshift and therefore is dependent on the template set used.
Due to the varying spatial coverage of the supplementary multiwavelength data there are some sources that lie out of the field in some photometric bands. These photometric data points are not included. In case of non-detections at certain wavelengths 3σ upper limits are taken into account by hyperz. The best fitting SED and χ2 are shown in Figs. 3 and 4. 11 SMGs (without known redshifts) have best fit SEDs that are empirical demonstrating the big advantage of using empirical templates.
We test our photometric redshift analysis by only considering the FIR emission, i.e. SPIRE and LABOCA photometry. We derive templates from the same sources as above but without the MIPS detection and use the same ten templates from the SWIRE library as before and fit to find the best redshift solution. The photometric redshifts found mostly agree with the previously determined redshifts. For one source (DKB15) the MIPS detection, however, is crucial and we fail to find the same redshift. Our exercise shows that if the FIR peak and its Rayeigh-Jeans tail are well sampled by observations, we can construct reliable photometric redshifts from these data alone with typical uncertainties of 30% that allow us to conclude if a source can belong to a structure associated with MRC1138 or not. If this is not the case then shorter wavelength data are crucial for constraining photometric redshifts. We note that redshifted [CII] emission contributes to the SPIRE 500 μm flux for sources at z ≈ 2.2, see e.g. DKB01, DKB07, DKB12b in Fig. 3. This is consistent with Seymour et al. (2012) who describe the contribution of the [CII] emission to the SPIRE 500 μm flux for MRC1138−262. See also Smail et al. (2011) for a detailed discussion of the effect of FIR lines on FIR/submm broad-band fluxes.
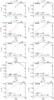 |
Fig. 3 SEDs of the submillimeter sources in the Spiderweb galaxy field. We show the best fitting hyperz template (dashed red line) and the best fit greybody curve (dotted blue line). Upper limits are indicated by blue arrows. Each plot reports on the spectroscopic redshift, if available, and gives the primary photo-z solution and the template used (in Table 3 the template number is defined). Based on this analysis, the protocluster membership of several sources has been verified. |
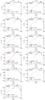 |
Fig. 3 continued. |
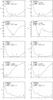 |
Fig. 4 Minimum χ2 as a function of redshift for the submillimeter sources in the Spiderweb galaxy field. Thick red arrows show the redshift of the primary solution of the photo-z fitting, thin red arrows show the redshift of the secondary solution and blue arrows spectroscopic redshifts. The grey dashed line indicates the redshift of the Spiderweb galaxy. |
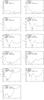 |
Fig. 4 continued. |
Figure 5 shows the distribution of photometric redshifts for all 16 LABOCA sources. The results suggest that a significant fraction (about 50%) of the submillimeter sources are consistent with being protocluster members.
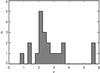 |
Fig. 5 FIR photometric redshifts (grey filled histogram). Our FIR photometric analysis suggests that a significant fraction of the LABOCA sources are associated with the protocluster around the Spiderweb galaxy at z = 2.2. |
For sources with four or more detections in the Herschel and LABOCA bands
we derive dust temperatures, FIR luminosities and star formation rates (SFR), see Table
3. These sources were fit with a grey-body law of
the form: 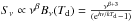 where Sν is the flux density at
the rest-frame frequency ν, β the grain emissivity index and Td the dust
temperature. Dust temperatures for an interstellar medium only heated by star formation are
expected to range between ~20–60
K, and β can
range between 1–2.5 (Casey 2012). For some sources
spectroscopic redshift are known (Table 3) and we use
them for the conversion to rest-frame flux density from which Td and
β are
inferred through fitting. If no spectroscopic information is available, we use the
photometric redshifts but also fix Td to 35 K and β to 1.5. This allows us to
overcome the well known Td − z degeneracy (Blain et al. 2002). If only three detections in the FIR
are available, we also fix Td and β and are thus able to
estimate LFIR and SFR. FIR luminosities are derived
by integrating the SED over the wavelength range 8–1000 μm and applying the relation
where Sν is the flux density at
the rest-frame frequency ν, β the grain emissivity index and Td the dust
temperature. Dust temperatures for an interstellar medium only heated by star formation are
expected to range between ~20–60
K, and β can
range between 1–2.5 (Casey 2012). For some sources
spectroscopic redshift are known (Table 3) and we use
them for the conversion to rest-frame flux density from which Td and
β are
inferred through fitting. If no spectroscopic information is available, we use the
photometric redshifts but also fix Td to 35 K and β to 1.5. This allows us to
overcome the well known Td − z degeneracy (Blain et al. 2002). If only three detections in the FIR
are available, we also fix Td and β and are thus able to
estimate LFIR and SFR. FIR luminosities are derived
by integrating the SED over the wavelength range 8–1000 μm and applying the relation
 where DL is the
luminosity distance computed from their photometric redshifts (spectroscopic redshifts are
used if they are available). We then estimate the star formation rates by using
SFR [
M⊙ ] =
LFIR/5.8 ×
109L⊙ (Kennicutt 1998)1. The derived SFR
of 1800 M⊙ yr-1 for MRC1138−262 (DKB7) agrees well with the SFR found by
Seymour et al. (2012).
where DL is the
luminosity distance computed from their photometric redshifts (spectroscopic redshifts are
used if they are available). We then estimate the star formation rates by using
SFR [
M⊙ ] =
LFIR/5.8 ×
109L⊙ (Kennicutt 1998)1. The derived SFR
of 1800 M⊙ yr-1 for MRC1138−262 (DKB7) agrees well with the SFR found by
Seymour et al. (2012).
5. Notes on individual objects
In this section we discuss secure and possible counterparts (based on the p-statistic) for all 16 LABOCA sources and whether the source could be a member of the large scale structure at redshift z = 2.16. SMG counterparts with spectroscopical confirmation at the redshift of the protocluster and consistent FIR photometric redshift are classified as secure members of this large scale structure at z ≈ 2.2. We assess a protocluster membership as possible if the optical/NIR photometric redshift respectively the selection as an HAE without spectroscopic confirmation is strengthened by FIR photo-z. We exclude the membership if optical/NIR and FIR photo-z are discrepant. Remaining sources where no reliable judgement on the cluster membership can be made, we classify as uncertain members.
For each LABOCA source we show 40′′ × 40′′ images at radio, FIR, 24 μm and Hα wavelengths (Fig. 6). We only discuss sources within the 9.5′′ search radius (the FWHM of the LABOCA beam). At redshift z = 2.16, 1 arcsec corresponds to 8.4 kpc.
“Secure” LABOCA sources
SMM J114100.0−263039 (DKB01, protocluster member YES)
– there are two HAEs located  and
and
 from the nominal LABOCA position. Both
HAEs are classified as secure counterparts by the p-statistic and are only separated by
4
from the nominal LABOCA position. Both
HAEs are classified as secure counterparts by the p-statistic and are only separated by
4 or 37.8 kpc. This counterpart has a
spectroscopic redshift of 2.165 (Kurk et al. in prep.). The FIR photo-zzFIR = 2.3 ± 0.7
is consistent with the spectroscopic redshift. The association of Herschel
flux with DKB01b strongly suggests that this source is (partly) responsible for the
submillimeter emission. The closer HAE (DKB01a) has an optical/NIR photometric redshift of
or 37.8 kpc. This counterpart has a
spectroscopic redshift of 2.165 (Kurk et al. in prep.). The FIR photo-zzFIR = 2.3 ± 0.7
is consistent with the spectroscopic redshift. The association of Herschel
flux with DKB01b strongly suggests that this source is (partly) responsible for the
submillimeter emission. The closer HAE (DKB01a) has an optical/NIR photometric redshift of
 (Tanaka et al. 2010) and the redshift has been
very recently confirmed to be z
= 2.2 (Shimakawa et al. 2014). The
Herschel detection appears to be associated to the more distant HAE,
DKB01b. DKB01 and DKB03 are only separated by
(Tanaka et al. 2010) and the redshift has been
very recently confirmed to be z
= 2.2 (Shimakawa et al. 2014). The
Herschel detection appears to be associated to the more distant HAE,
DKB01b. DKB01 and DKB03 are only separated by  (205 kpc) and the LABOCA map shown in
Fig. 2 indicates that these two sources could be
connected to each other.
(205 kpc) and the LABOCA map shown in
Fig. 2 indicates that these two sources could be
connected to each other.
SMM J114053.3−262913 (DKB02, (P)OSSIBLE MEMBER) –
within the LABOCA beam we find a prominent X-ray source: an AGN at z = 1.512 (X9 Pentericci et al. 2002; Croft et al. 2005). However, the secure VLA association
( away) is not associated with this X-ray
source. The location of the Herschel PACS counterpart suggests that the
LABOCA emission is related to the VLA source,
away) is not associated with this X-ray
source. The location of the Herschel PACS counterpart suggests that the
LABOCA emission is related to the VLA source,  from the nominal LABOCA position, and not
to the AGN at z =
1.5. No spectroscopic redshift is known for this radio source, but both
the optical/NIR photometric redshift of
from the nominal LABOCA position, and not
to the AGN at z =
1.5. No spectroscopic redshift is known for this radio source, but both
the optical/NIR photometric redshift of  (Tanaka et al. 2010) and the FIR photometric
redshift of zFIR =
2.7 ± 0.8 means this SMG is a plausible protocluster member. Finally, we
note that
(Tanaka et al. 2010) and the FIR photometric
redshift of zFIR =
2.7 ± 0.8 means this SMG is a plausible protocluster member. Finally, we
note that  away from the nominal bolometric position
lies an HAE candidate from the sample of Kurk et al. (#211
in 2004a). Due to their shallower Hα data Koyama et al.
(2013a) do not recover this source. This source has no spectroscopic confirmation
and lies
away from the nominal bolometric position
lies an HAE candidate from the sample of Kurk et al. (#211
in 2004a). Due to their shallower Hα data Koyama et al.
(2013a) do not recover this source. This source has no spectroscopic confirmation
and lies  from the VLA position.
SMM J114058.3−263044 (DKB03, YES)–
 away from the nominal LABOCA position we
find a spectroscopically confirmed HAE (zspec = 2.163; Kurk et al. in prep.) which
is classified as secure by the corrected Poissonian probability. Neither VLA nor PACS
counterparts are associated with this LABOCA source. However, DKB03 is detected at all three
SPIRE wavelengths and the zFIR = 2.1 ± 0.7 is consistent with the
spectroscopic redshift of the Hα counterpart. The 250 μm source position lies
from the nominal LABOCA position, but
only
away from the nominal LABOCA position we
find a spectroscopically confirmed HAE (zspec = 2.163; Kurk et al. in prep.) which
is classified as secure by the corrected Poissonian probability. Neither VLA nor PACS
counterparts are associated with this LABOCA source. However, DKB03 is detected at all three
SPIRE wavelengths and the zFIR = 2.1 ± 0.7 is consistent with the
spectroscopic redshift of the Hα counterpart. The 250 μm source position lies
from the nominal LABOCA position, but
only  from the confirmed Hα emitter, suggesting that
this NIR excess source emits (some of) the dust emission detected by LABOCA.
from the confirmed Hα emitter, suggesting that
this NIR excess source emits (some of) the dust emission detected by LABOCA.
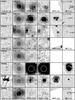 |
Fig. 6 Postage stamps of all 16 LABOCA sources, including VLA 1.4 GHz, LABOCA 870 μm, SPIRE 250 μm, PACS 160 μm, MIPS 24 μm and MOIRCS z = 2.16 Hα images. The 40′′ × 40′′ images are centered on the nominal LABOCA position and orientated such that north is at the top and east is to the left. The large white circle represents the size of the LABOCA beam (~19′′ diameter). Small circles are VLA and/or HAE sources. Spectroscopic (S) and photometric (P) redshifts are labeled in the top of the Hα images. |
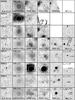 |
Fig. 6 continued. |
SMM J114046.8−262539 (DKB04, (U)NKNOWN)– this source is only
covered by the Herschel and VLA imaging. A faint, secure,
3.3σ VLA
counterpart, not detected by Herschel, lies
 from the nominal LABOCA position.
SMM J114043.9−262340 (DKB05, U) – only Herschel and VLA coverage exist of this 4.5σ LABOCA detection. A Herschel source detected at all three SPIRE bands is associated with this SMG.
SMM J114059.5−263200 (DKB06, NO) – at the position
of this SMG, we find a local spiral galaxy at z = 0.028 (Jones et
al. 2009). A 121.7 μJy faint radio source lies
 from the nominal bolometer position. This
VLA counterpart is detected by the Chandra X-ray Observatory (X14 in Pentericci et al. 2002). Within the LABOCA beam two more
X-ray sources are found by the same authors (X13 and X15). According to Pentericci et al. (2002) all three sources are related to
the spiral galaxy. The spiral galaxy is also detected at two IRAS bands, at 60 and 100
μm (IRAS
F11384−2615; Moshir & et al. 1990). Based on the IRAS colours
(Perault et al. 1987) we estimate an infrared
luminosity LIR = 4.1
× 108L⊙. The PACS flux measured at
100 μm of
530.9 ± 26.6 mJy is lower than
the IRAS flux of 790 ± 180 mJy
at the same wavelength. The VLA counterpart is detected at PACS wavelengths as well. This
source is the brightest object in the Herschel images. As far as we know
this object is one of the lowest redshift SMGs discovered by blind submillimeter ground
based surveys. Only a handful of SMGs in the local Universe are known (e.g., Webb et al. 2003a; Chapman et al. 2005). However the submillimeter source may lie behind the spiral
galaxy. The FIR photometric redshift discussed in Sect. 4 suggests zFIR = 0.8 ± 0.2, however, the
χ2
distribution shown in Fig. 4 indicates lower redshift
solutions are also plausible. PACS would not be able to detect the very low infrared
luminosity of LIR =
8.6 × 10⁹L⊙ if it was emitted at
z ≈ 1.
Furthermore, due the sensitivity of the IRAS satellite, the IRAS flux can only be associated
to the spiral galaxy.
from the nominal bolometer position. This
VLA counterpart is detected by the Chandra X-ray Observatory (X14 in Pentericci et al. 2002). Within the LABOCA beam two more
X-ray sources are found by the same authors (X13 and X15). According to Pentericci et al. (2002) all three sources are related to
the spiral galaxy. The spiral galaxy is also detected at two IRAS bands, at 60 and 100
μm (IRAS
F11384−2615; Moshir & et al. 1990). Based on the IRAS colours
(Perault et al. 1987) we estimate an infrared
luminosity LIR = 4.1
× 108L⊙. The PACS flux measured at
100 μm of
530.9 ± 26.6 mJy is lower than
the IRAS flux of 790 ± 180 mJy
at the same wavelength. The VLA counterpart is detected at PACS wavelengths as well. This
source is the brightest object in the Herschel images. As far as we know
this object is one of the lowest redshift SMGs discovered by blind submillimeter ground
based surveys. Only a handful of SMGs in the local Universe are known (e.g., Webb et al. 2003a; Chapman et al. 2005). However the submillimeter source may lie behind the spiral
galaxy. The FIR photometric redshift discussed in Sect. 4 suggests zFIR = 0.8 ± 0.2, however, the
χ2
distribution shown in Fig. 4 indicates lower redshift
solutions are also plausible. PACS would not be able to detect the very low infrared
luminosity of LIR =
8.6 × 10⁹L⊙ if it was emitted at
z ≈ 1.
Furthermore, due the sensitivity of the IRAS satellite, the IRAS flux can only be associated
to the spiral galaxy.
SMM J114048.4−262914 (DKB07, YES) – Seymour et al. (2012) discuss in detail the infrared properties of this radio galaxy, MRC1138−262. The LABOCA detection seems to be slightly elongated, which is also seen in the SPIRE bands at 350 and 500 μm (Seymour et al. 2012) and in SCUBA 850 μm data (Stevens et al. 2003), see also Sect. 6.1 for more details. This feature may be well due to multiple sources blended together, see also e.g., Karim et al. (2013) and Hodge et al. (2013) for details on this topic.
SMM J114033.9−263125 (DKB08, U) – within the LABOCA
beam we find two promising counterparts. The secure VLA source (DKB08b; S1.4 GHz = 70.9 ± 19.0
μJy) lies at the edge of the LABOCA beam
( from the nominal bolometer position). At
a distance of from the LABOCA position, lies a bright
Herschel Hα emitter. Unfortunately, no optical/NIR
photo-z
exists for these sources.
from the nominal bolometer position). At
a distance of from the LABOCA position, lies a bright
Herschel Hα emitter. Unfortunately, no optical/NIR
photo-z
exists for these sources.
SMM J114040.9−262555 (DKB09, U) – this LABOCA source is undetected at VLA and Herschel wavelengths and is not covered by Hα imaging.
SMM J114043.7−262216 (DKB10, U) – this is our
brightest LABOCA source (S870 μm = 11.0 ± 3.0
mJy), located at the edge and thus at the noisiest part of our LABOCA map. It is the only
SMG without PACS coverage. The reliability of the LABOCA detection is strengthened by a
SPIRE source which is  separated from the nominal LABOCA
position and peaks at 350 μm.
separated from the nominal LABOCA
position and peaks at 350 μm.
SMM J114038.5−263201 (DKB11, U) – at the edge of
the LABOCA beam,  away from the nominal LABOCA position, we
find a 350 μm
peaker which could lie at z =
2.6 ± 0.7. Only
away from the nominal LABOCA position, we
find a 350 μm
peaker which could lie at z =
2.6 ± 0.7. Only  from the LABOCA position lies a candidate
Lyα emitter
(#73 in Kurk et al. 2004a). However, Croft et al. (2005) reveal a spectroscopic redshift of
0.671 for this source.
from the LABOCA position lies a candidate
Lyα emitter
(#73 in Kurk et al. 2004a). However, Croft et al. (2005) reveal a spectroscopic redshift of
0.671 for this source.
SMM J114057.6−262933 (DKB12, YES) – this
3.6σ LABOCA
detection is the most complex source in our sample. A 162.7 μJy bright 20 cm source lies
 away from the nominal LABOCA position.
Four HAEs, separated by only
away from the nominal LABOCA position.
Four HAEs, separated by only  (46.2 kpc) lie within the LABOCA beam.
Two emitters show a strong Hα line at z = 2.170 (DKB12a) and z = 2.163 (DKB12c) in ISAAC
spectroscopy (Kurk et al. in prep.). SINFONI 3D spectroscopy of this complex source confirms
that the components 12b (VLA counterpart) and 12d lie at similar redshifts. From the SINFONI
observations we obtain following spectroscopic redshifts: 12a: z = 2.171, 12b:
z = 2.170,
12c: z = 2.164,
and 12d: z =
2.166 (Kurk et al., in prep.). The latter source is also selected as a
Lyα emitting
candidate (Kurk et al. 2004a). The PACS beam has a
FWHM of
(46.2 kpc) lie within the LABOCA beam.
Two emitters show a strong Hα line at z = 2.170 (DKB12a) and z = 2.163 (DKB12c) in ISAAC
spectroscopy (Kurk et al. in prep.). SINFONI 3D spectroscopy of this complex source confirms
that the components 12b (VLA counterpart) and 12d lie at similar redshifts. From the SINFONI
observations we obtain following spectroscopic redshifts: 12a: z = 2.171, 12b:
z = 2.170,
12c: z = 2.164,
and 12d: z =
2.166 (Kurk et al., in prep.). The latter source is also selected as a
Lyα emitting
candidate (Kurk et al. 2004a). The PACS beam has a
FWHM of  at 100 μm so it is impossible to
associate the Herschel fluxes to one or more of these components directly.
Millimeter interferometric observations are crucial in order to reveal the locations of the
dust emission within this complex.
at 100 μm so it is impossible to
associate the Herschel fluxes to one or more of these components directly.
Millimeter interferometric observations are crucial in order to reveal the locations of the
dust emission within this complex.
“Cross-identified tentative” LABOCA sources
SMM J114048.3−262748 (DKB13, NO) – we find a secure
20 cm radio source away from the nominal LABOCA position.
The radio source seems to be associated with Herschel detections at all
five bands. However, the Herschel SPIRE colours exclude protocluster
membership and favour a lower redshift. This finding is consistent with the derived
optical/NIR photometric redshift of  (Tanaka et al. 2010) for the VLA source.
SMM J114042.4−262715 (DKB14, NO) – only
 away from the nominal LABOCA position
lies the brightest radio counterpart (618.5 μJy) of an SMG in our sample. This VLA source is
detected by Herschel at all five bands. Again the Herschel
colours imply a low redshift. The optical-NIR counterpart photometric redshift
suggests
away from the nominal LABOCA position
lies the brightest radio counterpart (618.5 μJy) of an SMG in our sample. This VLA source is
detected by Herschel at all five bands. Again the Herschel
colours imply a low redshift. The optical-NIR counterpart photometric redshift
suggests  (Tanaka et al. 2010). Both redshift estimates
exclude DKB14 from being a protocluster member.
(Tanaka et al. 2010). Both redshift estimates
exclude DKB14 from being a protocluster member.
SMM J114054.3−262800 (DKB15, P) –
 away from the nominal LABOCA position we
find a tentative HAE association with
away from the nominal LABOCA position we
find a tentative HAE association with  . We
detect two PACS 160 μm counterparts (one classified as secure and the other
is not secure) that are separated by only
. We
detect two PACS 160 μm counterparts (one classified as secure and the other
is not secure) that are separated by only  , which are undetected at PACS 100
μm. The
secure PACS 160 μm counterpart seems to be physically associated with
the HAE. No other SMG in our sample has two PACS counterparts and no such system was seen in
GOODS-N (Dannerbauer et al. 2010). At the edge of the
PACS 160 μm
beams, we find the candidate Lyα emitters L877 (Kurk
et al. 2004a). However, this LAE lies at zspec = 0.863 (Croft et al. 2005). The FIR photometric analysis (Fig. 3) does not exclude z = 2.2 as a possible FIR
photometric redshift for the HAE.
, which are undetected at PACS 100
μm. The
secure PACS 160 μm counterpart seems to be physically associated with
the HAE. No other SMG in our sample has two PACS counterparts and no such system was seen in
GOODS-N (Dannerbauer et al. 2010). At the edge of the
PACS 160 μm
beams, we find the candidate Lyα emitters L877 (Kurk
et al. 2004a). However, this LAE lies at zspec = 0.863 (Croft et al. 2005). The FIR photometric analysis (Fig. 3) does not exclude z = 2.2 as a possible FIR
photometric redshift for the HAE.
SMM J114102.7−262746 (DKB16, YES)– this source has a wide multiwavelength coverage. Pentericci et al. (2002) report X-ray emission for this source (X16), Kurk et al. (2004a) selected this source as LAE candidate (L778) and it is detected at 1.4 GHz. Subsequent rest-frame UV-spectroscopy by Croft et al. (2005) reveal both the redshift zspec = 2.149 and the AGN nature of this source. An Hα line was detected at z = 2.154 by Kurk et al. (in prep) and the width of the Hα line is consistent with the AGN nature of this source. The velocity offset between the Lyα and Hα line is +476 km s-1 which is typical for LAEs and LBGs (Shapley et al. 2003) indicating gas outflow from this source.
Redshifts, star formation rates and results of the FIR SED fitting of the 870 μm LABOCA sources in the field around MRC1138−256.
6. Characteristics of the LABOCA overdensity
6.1. Previous SCUBA observations
Stevens et al. (2003) observed a small field of ~2′ diameter centered on MRC1138−262 with SCUBA and report four detections including the radio galaxy. They reported a higher source density than expected from blank fields (by one source). However, we only recover two of these sources with our LABOCA observations, which are at a very similar wavelength to the SCUBA observations. The other two SCUBA sources are fainter (S850 μm = 3.1 and 2.2 mJy) than the 3σ detection limit of ~4 mJy at this part of our LABOCA map. The fluxes of our two LABOCA sources, the radio galaxy and DKB02, are consistent with the ones obtained from the SCUBA observations. In addition, we do not find the proposed alignment between HzRG radio axis and bright submillimeter companions.
However, similar to Stevens et al. (2003), we find that the LABOCA emission of MRC1138−262 is spatially extended. Seymour et al. (2012) find that this extension consists of four galaxies detected by Spitzer, two of them are spectroscopically identified to lie at the same redshift (Kurk et al. 2004b), cf. with Ivison et al. (2008, 2012). 30′′ west of the radio galaxy, Emonts et al. (2013) report CO(1–0) emission at 3.7σ significance associated with the spectroscopically confirmed Hα emitter #229 at z = 2.149 (Kurk et al. 2004b) – Koyama et al. (2013a) also select this source as Hα emitter. This cold molecular gas reservoir is now confirmed through very recent ATCA observations (Emonts, priv. comm.). This CO-bright HAE lies 8.1′′ south-east away from the nominal SCUBA position of source #3 (Stevens et al. 2003), see Fig. 7. Below the published SCUBA source, we see dust emission at low level in the SCUBA map (see Fig. 1 in Stevens et al. 2003). SPIRE emission, coincident with the position of HAE229, lies in between the northern and southern components and seems to be related to the extended LABOCA emission of the HzRG. We speculate that the northern and southern components are one submm source but due to the chopper throw used in the SCUBA observations, negative flux from the central HzRG was added right on the source, cutting it into two and artificially reducing the total flux. HAE229 is detected at PACS 160 μm and at all three SPIRE bands (see Table 4) and we derive a FIR photometric redshift zFIR = 1.8 ± 0.5 assuming the total SCUBA flux of SCUBA source #3 is S850 μm = 2.2 ± 1.4 mJy (Stevens et al. 2003). However, we note that the true amount of submm emission at 850 μm is uncertain and only deeper and higher resolution observations will reveal the true configuration of this source in the submm window. We conclude that the CO-bright HAE229 is an SMG related to the protocluster at z ≈ 2.2. However, as this source is not detected by our LABOCA observations as a single source we will exclude it in the forthcoming discussion. The extended LABOCA emission of MRC1138−262 suggests that most probably, the LABOCA emission of HAE229 is blended with the one of the radio galaxy.
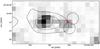 |
Fig. 7 Environment of the radio galaxy MRC1138. SPIRE 250 μm is shown in greyscale. The black contours are the (extended) LABOCA emission of the radio galaxy, indicating levels at 2.0, 4.0 and 6.0 mJy/beam. The circles with a diameter of 16′′ (the FWHM of SCUBA) indicate SCUBA emission (Stevens et al. 2003). The red contours show the location of the CO(1–0) emission (Emonts et al. 2013) associated to the spectroscopically confirmed Hα emitter # 229 at z = 2.15 (Kurk et al. 2004b). The CO levels are 0.134 and 0.168 mJy/beam. |
6.2. Lyα emitting counterparts to LABOCA sources
Besides MRC1138−262, three SMGs (DKB12, DKB15 and DKB16) are associated with LAEs. In two cases (DKB12d and DKB16), the LAE has been confirmed by Hα spectroscopy (Kurk et al., in prep.). This result is in contrast to the work by De Breuck et al. (2004) on the protocluster around the z = 4.1 radio galaxy TN J1338−1942 who reported no associations of confirmed LAEs with SMGs. However, this discrepancy could be explained thereby that both LAEs have been selected as HAEs (Koyama et al. 2013a) and DKB12 is even seen at PACS wavelengths (cf. Oteo et al. 2012, PACS detection of 2/72 LAEs between z = 2.0−3.5).
6.3. Hα emitting counterparts to LABOCA sources
As discussed in Sect. 3.4 we find six out of 11 SMGs covered by Hα imaging at z ≈ 2.2 are associated with HAEs. We search the literature for Hα surveys of fields containing SMGs at the redshift of the survey and find Hα narrow band observations of the SSA 13 field at z ≈ 2.23, which included two SMGs at the probed redshift range (Matsuda et al. 2011). None of the two SMGs were selected as HAEs with fluxes greater than f(Hα) ≈ 1.0-16 erg s-1 cm-2. The flux limit of the Koyama et al. (2013a) data is f(Hα) ≈ 3.0-17 erg s-1 cm-2. Approximately 50% of the HAEs associated to SMGs in the MRC 1138-262 field would be missed if the Koyama et al. (2013a) Hα images were of a similar depth to the Matsuda et al. (2011) data.
All SMGs with HAEs counterparts beside one (DKB16) have a large discrepancy between the SFR derived from Hα and from the FIR indicating these sources are highly dust-obscured (consistent with Swinbank et al. 2004). It may demonstrate that a large amount of star formation activity is missed when using the Hα line as a SFR indicator (see also Koyama et al. 2010). The Hα derived SFR (based on the narrow-band imaging by Koyama et al. 2013a and corrected for [NII] contamination and dust extinction following Koyama et al. 2013a) ranges between ~30 to 300 M⊙ yr-1 for all beside one source (DKB16, SFRHα = 1140 M⊙ yr-1) whereas the SFR derived from our IR observations ranges between 300 to 1800 M⊙ yr-1.
Fluxes of the CO-bright Hα emitter #229.
In Fig. 8, we investigate the relation between the stellar mass (derived from rest-frame R-band magnitudes, see Koyama et al. 2013a, for more details) and the star formation rate (derived from the Hα line) for the complete sample of HAEs discovered in the field of MRC1138−262. In addition, we show the location of HAEs counterparts of LABOCA sources that are protocluster members. There seems to be a weak trend that the HAEs associated with LABOCA sources are more massive and have higher SFRs than the overall population of HAEs in the field of the radio galaxy. In addition, we derive SFRs based on the FIR measurements for LABOCA sources selected as HAEs and reveal that these sources (FIR bright HAEs) are off the star-formation main sequence for z ~ 2 galaxies (Daddi et al. 2007; Santini et al. 2009).
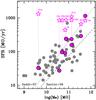 |
Fig. 8 Stellar mass vs. star formation rate (derived from the Hα line) for the complete sample of HAEs (grey dots) discovered in the field of MRC1138−262 (Koyama et al. 2013a). Only DKB07 and DKB08a are excluded as the estimates of the stellar mass of the associated HAEs are unreliable. The pink dots indicate the HAEs located within the LABOCA beam aperture for all LABOCA source. The SFR based on the FIR measurements is shown as open pink stars (connected with dotted lines). The FIR measurements reveal that FIR bright HAEs (LABOCA sources) are off the star-formation main sequence for z ~ 2 galaxies (Daddi et al. 2007; Santini et al. 2009). |
6.4. Large scale structure traced by SMGs at z = 2.2
We compare the number counts of the MRC1138−262 field with APEX LABOCA blank field observations of the LESS survey (Weiß et al. 2009), extracting sources with a significance level above 3.7σ (the extraction limit of the LESS survey) in our data. We detect six sources with at least 3.7σ and fluxes greater than 7.0 mJy in our map (DKB01, DKB02, DKB03, DKB05, DKB09, DKB11). The size of the map with a maximum noise of 1.9 mJy is 56 arcmin2, yielding an estimated surface density of 0.107 arcmin-2. According to the number counts derived by Weiß et al. (2009), we expect a surface density down to the flux level of 7 mJy of 0.028 arcmin-2. However, we should take into account the fact that the LESS field could be underdense compared to previous submm surveys (e.g., Weiß et al. 2009; Wardlow et al. 2011) down to S850 μm ≳ 3 mJy by a factor of two. Thus the source density in the MRC1138−262 field is approximately two (to four) times higher than expected.
We compare the differential source counts for our sources with S850 μm ≳ 7 mJy to those in the ECDFS (Weiß et al. 2009) and corrected (multiplied) by the “underdense factor” of two (see Swinbank et al. 2014, for this approach). We find that we can fit the differential source counts in our field very well with the curves fitted to the ECDFS counts, as provided by Weiß et al. (2009), normalised by a factor 3.8. This implies that over the (small) range of source fluxes probed by our map, we consistently find a 3.8 times higher density as compared to a blank field.
To understand how unusual the collection of SMGs found in the field of MRC1138−262 is, we compared it with the spatial distribution of sources in the ECDFS (Weiß et al. 2009). We count the number of S850> 7 mJy sources within 10 000 randomly placed circles each having a radius of 4.22′ (i.e., an area of 56 arcmin2) in the ECDFS. The most common number of sources found is one (40%), followed by zero (33%). The highest number of sources found is six, and 95% of the regions contain four sources or fewer. This means that the surface density we measure in the field of MRC1138−262 is unusually high and we cannot find a similarly dense field in the entire ECDFS (almost 900 square arcmin).
To summarize, a comparison of the number counts suggests that we have detected a significant excess of SMGs in the field of MRC1138−262. However, is this overdensity connected to the protocluster structure at z ≈ 2.2? In the following we discuss the evidence that the discovered overdensity is indeed associated with the protocluster at z ≈ 2.2. Including the radio galaxy, five of the 16 SMGs (DKB01, DKB03, DKB07, DKB12, DKB16) are spectroscopically confirmed members of the protocluster at z ≈ 2.2. A further two SMGs (DKB02, DKB15) have photometric redshifts that suggest they could be protocluster members. Our data excludes possible protocluster membership for three sources (DKB06, DKB13, DKB14). For the remaining six sources (DKB04, DKB05, DKB08, DKB09, DKB10, DKB11), we cannot make a judgement on protocluster membership based on the data in hand. At least seven and up to 13 SMGs belong to the protocluster at z ≈ 2.2.
All six spectroscopically confirmed SMG members of the protocluster structure at z ≈ 2.2 – five LABOCA sources plus the CO-bright HAE associated with SCUBA emission – are located within a circle of 240′′ diameter, corresponding to 2.0 Mpc. In addition, both of the possible members, DKB02 and DKB15 also lie within this area. Calculating the surface density in this area as before (three sources fulfilling the flux density limit of 7.0 mJy and detection level of 3.7σ (following Weiß et al. 2009), two of them are spectroscopically confirmed protocluster members), we derive a surface density of 0.239 arcmin-2, a factor of 4.3 higher than expected in a blank field at this wavelength.
Assuming a sphere of 2 Mpc, we calculate a SFRD of ~1500 M⊙ yr-1 Mpc-3 which is four orders of magnitude greater than the global SFRD at this redshift (Hopkins & Beacom 2006). The SFRD of our protocluster is similar to results obtained by Clements et al. (2014) for two clumps of HerMES sources at z = 2.
The detection of an overdensity of SMGs at z ≈ 2.2 is consistent with the overdensity of Herschel SPIRE 500 μm sources found by Rigby et al. (2014). We note that none of our LABOCA sources are located in the region where Valtchanov et al. (2013) reported an excess of SPIRE 250 μm sources at 5σ at a similar redshift 7′ south of the protocluster structure. Several groups have previously found excesses of SMGs near HzRGs and QSOs (e.g., Ivison et al. 2000; Stevens et al. 2003; De Breuck et al. 2004; Greve et al. 2007; Priddey et al. 2008; Stevens et al. 2010; Carrera et al. 2011). In comparison to our work, none of them have direct probes that a significant fraction of their sources also lie at the redshift of the targeted HzRG or QSO.
 |
Fig. 9 Location of 16 SMGs extracted from our LABOCA map of the field of MRC1138 on top of the LABOCA signal-to-noise map. Blue squares represent spectroscopically confirmed membership to the protocluster structure at z ≈ 2.2. The blue star is the SCUBA source at z = 2.149, also detected in CO(1–0) by Emonts et al. (2013). Cyan pentagons show possible protocluster members. In the case of yellow circles, no reliable judgment on the cluster membership can be made. Red crosses are sources that can be securely excluded from the protocluster. The large circle has a diameter of ~240′′ (corresponding to a physical size 2 Mpc) and shows the region where all eight SMGs at z = 2.2 are located. The SMG overdensity is at least a factor four higher than compared to blank fields (Weiß et al. 2009) and not centered on the radio galaxy MRC1138 (DKB07). The spatial distribution of the SMG overdensity seems to be similar to the north-east and south-east filament-like structure traced by HAEs (plus symbols Kurk et al. 2004b; Koyama et al. 2013a) and in contrast to the location of passive quiescent galaxies clustered within 0.5 Mpc around the radio galaxy (red circles, filled if spectroscopically confirmed, see Tanaka et al. 2013). In addition, we show the fields of view of our Spitzer IRAC/MIPS, VLT FORS and Subaru MOIRCS datasets. North is at the top and east is to the left. |
Blain et al. (2004) report an association of five sources in the HDF-North. All five SMGs have spectroscopically measured redshifts of z = 1.99 (see also Chapman et al. 2009). This is the largest blank field SMG association known so far. It is spatially distributed on a larger region on the sky than the MRC1138−262 group, spanning a region of 7′ (~3.5 Mpc) on a side. Chapman et al. (2009) report an apparently less significant overdensity of UV-selected galaxies at the same redshift and region of the sky. Another association of three SMGs lies in the same field but at z ≈ 4.0 (Daddi et al. 2009a,b). To summarize, the protocluster at z ≈ 2.2 is securely traced by galaxy populations probing different mass ranges, star formation and degree of obscuration including LAEs, HAEs, EROs and SMGs in the protocluster. Rigby et al. (2014) observe several known protocluster structures with SPIRE but do not recover SMG overdensities for many of them. On average they detect more SPIRE sources than compared to a blank field, and they detect an overdensity of SPIRE 500 μm sources in the MRC1138−262 field. Focusing on HyLIRGs selected from Herschel wide field imaging, Ivison et al. (2013) discovered a cluster of star-bursting proto-ellipticals at z = 2.41. Smail et al. (2014) related 31 FIR-/submm-selected sources to the z = 1.62 cluster Cl0218.3−0510. Contrarily, Beelen et al. (2008) report APEX LABOCA observations of the J2142−4423 Lyα protocluster at z = 2.38 and do not find an excess of SMGs in this field. Similarly, Herschel SPIRE observations by Wylezalek et al. (2013) do not confirm the previously reported SMG overdensity in the field of 4C+41.17 (Ivison et al. 2000). Overall, there is significant evidence both from our work and from the literature that the detection of large scale structures in the early universe by FIR/submm observation are feasible but still not common.
Koyama et al. (2013a) find a clustering of HAEs around the radio galaxy MRC1138−262 and report a large filament from north-east to south-west (≳10 Mpc); a part of this filament was seen in the data of Kurk et al. (2004b). The SMGs belonging to the protocluster at z ≈ 2.2 are distributed within the north-east filament (Kurk et al. 2004b; Koyama et al. 2013a) and the possible extension to the south-east (Koyama et al. 2013a) but not within the filament towards the south-west. However, due to the low number statistic, we cannot make a firm statement if the cosmic web could be traced by our SMGs. Our SMG overdensity is not centered on the radio galaxy, which lies at the western edge of the SMG concentration (see Fig. 9). A radial source density analysis strengthens this finding. This is in contrast to the four passive quiescent galaxies which cluster within 0.5 Mpc of the radio galaxy (Tanaka et al. 2013). The following hypothesis could explain these findings: both populations are massive but those in the centre have lost their gas; those that are still infalling have gas and are possibly being disturbed which makes them more active (see e.g. Verdugo et al. 2012, for details on this kind of scenario at low redshift). The HAE and SMG centres seem to be inconsistent, see Fig. 9. This finding is similar to that of Koyama et al. (2013b) for a cluster at z = 0.4 where a higher SFR is measured by the IR in the cluster center whereas the SFR derived from Hα is similar to that of the field. Their conclusion is that the dust extinction in galaxies in high density regions is higher than those in the field, at the same redshift.
7. Conclusions
We have mapped the field of MRC1138−262 (~140 arcmin2) with APEX LABOCA at 870 μm. This field has an exquisite multiwavelength dataset, close in quality to the ECDFS, including optical-NIR (VLT and Subaru), Herschel PACS and SPIRE, Spitzer IRAC, MIPS 24 μm, and deep HST and VLA 1.4 GHz imaging, as well as VLT FORS2, ISAAC and SINFONI spectroscopy of protocluster members.
-
In total, we detected 16 SMGs – 12 solid 3.5σ and 4 cross-identified tentative detections – with flux densities in the range 3–11 mJy. This is approximately a factor up to four more than expected from blank field surveys such as LESS (Weiß et al. 2009), – based on six sources with S870 μm> 7 mJy and >3.7σ significance level. This excess is consistent with the excess of SPIRE 500 μm sources found by Rigby et al. (2014) at larger scales.
-
Based on VLA 1.4 GHz, Herschel, Spitzer MIPS and Subaru rest-frame Hα imaging at z ~ 2.2, we have identified the counterparts of the LABOCA sources and derived reliable FIR photometric redshifts. 55% of the SMGs with z ≈ 2.2 Hα imaging coverage are associated with HAEs. NIR spectroscopic observations with VLT ISAAC and SINFONI have confirmed redshift to be z = 2.16 for four of these SMG counterparts. Including the radio galaxy, five out of 16 SMGs are secure protocluster members at z ≈ 2.2. Another two SMGs have photometric redshifts suggesting that they are possible protocluster members. Our data excludes the protocluster membership for three SMGs. For the remaining six SMGs we do not have enough data to make a robust judgement on their protocluster membership.
-
We associate the spectroscopically confirmed HAE229 (Kurk et al. 2004b) at z = 2.149, recently detected in CO(1–0) Emonts et al. (2013), with a SCUBA source (Stevens et al. 2003). This source is detected in Herschel bands and the FIR photo-z is consistent with its spectroscopic redshift. Thus, we conclude that this CO-bright HAE is an SMG related to the protocluster at z ≈ 2.2, increasing the number of spetroscopically confirmed SMGs as protocluster members to six.
-
All six spectroscopically confirmed members of the protocluster structure at z ≈ 2.2 are located within a circle of ~240′′ diameter, corresponding to 2.0 Mpc at this redshift. Both of the possible members, DKB02 and DKB15, also lie within this area. The excess of SMGs in this region is at least four times higher than expected from blank fields. For comparison, the surface density of LABOCA sources is significantly higher than the well known structure of six SMGs at z = 1.99 in GOODS-N distributed over 7 × 7 Mpc2 (Blain et al. 2004; Chapman et al. 2009). The SMG overdensity is not centered on the radio galaxy, which lies at the edge of the dusty starburst concentration. The spatial distribution of the SMG overdensity seems to be similar to the north-east and south-east filament-like structure traced by HAEs (Kurk et al. 2004b; Koyama et al. 2013a). The SFRFIR of the LABOCA sources related to the protocluster ranges between 200 to 1800 M⊙ yr-1 and sums up to a star formation rate density SFRD ~1500 M⊙ yr-1 Mpc-3, four magnitudes higher than the global SFRD at this redshift in the field.
Our results demonstrate that submillimeter observations can reveal clusters of massive, dusty starbursts. We show that at submm wavelengths systematic and detailed investigations of distant clusters are possible. However, we emphasize that only sensitive subarcsecond resolution observations with ALMA will allow a complete characterization of the 16 SMGs discovered by LABOCA.
We note that if we used the Chabier IMF (Chabrier 2003) the SFRs would decrease by a factor of 1.8.
Acknowledgments
Based on observations made with ESO Telescopes at Chajnantor and Paranal under programme 084.A-1016(A), 083.F-0022, 088.A-0754(A) and 090.B-712(A). This work is based on observations with the APEX telescope. APEX is a collaboration between the Max-Planck-Institut für Radioastronomie, the European Southern Observatory, and the Onsala Observatory. We are very grateful to Ian Smail who encouraged us to carry out this project and gave helpful advice during the project. We are much obliged to instructive help by Bjorn Emonts regarding the CO(1–0) observations of HAE229. We would like to thank the APEX staff for their support during the observations and Chris Carilli for his help during the VLA data reduction. The National Radio Astronomy Observatory is a facility of the National Science Foundation operated under cooperative agreement by Associated Universities, Inc. We also acknowledge the contribution by the anonymous referee in clarifying a number of important points and thus improving this manuscript. We are grateful to Elaine Grubmann for proofreading. This publication is supported by the Austrian Science Fund (FWF). N.S. is supported by an ARC Future Fellowship. Herschel is an ESA space observatory with science instruments provided by European-led Principal Investigator consortia and with important participation from NASA. PACS has been developed by a consortium of institutes led by MPE (Germany) and including UVIE (Austria); KU Leuven, CSL, IMEC (Belgium); CEA, LAM (France); MPIA (Germany); INAF-IFSI/OAA/OAP/OAT, LENS, SISSA (Italy); IAC (Spain). This development has been supported by the funding agencies BMVIT (Austria), ESA-PRODEX (Belgium), CEA/CNES (France), DLR (Germany), ASI/INAF (Italy), and CICYT/MCYT (Spain). SPIRE has been developed by a consortium of institutes led by Cardiff University (UK) and including Univ. Lethbridge (Canada); NAOC (China); CEA, LAM (France); IFSI, Univ. Padua (Italy); IAC (Spain); Stockholm Observatory (Sweden); Imperial College London, RAL, UCL-MSSL, UKATC, Univ. Sussex (UK); and Caltech, JPL, NHSC, Univ. Colorado (USA). This development has been supported by national funding agencies: CSA (Canada); NAOC (China); CEA, CNES, CNRS (France); ASI (Italy); MCINN (Spain); SNSB (Sweden); STFC (UK); and NASA (USA).
References
- Amblard, A., Cooray, A., Serra, P., et al. 2010, A&A, 518, L9 [NASA ADS] [CrossRef] [EDP Sciences] [Google Scholar]
- Barger, A. J., Wang, W.-H., Cowie, L. L., et al. 2012, ApJ, 761, 89 [Google Scholar]
- Beelen, A., Omont, A., Bavouzet, N., et al. 2008, A&A, 485, 645 [NASA ADS] [CrossRef] [EDP Sciences] [Google Scholar]
- Best, P. N., Lehnert, M. D., Miley, G. K., & Röttgering, H. J. A. 2003, MNRAS, 343, 1 [NASA ADS] [CrossRef] [Google Scholar]
- Biggs, A. D., Ivison, R. J., Ibar, E., et al. 2011, MNRAS, 413, 2314 [Google Scholar]
- Blain, A. W., Smail, I., Ivison, R. J., Kneib, J.-P., & Frayer, D. T. 2002, Phys. Rep., 369, 111 [NASA ADS] [CrossRef] [Google Scholar]
- Blain, A. W., Chapman, S. C., Smail, I., & Ivison, R. 2004, ApJ, 611, 725 [NASA ADS] [CrossRef] [Google Scholar]
- Bolzonella, M., Miralles, J.-M., & Pelló, R. 2000, A&A, 363, 476 [NASA ADS] [Google Scholar]
- Carrera, F. J., Page, M. J., Stevens, J. A., et al. 2011, MNRAS, 413, 2791 [NASA ADS] [CrossRef] [Google Scholar]
- Casey, C. M. 2012, MNRAS, 425, 3094 [Google Scholar]
- Chabrier, G. 2003, PASP, 115, 763 [NASA ADS] [CrossRef] [Google Scholar]
- Chapman, S. C., Blain, A. W., Smail, I., & Ivison, R. J. 2005, ApJ, 622, 772 [NASA ADS] [CrossRef] [Google Scholar]
- Chapman, S. C., Blain, A., Ibata, R., et al. 2009, ApJ, 691, 560 [NASA ADS] [CrossRef] [Google Scholar]
- Clements, D., Braglia, F. G., Hyde, A. K., et al. 2014, MNRAS, 439, 1139 [Google Scholar]
- Croft, S., Kurk, J., van Breugel, W., et al. 2005, AJ, 130, 867 [NASA ADS] [CrossRef] [Google Scholar]
- Daddi, E., Dickinson, M., Morrison, G., et al. 2007, ApJ, 670, 156 [NASA ADS] [CrossRef] [Google Scholar]
- Daddi, E., Dannerbauer, H., Stern, D., et al. 2009a, ApJ, 694, 1517 [Google Scholar]
- Daddi, E., Dannerbauer, H., Krips, M., et al. 2009b, ApJ, 695, L176 [NASA ADS] [CrossRef] [Google Scholar]
- Dannerbauer, H., Lehnert, M. D., Lutz, D., et al. 2002, ApJ, 573, 473 [NASA ADS] [CrossRef] [Google Scholar]
- Dannerbauer, H., Lehnert, M. D., Lutz, D., et al. 2004, ApJ, 606, 664 [NASA ADS] [CrossRef] [Google Scholar]
- Dannerbauer, H., Daddi, E., Morrison, G. E., et al. 2010, ApJ, 720, L144 [NASA ADS] [CrossRef] [Google Scholar]
- De Breuck, C., Bertoldi, F., Carilli, C., et al. 2004, A&A, 424, 1 [NASA ADS] [CrossRef] [EDP Sciences] [Google Scholar]
- Dole, H., Lagache, G., Puget, J.-L., et al. 2006, A&A, 451, 417 [NASA ADS] [CrossRef] [EDP Sciences] [MathSciNet] [Google Scholar]
- Downes, A. J. B., Peacock, J. A., Savage, A., & Carrie, D. R. 1986, MNRAS, 218, 31 [NASA ADS] [CrossRef] [Google Scholar]
- Emonts, B. H. C., Feain, I., Röttgering, H. J. A., et al. 2013, MNRAS, 430, 3465 [NASA ADS] [CrossRef] [Google Scholar]
- Fomalont, E. B., Kellermann, K. I., Cowie, L. L., et al. 2006, ApJS, 167, 103 [NASA ADS] [CrossRef] [Google Scholar]
- Fu, H., Jullo, E., Cooray, A., et al. 2012, ApJ, 753, 134 [NASA ADS] [CrossRef] [Google Scholar]
- Galametz, A., Vernet, J., De Breuck, C., et al. 2010, A&A, 522, A58 [NASA ADS] [CrossRef] [EDP Sciences] [Google Scholar]
- Galametz, A., Stern, D., De Breuck, C., et al. 2012, ApJ, 749, 169 [NASA ADS] [CrossRef] [Google Scholar]
- Genzel, R., Baker, A. J., Tacconi, L. J., et al. 2003, ApJ, 584, 633 [NASA ADS] [CrossRef] [Google Scholar]
- Greve, T. R., Bertoldi, F., Smail, I., et al. 2005, MNRAS, 359, 1165 [NASA ADS] [CrossRef] [Google Scholar]
- Greve, T. R., Stern, D., Ivison, R. J., et al. 2007, MNRAS, 382, 48 [NASA ADS] [CrossRef] [Google Scholar]
- Griffin, M. J., Abergel, A., Abreu, A., et al. 2010, A&A, 518, L3 [Google Scholar]
- Hainline, L. J., Blain, A. W., Smail, I., et al. 2009, ApJ, 699, 1610 [NASA ADS] [CrossRef] [Google Scholar]
- Hatch, N. A., De Breuck, C., Galametz, A., et al. 2011a, MNRAS, 410, 1537 [NASA ADS] [Google Scholar]
- Hatch, N. A., Kurk, J. D., Pentericci, L., et al. 2011b, MNRAS, 415, 2993 [NASA ADS] [CrossRef] [Google Scholar]
- Herranz, D., González-Nuevo, J., Clements, D. L., et al. 2013, A&A, 549, A31 [NASA ADS] [CrossRef] [EDP Sciences] [Google Scholar]
- Hickox, R. C., Wardlow, J. L., Smail, I., et al. 2012, MNRAS, 421, 284 [NASA ADS] [Google Scholar]
- Hodge, J. A., Karim, A., Smail, I., et al. 2013, ApJ, 768, 91 [NASA ADS] [CrossRef] [Google Scholar]
- Hopkins, A. M., & Beacom, J. F. 2006, ApJ, 651, 142 [NASA ADS] [CrossRef] [MathSciNet] [Google Scholar]
- Intema, H. T., Venemans, B. P., Kurk, J. D., et al. 2006, A&A, 456, 433 [NASA ADS] [CrossRef] [EDP Sciences] [Google Scholar]
- Ivison, R. J., Dunlop, J. S., Smail, I., et al. 2000, ApJ, 542, 27 [NASA ADS] [CrossRef] [Google Scholar]
- Ivison, R. J., Greve, T. R., Smail, I., et al. 2002, MNRAS, 337, 1 [NASA ADS] [CrossRef] [Google Scholar]
- Ivison, R. J., Morrison, G. E., Biggs, A. D., et al. 2008, MNRAS, 390, 1117 [NASA ADS] [CrossRef] [Google Scholar]
- Ivison, R. J., Smail, I., Amblard, A., et al. 2012, MNRAS, 425, 1320 [NASA ADS] [CrossRef] [Google Scholar]
- Ivison, R. J., Swinbank, A. M., Smail, I., et al. 2013, ApJ, 772, 137 [NASA ADS] [CrossRef] [Google Scholar]
- Jones, D. H., Read, M. A., Saunders, W., et al. 2009, MNRAS, 399, 683 [NASA ADS] [CrossRef] [Google Scholar]
- Karim, A., Swinbank, M., Hodge, J., et al. 2013, MNRAS, 432, 2 [NASA ADS] [CrossRef] [Google Scholar]
- Kennicutt, R. C., Jr. 1998, ApJ, 498, 541 [NASA ADS] [CrossRef] [Google Scholar]
- Koyama, Y., Kodama, T., Shimasaku, K., et al. 2010, MNRAS, 403, 1611 [NASA ADS] [CrossRef] [Google Scholar]
- Koyama, Y., Kodama, T., Tadaki, K.-i., et al. 2013a, MNRAS, 428, 1551 [CrossRef] [Google Scholar]
- Koyama, Y., Smail, I., Kurk, J., et al. 2013b, MNRAS, 434, 423 [NASA ADS] [CrossRef] [Google Scholar]
- Kovács, A. 2008, Proc. SPIE, 7020, 45 [NASA ADS] [Google Scholar]
- Kuiper, E., Hatch, N. A., Miley, G. K., et al. 2011, MNRAS, 415, 2245 [NASA ADS] [CrossRef] [Google Scholar]
- Kurk, J. D., Röttgering, H. J. A., Pentericci, L., et al. 2000, A&A, 358, L1 [NASA ADS] [Google Scholar]
- Kurk, J. D., Pentericci, L., Röttgering, H. J. A., & Miley, G. K. 2004a, A&A, 428, 793 [NASA ADS] [CrossRef] [EDP Sciences] [Google Scholar]
- Kurk, J. D., Pentericci, L., Overzier, R. A., Röttgering, H. J. A., & Miley, G. K. 2004b, A&A, 428, 817 [NASA ADS] [CrossRef] [EDP Sciences] [Google Scholar]
- Lagache, G., Puget, J.-L., & Dole, H. 2005, ARA&A, 43, 727 [NASA ADS] [CrossRef] [Google Scholar]
- Le Fevre, O., Deltorn, J. M., Crampton, D., & Dickinson, M. 1996, ApJ, 471, L11 [NASA ADS] [CrossRef] [Google Scholar]
- Lutz, D., Dunlop, J. S., Almaini, O., et al. 2001, A&A, 378, 70 [NASA ADS] [CrossRef] [EDP Sciences] [Google Scholar]
- Lutz, D., Poglitsch, A., Altieri, B., et al. 2011, A&A, 532, A90 [NASA ADS] [CrossRef] [EDP Sciences] [Google Scholar]
- Matsuda, Y., Yamada, T., Hayashino, T., et al. 2005, ApJ, 634, L125 [NASA ADS] [CrossRef] [Google Scholar]
- Matsuda, Y., Smail, I., Geach, J. E., et al. 2011, MNRAS, 416, 2041 [NASA ADS] [CrossRef] [Google Scholar]
- Mayo, J. H., Vernet, J., De Breuck, C., et al. 2012, A&A, 539, A33 [NASA ADS] [CrossRef] [EDP Sciences] [Google Scholar]
- Miley, G., & De Breuck, C. 2008, A&ARv, 15, 67 [NASA ADS] [CrossRef] [Google Scholar]
- Miley, G. K., Overzier, R. A., Zirm, A. W., et al. 2006, ApJ, 650, L29 [NASA ADS] [CrossRef] [Google Scholar]
- Morrison, G. E., Owen, F. N., Dickinson, M., Ivison, R. J., & Ibar, E. 2010, ApJS, 188, 178 [NASA ADS] [CrossRef] [Google Scholar]
- Moshir, M., et al. 1990, IRAS Faint Source Catalogue, version 2.0 [Google Scholar]
- Napier, P., Thompson, A., & Ekers, R. 1983, Proc. IEEE, 71, 1295 [Google Scholar]
- Noble, A. G., Geach, J. E., van Engelen, A. J., et al. 2013, MNRAS, 436, L40 [NASA ADS] [CrossRef] [Google Scholar]
- Ouchi, M., Shimasaku, K., Okamura, S., et al. 2004, ApJ, 611, 685 [NASA ADS] [CrossRef] [Google Scholar]
- Oteo, I., Bongiovanni, A., Pérez García, A. M., et al. 2012, A&A, 541, A65 [NASA ADS] [CrossRef] [EDP Sciences] [Google Scholar]
- Overzier, R. A., Miley, G. K., Bouwens, R. J., et al. 2006, ApJ, 637, 58 [NASA ADS] [CrossRef] [Google Scholar]
- Pearson, E. A., Eales, S., Dunne, L., et al. 2013, MNRAS, 435, 2753 [NASA ADS] [CrossRef] [Google Scholar]
- Pentericci, L., Kurk, J. D., Röttgering, H. J. A., et al. 2000, A&A, 361, L25 [NASA ADS] [Google Scholar]
- Pentericci, L., Kurk, J. D., Carilli, C. L., et al. 2002, A&A, 396, 109 [NASA ADS] [CrossRef] [EDP Sciences] [Google Scholar]
- Perault, M., 1987, Structure et évolution des nuages moléculaires, Ph.D. Thesis, Univ. Paris, France [Google Scholar]
- Pilbratt, G. L., Riedinger, J. R., Passvogel, T., et al. 2010, A&A, 518, L1 [CrossRef] [EDP Sciences] [Google Scholar]
- Poglitsch, A., Waelkens, C., Geis, N., et al. 2010, A&A, 518, L2 [NASA ADS] [CrossRef] [EDP Sciences] [Google Scholar]
- Polletta, M., Tajer, M., Maraschi, L., et al. 2007, ApJ, 663, 81 [NASA ADS] [CrossRef] [Google Scholar]
- Pope, A., Scott, D., Dickinson, M., et al. 2006, MNRAS, 370, 1185 [NASA ADS] [CrossRef] [Google Scholar]
- Priddey, R. S., Ivison, R. J., & Isaak, K. G. 2008, MNRAS, 383, 289 [NASA ADS] [CrossRef] [Google Scholar]
- Rigby, E., Hatch, N., Röttgering, H., et al. 2014, MNRAS, 437, 1882 [NASA ADS] [CrossRef] [Google Scholar]
- Roseboom, I. G., Ivison, R. J., Greve, T. R., et al. 2012, MNRAS, 419, 2758 [NASA ADS] [CrossRef] [Google Scholar]
- Santini, P., Fontana, A., Grazian, A., et al. 2009, A&A, 504, 751 [NASA ADS] [CrossRef] [EDP Sciences] [Google Scholar]
- Seymour, N., Altieri, B., De Breuck, C., et al. 2012, ApJ, 755, 146 [NASA ADS] [CrossRef] [Google Scholar]
- Shapley, A. E., Steidel, C. C., Pettini, M., & Adelberger, K. L. 2003, ApJ, 588, 65 [NASA ADS] [CrossRef] [Google Scholar]
- Shimakawa, R., Kodama, T., Tadaki, K.-i., et al. 2014, MNRAS, 441, L1 [NASA ADS] [CrossRef] [Google Scholar]
- Siringo, G., Kreysa, E., Kovács, A., et al. 2009, A&A, 497, 945 [NASA ADS] [CrossRef] [EDP Sciences] [Google Scholar]
- Skibba, R. A., Engelbracht, C. W., Dale, D., et al. 2011, ApJ, 738, 89 [NASA ADS] [CrossRef] [Google Scholar]
- Smail, I., Ivison, R. J., & Blain, A. W. 1997, ApJ, 490, L5 [NASA ADS] [CrossRef] [Google Scholar]
- Smail, I., Swinbank, A. M., Ivison, R. J., & Ibar, E. 2011, MNRAS, 414, L95 [NASA ADS] [CrossRef] [Google Scholar]
- Smail, I., Geach, J. E., Swinbank, A. M., et al. 2014, ApJ, 782, 19 [NASA ADS] [CrossRef] [Google Scholar]
- Spergel, D. N., Verde, L., Peiris, H. V., et al. 2003, ApJS, 148, 175 [NASA ADS] [CrossRef] [Google Scholar]
- Spergel, D. N., Bean, R., Doré, O., et al. 2007, ApJS, 170, 377 [NASA ADS] [CrossRef] [Google Scholar]
- Steidel, C. C., Adelberger, K. L., Dickinson, M., et al. 1998, ApJ, 492, 428 [NASA ADS] [CrossRef] [Google Scholar]
- Stern, D., Jimenez, R., Verde, L., Kamionkowski, M., & Stanford, S. A. 2010, J. Cosmology Astropart. Phys., 2, 8 [Google Scholar]
- Stevens, J. A., Ivison, R. J., Dunlop, J. S., et al. 2003, Nature, 425, 264 [NASA ADS] [CrossRef] [PubMed] [Google Scholar]
- Stevens, J. A., Jarvis, M. J., Coppin, K. E. K., et al. 2010, MNRAS, 405, 2623 [NASA ADS] [Google Scholar]
- Swinbank, A. M., Smail, I., Chapman, S. C., et al. 2004, ApJ, 617, 64 [NASA ADS] [CrossRef] [Google Scholar]
- Swinbank, A. M., Simpson, J. M., Smail, I., et al. 2014, MNRAS, 438, 1267 [Google Scholar]
- Tanaka, M., De Breuck, C., Venemans, B., & Kurk, J. 2010, A&A, 518, A18 [NASA ADS] [CrossRef] [EDP Sciences] [Google Scholar]
- Tanaka, M., Toft, S., Marchesini, D., et al. 2013, ApJ, 772, 113 [NASA ADS] [CrossRef] [Google Scholar]
- Taylor, G., Carilli, C., & Perley, R. 1999, Synthesis Imaging in Radio Astronomy II, ASP Conf. Ser., 180 [Google Scholar]
- Valtchanov, I., Altieri, B., Berta, S. et al. 2013, MNRAS, 436, 2505 [NASA ADS] [CrossRef] [Google Scholar]
- Venemans, B. P., Kurk, J. D., Miley, G. K., et al. 2002, ApJ, 569, L11 [NASA ADS] [CrossRef] [Google Scholar]
- Venemans, B. P., Röttgering, H. J. A., Overzier, R. A., et al. 2004, A&A, 424, L17 [NASA ADS] [CrossRef] [EDP Sciences] [Google Scholar]
- Venemans, B. P., Röttgering, H. J. A., Miley, G. K., et al. 2005, A&A, 431, 793 [NASA ADS] [CrossRef] [EDP Sciences] [Google Scholar]
- Venemans, B. P., Röttgering, H. J. A., Miley, G. K., et al. 2007, A&A, 461, 823 [NASA ADS] [CrossRef] [EDP Sciences] [Google Scholar]
- Verdugo, M., Lerchster, M., Böhringer, H., et al. 2012, MNRAS, 421, 1949 [NASA ADS] [CrossRef] [Google Scholar]
- Walter, F., Decarli, R., Carilli, C., et al. 2012, Nature, 486, 233 [NASA ADS] [CrossRef] [Google Scholar]
- Wardlow, J. L., Smail, I., Coppin, K. E. K., et al. 2011, MNRAS, 415, 1479 [NASA ADS] [CrossRef] [Google Scholar]
- Webb, T. M., Eales, S. A., Lilly, S. J., et al. 2003a, ApJ, 587, 41 [NASA ADS] [CrossRef] [Google Scholar]
- Webb, T. M. A., Lilly, S. J., Clements, D. L., et al. 2003b, ApJ, 597, 680 [NASA ADS] [CrossRef] [Google Scholar]
- Weiß, A., Kovács, A., Coppin, K., et al. 2009, ApJ, 707, 1201 [NASA ADS] [CrossRef] [Google Scholar]
- Wylezalek, D., Vernet, J., De Breuck, C., et al. 2013, MNRAS, 428, 3206 [NASA ADS] [CrossRef] [Google Scholar]
- Younger, J. D., Fazio, G. G., Huang, J.-S., et al. 2007, ApJ, 671, 1531 [Google Scholar]
All Tables
Main properties of counterparts of the 870 μm LABOCA sources in the field arround MRC1138−256.
Redshifts, star formation rates and results of the FIR SED fitting of the 870 μm LABOCA sources in the field around MRC1138−256.
All Figures
|
Fig. 1 Pixel signal-to-noise values of our LABOCA map. The red solid line shows a Gaussian fit. The significant excess of pixels with a S/N ≥ 3σ is shown in grey. Almost all of these pixels belong to selected sources and none to pixels at the edge of the map. |
| In the text | |
|
Fig. 2 LABOCA signal map of the field around the high-z radio galaxy MRC1138−262 (#7). Encircled, we show the location of 16 SMGs extracted from our LABOCA map. Contours indicate the noise at 1.3, 1.9, 2.6, 3.0, 3.7, 5.2 and 7.4 mJy/beam. The dashed contour encompasses the region where the noise is σ< 3.0 mJy/beam, including all selected 16 LABOCA sources. The source density is up to 4× higher than in the ECDFS. North is at the top and east is to the left. |
| In the text | |
|
Fig. 3 SEDs of the submillimeter sources in the Spiderweb galaxy field. We show the best fitting hyperz template (dashed red line) and the best fit greybody curve (dotted blue line). Upper limits are indicated by blue arrows. Each plot reports on the spectroscopic redshift, if available, and gives the primary photo-z solution and the template used (in Table 3 the template number is defined). Based on this analysis, the protocluster membership of several sources has been verified. |
| In the text | |
|
Fig. 3 continued. |
| In the text | |
|
Fig. 4 Minimum χ2 as a function of redshift for the submillimeter sources in the Spiderweb galaxy field. Thick red arrows show the redshift of the primary solution of the photo-z fitting, thin red arrows show the redshift of the secondary solution and blue arrows spectroscopic redshifts. The grey dashed line indicates the redshift of the Spiderweb galaxy. |
| In the text | |
|
Fig. 4 continued. |
| In the text | |
|
Fig. 5 FIR photometric redshifts (grey filled histogram). Our FIR photometric analysis suggests that a significant fraction of the LABOCA sources are associated with the protocluster around the Spiderweb galaxy at z = 2.2. |
| In the text | |
|
Fig. 6 Postage stamps of all 16 LABOCA sources, including VLA 1.4 GHz, LABOCA 870 μm, SPIRE 250 μm, PACS 160 μm, MIPS 24 μm and MOIRCS z = 2.16 Hα images. The 40′′ × 40′′ images are centered on the nominal LABOCA position and orientated such that north is at the top and east is to the left. The large white circle represents the size of the LABOCA beam (~19′′ diameter). Small circles are VLA and/or HAE sources. Spectroscopic (S) and photometric (P) redshifts are labeled in the top of the Hα images. |
| In the text | |
|
Fig. 6 continued. |
| In the text | |
|
Fig. 7 Environment of the radio galaxy MRC1138. SPIRE 250 μm is shown in greyscale. The black contours are the (extended) LABOCA emission of the radio galaxy, indicating levels at 2.0, 4.0 and 6.0 mJy/beam. The circles with a diameter of 16′′ (the FWHM of SCUBA) indicate SCUBA emission (Stevens et al. 2003). The red contours show the location of the CO(1–0) emission (Emonts et al. 2013) associated to the spectroscopically confirmed Hα emitter # 229 at z = 2.15 (Kurk et al. 2004b). The CO levels are 0.134 and 0.168 mJy/beam. |
| In the text | |
|
Fig. 8 Stellar mass vs. star formation rate (derived from the Hα line) for the complete sample of HAEs (grey dots) discovered in the field of MRC1138−262 (Koyama et al. 2013a). Only DKB07 and DKB08a are excluded as the estimates of the stellar mass of the associated HAEs are unreliable. The pink dots indicate the HAEs located within the LABOCA beam aperture for all LABOCA source. The SFR based on the FIR measurements is shown as open pink stars (connected with dotted lines). The FIR measurements reveal that FIR bright HAEs (LABOCA sources) are off the star-formation main sequence for z ~ 2 galaxies (Daddi et al. 2007; Santini et al. 2009). |
| In the text | |
|
Fig. 9 Location of 16 SMGs extracted from our LABOCA map of the field of MRC1138 on top of the LABOCA signal-to-noise map. Blue squares represent spectroscopically confirmed membership to the protocluster structure at z ≈ 2.2. The blue star is the SCUBA source at z = 2.149, also detected in CO(1–0) by Emonts et al. (2013). Cyan pentagons show possible protocluster members. In the case of yellow circles, no reliable judgment on the cluster membership can be made. Red crosses are sources that can be securely excluded from the protocluster. The large circle has a diameter of ~240′′ (corresponding to a physical size 2 Mpc) and shows the region where all eight SMGs at z = 2.2 are located. The SMG overdensity is at least a factor four higher than compared to blank fields (Weiß et al. 2009) and not centered on the radio galaxy MRC1138 (DKB07). The spatial distribution of the SMG overdensity seems to be similar to the north-east and south-east filament-like structure traced by HAEs (plus symbols Kurk et al. 2004b; Koyama et al. 2013a) and in contrast to the location of passive quiescent galaxies clustered within 0.5 Mpc around the radio galaxy (red circles, filled if spectroscopically confirmed, see Tanaka et al. 2013). In addition, we show the fields of view of our Spitzer IRAC/MIPS, VLT FORS and Subaru MOIRCS datasets. North is at the top and east is to the left. |
| In the text | |
Current usage metrics show cumulative count of Article Views (full-text article views including HTML views, PDF and ePub downloads, according to the available data) and Abstracts Views on Vision4Press platform.
Data correspond to usage on the plateform after 2015. The current usage metrics is available 48-96 hours after online publication and is updated daily on week days.
Initial download of the metrics may take a while.