Fig. 3
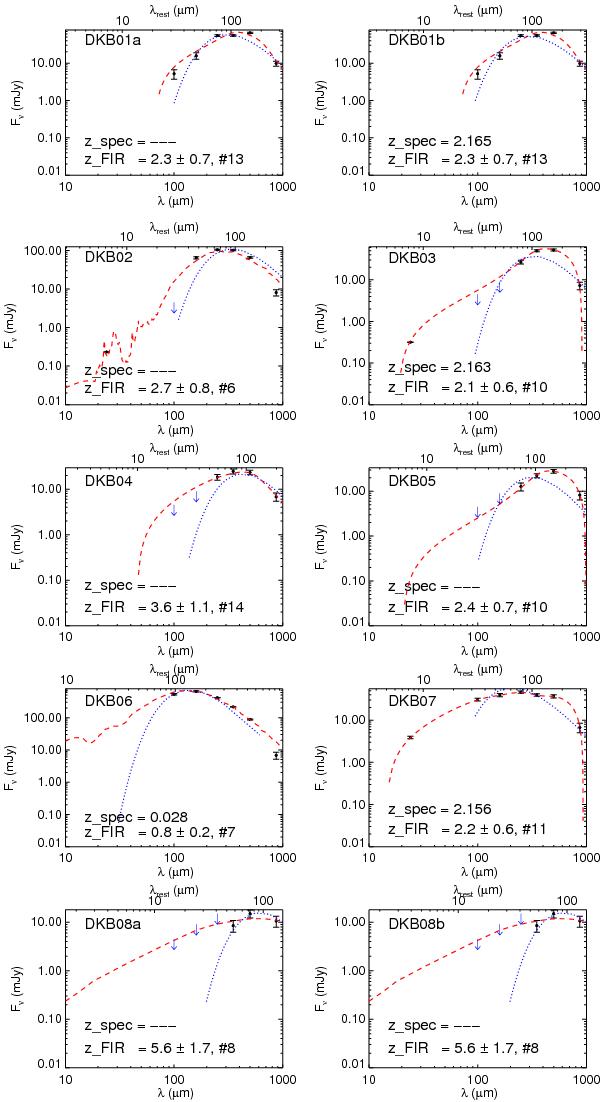
SEDs of the submillimeter sources in the Spiderweb galaxy field. We show the best fitting hyperz template (dashed red line) and the best fit greybody curve (dotted blue line). Upper limits are indicated by blue arrows. Each plot reports on the spectroscopic redshift, if available, and gives the primary photo-z solution and the template used (in Table 3 the template number is defined). Based on this analysis, the protocluster membership of several sources has been verified.
Current usage metrics show cumulative count of Article Views (full-text article views including HTML views, PDF and ePub downloads, according to the available data) and Abstracts Views on Vision4Press platform.
Data correspond to usage on the plateform after 2015. The current usage metrics is available 48-96 hours after online publication and is updated daily on week days.
Initial download of the metrics may take a while.