| Issue |
A&A
Volume 568, August 2014
|
|
|---|---|---|
| Article Number | A111 | |
| Number of page(s) | 13 | |
| Section | Interstellar and circumstellar matter | |
| DOI | https://doi.org/10.1051/0004-6361/201424076 | |
| Published online | 01 September 2014 | |
Photodissociation and chemistry of N2 in the circumstellar envelope of carbon-rich AGB stars
1 Leiden Observatory, Leiden University, PO Box 9513, 2300 RA Leiden, The Netherlands
e-mail: This email address is being protected from spambots. You need JavaScript enabled to view it.
2 Astrophysics Research Centre, School of Mathematics and Physics, Queen’s University Belfast, Belfast, BT7 1NN, UK
3 Max-Planck Institut für Extraterrestrische Physik (MPE), Giessenbachstr. 1, 85748 Garching, Germany
Received: 27 April 2014
Accepted: 23 June 2014
Abstract
Context. The envelopes of asymptotic giant branch (AGB) stars are irradiated externally by ultraviolet photons; hence, the chemistry is sensitive to the photodissociation of N2 and CO, which are major reservoirs of nitrogen and carbon, respectively. The photodissociation of N2 has recently been quantified by laboratory and theoretical studies. Improvements have also been made for CO photodissociation.
Aims. For the first time, we use accurate N2 and CO photodissociation rates and shielding functions in a model of the circumstellar envelope of the carbon-rich AGB star, IRC +10216.
Methods. We use a state-of-the-art chemical model of an AGB envelope, the latest CO and N2 photodissociation data, and a new method for implementing molecular shielding functions in full spherical geometry with isotropic incident radiation. We compare computed column densities and radial distributions of molecules with observations.
Results. The transition of N2→ N (also, CO → C → C+) is shifted towards the outer envelope relative to previous models. This leads to different column densities and radial distributions of N-bearing species, especially those species whose formation/destruction processes largely depend on the availability of atomic or molecular nitrogen, for example, CnN (n = 1, 3, 5), CnN− (n = 1, 3, 5), HCnN (n = 1, 3, 5, 7, 9), H2CN and CH2CN.
Conclusions. The chemistry of many species is directly or indirectly affected by the photodissociation of N2 and CO, especially in the outer shell of AGB stars where photodissociation is important. Thus, it is important to include N2 and CO shielding in astrochemical models of AGB envelopes and other irradiated environments. In general, while differences remain between our model of IRC +10216 and the observed molecular column densities, better agreement is found between the calculated and observed radii of peak abundance.
Key words: astrochemistry / molecular processes / methods: numerical / stars: AGB and post-AGB / circumstellar matter / stars: abundances
© ESO, 2014
1. Introduction
The asymptotic giant branch (AGB) is the last nuclear-burning phase for low- to intermediate-mass stars (from 0.8 M⊙ to ~8 M⊙), where the core of the star evolves into an inert and degenerate C-O core (Herwig 2005). AGB stars can be classified by the elemental C/O ratio, namely, C-rich AGB stars (C/O > 1), M-type AGB stars (C/O < 1) and S-type AGB stars (C/O ≈ 1). Our own Sun will become an M-type AGB star. Generally, the envelopes of C-rich stars contain CO plus C-bearing molecules, such as C2, CN, HCN, and C2H2, while O-rich stars contain CO plus O-bearing molecules such as H2O, TiO, and VO (Le Bertre 1997). AGB stars undergo considerable mass loss and eject dust and molecules into the surrounding regions, creating circumstellar envelopes (CSEs). These gas and dust envelopes eventually merge with the interstellar medium (ISM), enriching molecular clouds in which new stars may be born. Furthermore, CSEs are one of the richest sources for detecting new molecules. The study of AGB stars is of particular interest and importance for our understanding of molecular formation, destruction, and the recycling of material between star birth and star death. The schematic structure of the CSE of an AGB star is shown in Fig. 1.
IRC +10216 (CW Leonis), the brightest object in the sky at mid-infrared wavelengths outside the solar system, is the nearest C-rich AGB star and attracts intensive theoretical and observational study (e.g., Morris 1975; Bieging & Rieu 1988; Glassgold 1996; Mauron & Huggins 1999; Millar et al. 2000; Cernicharo et al. 2000; Woods et al. 2003; Cordiner & Millar 2009; De Beck et al. 2012; Agúndez et al. 2012; McElroy et al. 2013). More importantly, it is one of the richest molecular sources in the sky. To date, around 180 molecular species, not counting isotopologues, have been identified in the interstellar medium or CSEs1 while more than 80 of them have been detected in IRC +10216. Among these, more than 30 nitrogen-bearing species have been identified, including HCN, CN, SiN, PN, HNC, MgCN, NaCN, NH3, HC7N, and C5N−, amongst others (Wakelam et al. 2010). Even water, which was thought unlikely to form in C-rich AGB envelopes, has been detected here (Melnick et al. 2001; Decin et al. 2010). Some molecular detections in IRC +10216 were their first discoveries in astrophysical environments, for example, the first detection of the cyanide anion CN− (Agúndez et al. 2010), and FeCN (Zack et al. 2011).
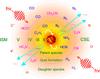 |
Fig. 1 Schematic structure of the CSE for a C-rich AGB star, which is divided into 6 regions for modelling purposes. (I): a degenerate C/O core and He/H burning shell; (II): a convective shell; (III): a stellar atmosphere in which parent species are formed; (IV): a dust formation shell with an expanding envelope; (V): an outer CSE where daughter species are formed primarily by photodissociation; (VI): the interstellar medium (ISM). This study focusses on the outer CSE where chemistry is mainly driven by the photodissociation of molecules. |
Most of the detected species in IRC +10216 are found in the cool, expanding outer CSE, where photodissociation processes dominate the destruction of molecules. The investigation of “key” reactions, which might affect the entire chemical network and therefore the comparison of simulations and observations, is an important topic. According to a systematic sensitivity study using a large chemical network, the reaction  (1)is one of the most significant reactions in the outer CSE, which directly affects the abundances of many N-bearing species, such as N, N2, HC2N, C3N, C3N− and C2N (Wakelam et al. 2010). Eq. (1) is the primary destruction route of N2 in any region where UV photons are present. From an observational point of view, the direct detection of N2 is very challenging because it has no permanent electric dipole and thus possesses no electric-dipole-allowed pure rotational spectrum. The only reported detection of molecular nitrogen is via its far-UV electronic transitions observed in the interstellar medium (Knauth et al. 2004). One can infer N2 indirectly through the protonated ion, N2H+ (Turner 1974; Herbst et al. 1977) or its deuterated form, N2D+. However, neither N2H+ nor N2D+ have been identified in IRC +10216. From the simulation point of view, Eq. (1) has usually not been treated properly in models because these have not included N2 self-shielding. The importance of self-shielding of molecules in CSEs was first noticed for CO some 30 years ago (Morris & Jura 1983). Even with an approximate treatment of CO self-shielding (the “one-band approximation”), much better agreement was obtained between simulations and observations.
Envelope parameters and assumptions for IRC +10216 in this study.
We here employ the latest reported photodissociation rate and shielding functions for N2 (Li et al. 2013; Heays et al. 2014) to investigate the effects in a chemical model of the CSE of IRC +10216. These are based on a concerted laboratory (e.g., Ajello et al. 1989; Helm et al. 1993; Sprengers et al. 2004; Stark et al. 2008; Lewis et al. 2008a; Heays et al. 2011) and theoretical (e.g., Spelsberg & Meyer 2001; Lewis et al. 2005; 2008b; Ndome et al. 2008) effort over the last two decades. An update was also made to the photodissociation of CO using the self-shielding functions from Visser et al. (2009) following a similarly large experimental effort over the past decades. While the absolute unshielded rates of both N2 and CO are changed only at the level of ~30% with respect to the previous values (van Dishoeck 1988), it is important to realize that the uncertainty in the photorates is reduced by an order of magnitude. Also, we develop and employ a new fully spherically-symmetric (SS) model that computes the self-shielding of molecules in an isotropic interstellar radiation field, rather than the usual plane-parallel (PP) geometry.
The paper is organised as follows: the CSE model, the improvements in N2 and CO photodissociation, as well as the theory and details for the evaluation of photodissociation rates for the SS model are described in Sect. 2. The results and discussion can be found in Sect. 3, followed by the concluding remarks in Sect. 4. The impact of these improvements on the molecular abundances in the CSE of IRC +10216 are discussed. Special attention is given to those species which have already been detected and those which may be detectable in the near future, e.g., using the Atacama Large Millimeter/submillimeter Array (ALMA). A full description of the SS model used for calculating the photodissociation rates of CO and N2, together with the proposed numerical methods for implementing molecular shielding functions, are included in Appendices A and B.
Initial abundances of parent species, relative to H2, at the inner radius.
2. Methods
2.1. CSE Model
The CSE model described in McElroy et al. (2013) was employed and extended in the present work. Specific details can be found in Millar et al. (2000) and Cordiner & Millar (2009). Improvements in the model are summarised in Sect. 2.2. The latest (fifth) release of the UMIST Database for Astrochemistry (UDfA), McElroy et al. (2013), hereafter RATE12, was adopted in all of the calculations. RATE12 contains 6173 gas-phase reactions involving 467 species. McElroy et al. (2013) tested this network in a dark cloud model and in a CSE model of IRC +10216 and compared the results with previous models and observations.
The main assumptions and key parameters adopted in our model of IRC +10216 are summarised in Table 1. Parent species that are injected at the inner radius of the envelope are listed in Table 2. The simulations start at the inner envelope with the following set of parameters: the radius, molecular hydrogen number density, visual extinction, and kinetic temperature of the gas are r1 = 1.0 × 1015 cm, n(H2) = 1.3 × 107 cm-3, AV = 13.8 mag, and T = 575 K, respectively. The outer radius of the envelope is set to rf = 7 × 1017 cm, where the density has decreased to n(H2) = 26 cm-3, the temperature to T = 10 K, and the visual extinction to AV = 0.02 mag. We pay particular attention to the chemistry in the outer CSE where photodissociation is an important process. For all photoreactions, species are destroyed by photons from all directions, i.e., the radiation field is isotropic. For IRC +10216, one has to only take into account photons that come from the interstellar medium. The star, with a temperature of ~2330 K (De Beck et al. 2012), is too cool to generate photons that could lead to the photodissociation of molecules.
2.2. What’s new
Our aim is to improve the treatment of N2 and CO photodissociation. In the work of McElroy et al. (2013), they employed the following parameters and methods:
-
(a)
Unshielded photodissociation rates
CO:2.0 × 10⁻¹⁰ s-1, from van Dishoeck (1988)
N2: 2.0 × 10⁻¹⁰ s-1, from van Dishoeck (1988)
-
(b)
Shielding functions
CO: dust + self-shielding, from Morris & Jura (1983), neither taking into account all lines for CO self-shielding nor shielding from H2
N2: dust shielding only
-
(d)
Method for implementing self-shielding functions
The “one-band approximation” (Morris & Jura 1983).
In this work, we employ the most accurate molecular data to date and develop a new method for implementing molecular shielding functions in the SS model:
-
(a)
Unshielded photodissociation rates
CO:2.6 × 10⁻¹⁰ s-1, 30% higher, from Visser et al. (2009)
N2: 1.65 × 10⁻¹⁰ s-1, 28% lower, from Li et al. (2013)
-
(b)
Shielding functions
CO: dust + self- + H + H2 shielding, from Visser et al. (2009)
N2: dust + self- + H + H2 shielding, from Li et al. (2013)
-
(c)
Method for implementing self-shielding functions
By iterating the calculations to get converged results for the column densities in spherical symmetry for an isotropic radiation field. Details of this method are described in Sect. 2.3 and Appendix B.
2.3. Photodissociation rate and shielding function
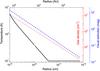 |
Fig. 2 Gas density, visual extinction, and gas temperature as functions of radius for the CSE of IRC +10216 from the center of the star towards the outside of the envelope. For clarity, the radius is given in units of “cm” and “AU”. |
The definitions of the photodissociation rate, k, unshielded rate, k0, and shielding function, Θ, appropriate for a plane-parallel model (only considering photons from the normal direction) are the same as those described in our recent paper (Li et al. 2013). In this work, we consider photons from all directions in space (SS model) for photoreactions that occur in the outer CSE. Suppose an incident ray, inclined with angle ϑ to the outward normal direction, arrives at a specific radius, ri. The total column density of H2 integrated from this point along the ray to infinity can be written as (Jura & Morris 1981; Morris & Jura 1983)  (2)This expression diverges for ϑ close to zero and π. In practice, the value of ϑ/ sinϑ equals 1 if ϑ = 0. For the case of ϑ = π, its value is obtained using a linear extrapolation from the preceding data points on our angular grid.
In the CSE of IRC +10216, most hydrogen is locked in H2 due to self-shielding. Thus, the corresponding visual extinction, AV(ri,ϑ), is  (3)with the conversion factor based on the observations of Bohlin et al. (1978) and Rachford et al. (2009). The photodissociation rates of most interstellar species are mainly attenuated by dust, which is characterised by dust shielding functions given by
 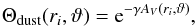 (4)where γ is the parameter used to estimate the increased dust extinction at ultraviolet wavelengths. In general, the contribution of a specific ray of interstellar photons to the overall photodissociation rate at ri may be calculated using
  (5)However, the photodissociation rates of N2, CO, and H2 are more complex due to self- and mutual-shielding by H, H2, CO, and other molecules (which are wavelength and column density dependent) and also continuum shielding by dust. A convenient way to take these effects into account in models is by use of molecular shielding functions that are calculated from high accuracy wavelength-dependent absorption cross sections. There is no need to consider H2 photodissociation in the current study because it is fully shielded everywhere in the CSE. For N2 and CO, one must consider self-shielding and mutual-shielding by H2. The photodissociation rate of N2 is calculated by
 ![Mathematical equation: \begin{equation} \label{eq:k_r_theta_mol} k_{{\rm N_2}} (r_i, \vartheta) = k^0_{\rm N_2} \Theta_{\rm dust}(r_i,\vartheta)~ \Theta_\text{mol}[N_{\text{H}_2}(r_i,\vartheta),N_{\text{N}_2}(r_i,\vartheta)]~~ \text{s}^{-1}, \end{equation}](/articles/aa/full_html/2014/08/aa24076-14/aa24076-14-eq54.png) (6)where
(6)where  is the unshielded photodissociation rate of N2, and NN2(ri,ϑ) is the column density of N2 at radius ri, integrated from this point along angle ϑ to infinity. Θmol [NH2(ri,ϑ),NN2(ri,ϑ)] is the molecular shielding function that is responsible for the multiple shielding effects caused by N2 (self-) and H2. It can be obtained via a bi-linear interpolation of N2 and H2 shielding functions that depend only on their column densities.
Correspondingly, the CO photodissociation rate is calculated using ![Mathematical equation: \begin{equation} \label{eq:k_r_theta_mol_CO} k_{\rm CO}(r_i, \vartheta) = k^0_{\rm CO} \Theta_{\rm dust}(r_i,\vartheta) \Theta_\text{mol}[N_{\text{H}_2}(r_i,\vartheta),N_{\text{CO}}(r_i,\vartheta)]~ \text{s}^{-1}, \end{equation}](/articles/aa/full_html/2014/08/aa24076-14/aa24076-14-eq58.png) (7)where
(7)where  is the CO unshielded photodissociation rate, and NCO(ri,ϑ) is the column density of CO at radius ri, integrated along angle ϑ to infinity. Atomic hydrogen can also shield N2 and CO, although in practice this is unimportant for the case of CSEs because the majority of hydrogen is locked in H2.
A full description of the SS model and the numerical method for the computation of N(ri,ϑ) can be found in Appendix A. The implementation of N2 and CO shielding functions in the SS model is not straightforward. This is because before starting the evolution of the chemistry, one needs to know in advance the abundances of N2 and CO at each radius to evaluate their column densities, and to compute the molecular shielding functions. However, these data are generated from the output of the model. One approximate solution is to assume that the N2 and CO number densities are a constant proportion of H2, which falls as r-2 (Jura & Morris 1981), then work out the corresponding column densities. This assumption is inaccurate in the photon-dominated regions where N2 and CO densities are no longer constant with respect to H2. In this study, we propose a new procedure which gives more accurate and convergent results by iterating the computation of the chemistry. This method is described in Appendix B.
The photodissociation of N2 and CO becomes considerable at the edge of the CSE, where the visual extinction is less than 1.0 mag and the temperature is around 10 K, as can be seen in Fig. 2. When calculating the N2 shielding functions, the excitation temperature for both H2 and N2 are chosen to be 10 K. The Doppler widths of N2, H2, and H are 0.2, 3, and 5 km s-1, respectively. The column density of atomic hydrogen is taken to be 1.0 × 1014 cm-2. For CO shielding, the excitation temperature for H2 and CO are chosen to be 11 and 5 K, respectively. At the low densities in the outer CSE, CO is subthermally excited. The Doppler widths of CO, H2, and H are 0.3, 3, and 5 km s-1. Electronic tables of the N2 and CO shielding functions are available online2. Note that these shielding functions were calculated by considering (H2, H, and self-) shielding at various temperatures for a few typical column densities. Shielding functions for other temperatures and column densities can be obtained by interpolation. In practice, the uncertainties in the shielding functions over a temperature variation of a few degrees are negligible, see Li et al. (2013). The parameter γ used to account for the dust extinction at ultraviolet wavelengths for N2 and CO was taken to be 3.9 and 3.5, respectively.
Finally, the radial photodissociation rate in a spherical geometry with isotropic incident radiation is evaluated by  (8)
(8)
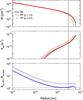 |
Fig. 3 N2 column densities (top), photodissociation rates (middle) and their ratios (bottom) when calculated using the plane-parallel (dashed lines: χ = 1.0; spheres: χ = 0.5) and spherically-symmetric (black solid lines) models as a function of radius. The dotted horizontal line indicates kpd(PP) = kpd(SS). Outside the solid vertical line N2 photodissociation becomes considerable. |
3. Results
3.1. Improvements in N2 and CO photodissociation
Figure 3 compares the calculated column densities and photodissociation rates for the spherically-symmetric and plane-parallel models. For the PP case, we consider photons from the radial direction only but the full shielding (dust + self- + H + H2) was included. The envelope was illuminated by a Draine (1978) field, extended to wavelengths longer than 2000 Å according to van Dishoeck & Black (1988) and with a scaling factor, χ. In the SS model, photons from all directions in space were considered with χ = 1 and the angular weighting scheme is given by Eq. (8). For the PP model, radiation from one side was taken into account explicitly with χ = 0.5 and radiation from the far side assumed completely attenuated. Hence, in the absence of the envelope the same unattenuated Draine (1978) radiation field is recovered as for the SS model. Indeed, for χ = 0.5, the N2 photodissociation rates in the SS and PP cases are very similar (middle panel Fig. 3), whereas when assuming χ = 1.0, the PP rate is up to a factor of two higher at the outer edge. As a result, the PP model with χ = 1.0 underestimates the N2 column density at this location, but the χ = 0.5 model results are very close to those of the SS model. The bottom panel of Fig. 3 shows that the PP and SS models start to deviate more in the inner envelope, where the PP model gives a much higher photodissociation rate. However, the absolute photodissociation rates are so small here that they are negligible in the chemistry. Overall, we conclude that for the CSE chemistry of IRC +10216, the PP model with a scaling factor of χ = 0.5 provides excellent agreement with the full SS model.
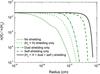 |
Fig. 4 Fractional abundance of N2, relative to H2, as a function of radius with different shielding effects. In all cases, photons are considered from all directions in space (in SS model). |
In the SS model the abundance of N2 is higher than that in the PP model in the outer envelope. The distribution of CO in the SS and PP models is similar to that for N2, also indicating a higher abundance of CO at the edge of the cloud for the SS case.
Including or excluding different shielding effects in the model is another crucial factor in the investigation of N2 and CO photodissociation. Shielding effects, which act like a “smoke screen”, help molecules survive in photon dominated regions. N2 and CO can be significantly shielded by both dust (wavelength independent) and molecules (wavelength dependent, line-by-line shielding). Fig. 4 presents the various shielding effects on N2 photodissociation. Self-shielding is the most significant shielding effect, whereas (H2 + H) shielding contributes the least. Shielding from dust largely depends on the properties of the dust (van Dishoeck et al. 2006). It is necessary to include all sources of shielding for N2 because the combined effect has a strong influence on the abundance and distribution of N2.
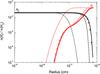 |
Fig. 5 Fractional abundances, relative to H2, of N2 and N as a function of radius. Dotted lines: McElroy et al. (2013) model, dust shielding only. Spheres, dashed and solid lines: PP model (χ = 0.5), PP model (χ = 1.0), and SS model, with full shielding (dust + self- + H + H2). |
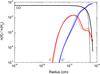 |
Fig. 6 Fractional abundances of CO, C, and C+, relative to H2, as a function of radius. Dotted lines: McElroy et al. (2013) model employing an earlier CO self-shielding function (Morris & Jura 1983) and photodissociation rates (van Dishoeck 1988). Solid lines: SS model, employing the newly calculated self-shielding function and photodissociation rate of CO (Visser et al. 2009). |
Figure 5 shows the fractional abundances of N2 and N, calculated using various models. The location of the transition zone from N2 to N is shifted outwards by a factor of 5 when molecular shielding is taken into account in the PP (χ = 1.0) model. Further changes happen when we use the SS model and PP (χ = 0.5) model.
The photodissociation of CO has an impact on both carbon and nitrogen chemistry. In particular, reactions with C+ are important destruction mechanisms for quite a few N-bearing species, for example CnN− (n = 1,3,5). As shown in Fig. 6, the conversion of CO to C and C+ is affected when CO self-shielding is calculated using the updated shielding functions. The chemistry of other C-containing molecules is also affected by the photodissociation of CO, but are beyond the scope of this work. The SS model with full shielding predicts that CO is relatively abundant up to a radius of ~ 6 × 1017 cm, which is in better agreement with observations than the PP model (which is described further in Sect. 3.3.2).
3.2. Impacts of N2 and CO photodissociation on the CSE chemistry
The photodissociation of N2 and CO significantly affects the chemistry in the outer CSE. This influence has two observable aspects: one leads to changes in the radial distribution of the species’ peak abundances. These distributions will become increasingly observable after exploiting the increased spatial resolution and sensitivity of new facilities such as ALMA. The other effect leads to changes in the peak abundances, which are directly reflected in total column densities. In the following subsections, we discuss fractional abundances of the most interesting (detectable or promisingly detectable) species which are sensitive to the photodissociation of N2 and CO. Special attention is given to N-bearing species. Unless stated elsewhere, comparisons are made between the SS model including the updated N2 and CO shielding and a recreation of the model of McElroy et al. (2013). Additional comparisons between observations and simulations from this study and McElroy et al. (2013) with regards to the 46 detected species in IRC +10216 are discussed in Sect. 3.3.
The dominant formation and destruction mechanisms of most species vary with physical conditions in the CSE. Here, we mainly focus on the chemistry of the outer CSE where photodissociation processes dominate.
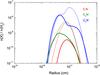 |
Fig. 7 Fractional abundances, relative to H2, of CnN− (n = 1,3,5) as a function of radius. Dotted lines: McElroy et al. (2013) model. Solid lines: SS model with updated shielding of N2 and CO, details are described in Sect. 2.2. |
3.2.1. CN−, C3N− and C5N−
When N2 photodissociation is treated in an appropriate manner, a higher abundance of N2 is present in the outer CSE with a corresponding decrease in N. The most direct effects are on those N-bearing species whose formation processes require atomic N. CnN− (n = 1,3,5) have already been observed in the CSE of IRC +10216 (Agúndez et al. 2010; Thaddeus et al. 2008; Cernicharo et al. 2008). The following discussion of CnN− chemistry is based on the adopted reaction network from Walsh et al. (2009) which was incorporated into McElroy et al. (2013) and our model. Many of the adopted rate coefficients come from Eichelberger et al. (2007).
The chemistry of the molecular anions, CN− and C3N−, in the CSE of IRC +10216 has been described in Kumar et al. (2013). As shown in Fig 7, CnN− (n = 1,3,5) are very sensitive to N2 photodissociation and are significantly decreased in the new treatment. This is because their formation processes are strongly affected by the abundance of atomic N in the outer CSE. As an example, at 1.0 × 1017 cm CN− and C3N− are mainly formed through:  (9)
(9) (10)The abundances of these anions decrease with the decreasing abundance of N. As shown in Fig. 5, the fractional abundance of N drops from 4 × 10⁻⁴ (McElroy et al. (2013) model) to 3 × 10⁻⁵ (SS model) at 1017 cm, leading to ~1 order of magnitude drop in CN− and C3N−. Interestingly, C5N− has a different formation route. It comes primarily from C5N, via
 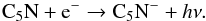 (11)The radiative electron attachment of C5N in Eq. (11) is very efficient compared with C3N, which leads to the higher abundance of C5N− (see, e.g., Herbst & Osamura 2008).
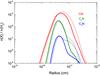 |
Fig. 8 Fractional abundances, relative to H2, of CnN (n = 1,3,5) as functions of radii. Dotted and solid lines exhibit the results from the model of McElroy et al. (2013) and the SS model. |
3.2.2. CN, C3N and C5N
The chemistry of CnN (n = 1, 3, 5) are also sensitive to N2 photodissociation, but not as sensitive as CnN− (n = 1, 3, 5). This is because they are only partly affected by the available abundance of atomic N. Take CN as an example, it is mostly formed by the following reactions,  The photodissociation of HCN dominates CN formation inside a radius of ~4 × 1016 cm. Further out, the reactions involving atomic N play a role, although these reactions do not affect its peak abundance, see Fig. 8. The cases of C3N and C5N are similar to CN.
There is a shift in the peak abundances of CN, C3N− and C5N− from the outside of the envelope inwards towards the star. In the case of C5N−, this shift is from 1017 to 4 × 1016 cm. This difference is caused by the change in location of the N2 to N transition zone when full shielding is included.
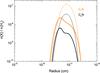 |
Fig. 9 Fractional abundances, relative to H2, of C7N and C9N as a function of radius from the center of the star towards the outside of the envelope. Dotted and solid lines exhibit the results from the model of McElroy et al. (2013) and the SS model. |
3.2.3. C7N and C9N
As shown in Fig. 9, the peak abundances of C7N and C9N are located at radii between 5 × 10¹⁶ and 1 × 1017 cm. Formation mechanisms for C7N and C9N are thought to be very similar to those of CnN (n = 1, 3, 5). They have a formation route via: 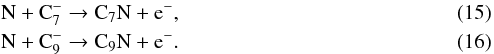 These larger CnN molecules have not yet been identified in IRC +10216, but they are also sensitive to N2 photodissociation and may be useful in indirect investigations of the chemistry and abundance of N2. Their predicted peak abundances are around one order of magnitude lower than that of C5N.
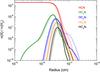 |
Fig. 10 Fractional abundances, relative to H2, of HCnN (n = 1,3,5,7,9) as a function of radius from the center of the star towards the outside of the envelope. Dotted and solid lines exhibit the results from the model of McElroy et al. (2013) and the SS model. |
3.2.4. HCnN (n = 3, 5, 7, 9)
The cyanopolyynes, HCnN (n = 3, 5, 7, 9), are also influenced by N2 photodissociation, especially in the outer shell where photodissociation processes are important, as shown in Fig. 10. The fractional abundances of HCnN (n = 3, 5, 7, 9) are all affected when the full shielding of N2 is considered. The most significantly affected species is HC5N. The changes in their total column densities are rather small because the peak abundances, which contribute most to the column densities, are unchanged. However, the radial distribution of HC5N may be spatially resolvable by sensitive interferometers.
The chemistry of large organic molecules is more complex than for simple species. At the photon-dominated radius ~1017 cm, the main destruction process for the parent species, HCN, is photodissociation, which gives rise to its daughter molecule CN. Another important process for the destruction of HCN is by C+, via  (17)However, there are quite a few reformation reactions at this location. Amongst the most important are two reactions relevant to the present study,
  The decrease of HCN in the outer CSE, shown in Fig. 10, is largely due to the enhanced shielding of N2, through the decreased abundance of N and, indirectly, CN−.
In our calculations, HCnN are synthesised by the reactions  (20)The changes in the radial distributions for HCnN (n = 3,7,9) are very similar to those of CN, see Fig. 8. HC5N is an exception, and has the largest change among all HCnN species in the photodissociation region. This is because the main formation process for HC5N is via associative electron detachment,
  (21)As discussed previously, the abundance and distribution of C5N− is strongly affected by the inclusion of N2 shielding, thus, the abundance of HC5N is also affected.
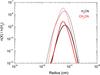 |
Fig. 11 Fractional abundances, relative to H2, of H2CN and CH2CN as a function of radius from the center of the star towards the outside of the envelope. Dotted and solid lines exhibit the results from the model of McElroy et al. (2013) and the SS model. |
3.2.5. H2CN and CH2CN
The H2CN and CH2CN peak abundances are also significantly decreased when full N2 shielding is included, as shown in Fig. 11. Their main formation processes in the outer CSE are  (22)and
  (23)There has already been a detection of CH2CN in IRC +10216 (Agúndez et al. 2008), whereas H2CN has only been detected in dark clouds (Ohishi et al. 1994). Since the column density computed here is close to the value observed in dark clouds, this species could also be detectable in IRC +10216. Because the chemistry of the two species are relatively simple and largely depend on the availability of N, we may be able to use them to constrain the fractional abundance of N2 in space by comparing observations with models.
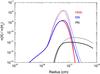 |
Fig. 12 Fractional abundances, relative to H2, of PN, SiN and HNSi as a function of radius from the center of the star towards the outside of the envelope. Dotted and solid lines exhibit the results from the model of McElroy et al. (2013) and the SS model. |
3.2.6. PN
The chemistry of P-bearing and Si-bearing species in C-rich CSEs are not completely understood (McElroy et al. 2013). The most sensitive P-bearing and Si-bearing species to N2 shielding are HNSi, SiN, and PN, see Fig. 12. Here we concentrate only on the chemistry of PN, which is mainly formed through the following route at a radius of 1017 cm:  (24)This process is largely reliant on atomic nitrogen, which is significantly decreased at the PN peak radius when updated shielding is used.
Calculated and observed column densities, as well as peak abundance radii of species detected in the CSE of IRC +10216.
3.3. Comparison with observations
3.3.1. Column density
The radially-integrated column densities of most species are controlled by their peak abundances. After investigation, the abundances of quite a few of the 467 species in the network are affected when we use an appropriate method to calculated the photodissociation of N2 and CO. A summary of the changes in column densities is an efficient way to extract the effects of these updates on the chemistry in the CSE. Here, we concentrate on those 46 species which have been observed in IRC +10216. The calculated and observed column densities are listed in Table 3. Of these, the calculated values for 14 species vary by more than 30%, and the values for 6 species vary by more than 80%, when compared with results from McElroy et al. (2013). The most affected N-bearing species with respect to the previous model are CN− (−91%), SiN (−85%), and CH2CN (−93%).
All of the species listed in Table 3 contain nitrogen and/or carbon and their formation and destruction may be influenced by N2 and CO photodissociation. The important reactions for some of these species have been discussed in the previous subsections. The most significantly altered column densities include CN− and C3N−, whose formation is sensitive to the available N, which is reduced by the increased shielding of N2 in our new calculations. A factor-of-10 decrease for SiN and CH2CN column densities can be similarly explained.
Some of these changes reduce the agreement of the CSE chemistry model with observed column densities. There are many possible reasons for the discrepancies. First of all, some of the assumptions in the physical model of the CSE, unrelated to photodissociation (see Table 1), may be too simple. Further refinement of these assumptions may improve the agreement. For example, in this study, we ignored the presence of gas and dust shells in the expanding envelope. According to the study of Cordiner & Millar (2009), the inclusion of these shells gives a significant improvement in both modelled column densities and spatial distributions. A study of photodetachment as a destruction mechanism for the N-bearing anions, CN− and C3N−, in the CSE of IRC +10216, concluded that the inclusion of shells with enhanced density, similar to the model of Cordiner & Millar (2009), increases the column densities of the anions by about 20% (Kumar et al. 2013).
One of the challenges in CSE simulations is the uncertainty in the abundance of parent species (see Table 2). In particular the modelled column densities of Si-bearing and P-bearing species in Table 3 are several orders of magnitude lower than that suggested by observations. Possibly, the currently modelled Si-bearing and P-bearing parent species should have a higher abundance or there exist other Si- and P-containing parent species. On the other hand, the uncertainties of some observations are considerable. Take SiC2 as an example. The cited column density for this molecule in Table 3 is 2.0 × 1014 cm-2 (Thaddeus et al. 1984). However, according to a more recent study by Cernicharo et al. (2010) employing high quality Herschel/HIFI spectra an average column density of ~6.4 × 1015 cm-2 was found. Our computed value, 2.6 × 1015 cm-2, is in better agreement with the latter observed value.
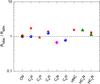 |
Fig. 13 Ratio of observed and simulated peak abundance radii (Robs. and Rsim.) for selected species. In all cases, Rsim. is obtained from our SS model. Robs. is estimated from the interferometric maps of Lucas et al. (1995; black squares), Guélin et al. (1998; pink diamond), Guélin et al. (1999; blue spheres), Dinh-V-Trung & Lim (2008; green triangles), and Guélin (2011; red stars). The dashed horizontal line indicates the position where Rsim.=Robs.. |
3.3.2. Radius of peak abundance
The radial location of peak molecular abundance is another observable parameter and is of equal importance to the column densities. Many daughter species have a clear radial peak in their modelled abundances which we may directly compare with spatially resolved observations. A selection of such observations have been reduced to their peak radii (without considering detailed excitation or radiative transfer) and compared with our model calculations, and are summarised in Table 3 and Fig. 13.
The model predicts that most peak radii fall within shells between 1 × 10¹⁶ (4′′) and 2 × 1017 cm (89′′) from the central star. Here, the distance between the Earth and IRC +10216 is assumed to be 150 pc, based on the study by De Beck et al. (2012). Different values for this parameter have been employed in other work which may affect intercomparison, e.g., Huggins et al. (1988) who assumed 200 pc, and Cordiner & Millar (2009) who employed 130 pc.
The outer radius of CO using the SS model is slightly larger, ~7 × 1017 cm (~310′′), than the previous value, see Fig. 6. Emission from CO in IRC +10216 has been extensively investigated. A good summary can be found in De Beck et al. (2012), who also obtained various physical parameters of the structure of IRC +10216. However, conclusions from these observations are not always the same. For instance, Huggins et al. (1988) detected CO emission out to ~210′′ in the J = 1−0 line and 180′′ in the J = 2−1 line. Later, the J = 1−0 line was detected out to 190′′ (Fong et al. 2003, 2006). Recently, Cernicharo et al. (priv. comm.) observed weak J = 2−1 emission out to a radius of ~300′′, in excellent agreement with the present simulations.
Figure 13 compares the simulated and observed peak abundance radii for a few selected species for which interferometric maps are available. The observed peak radii, Robs, were deduced from direct measurement of the peak radius and averaged over those maps for which multiple rotational transitions were available. These observations were done with high angular resolution telescopes, such as the Plateau de Bure Interfrometer (PdBI; Guélin et al. 1998, 1999; Guélin 2011) and the Very Large Array (VLA; Dinh-V-Trung & Lim 2008). In our models, it is assumed that the peak emission occurs at the peak abundance position, i.e., no excitation or radiative transfer of the model lines is performed.
With these assumptions, it is seen in Fig. 13 that the overall agreement between our simulations and observations is within a factor of two. Interestingly, the simulations predict a peak abundance at 18′′ for the parent species SiC2 (see Table 3). This is very close to the value estimated from observations (Lucas et al. 1995; Guélin 2011), 16′′. No other parent species exhibits a similar maximum.
None of the peak radii of observationally-mapped species were found to be significantly altered by the introduction of a more appropriate photodissociation treatment, even if their column densities were substantially changed. However, large differences were deduced for some unmapped carbon chain molecules and anions, specifically C3N−, C5N−, C5N, C7N, and C9N. The peak radii of these species all shift inwards after applying the new photodissociation shielding functions. For the case of C5N−, the peak radius retreats by a factor of 2.5, from 1.0 × 10¹⁷ (44′′) to 4.5 × 10¹⁶ (20′′) cm.
Our new model predicts that the CN− peaks at a somewhat larger radius than its corresponding neutral CN, whereas the peaks of C3N− and C5N− match those of C3N and C5N, respectively, as shown in Table 3, Figs. 7, and 8. This conclusion differs from some previous models, e.g., Kumar et al. (2013) and references therein. Similar differences were found between the modelled peak radii of the neutral and anionic forms of CnH (n = 2,4,6; see Table 3). Interferometric maps of these species could serve as a test of the model predictions.
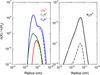 |
Fig. 14 Fractional abundances, relative to H2, of CnN− (n = 1,3,5) (left panel) and N2H+ (right panel) as a function of radius. Solid lines: calculated using an initial N2 abundance of 2 × 10⁻⁴ (relative to H2). Dash-dotted lines: calculated using an initial N2 abundance of 1 × 10⁻⁵. In both cases, the SS model with updated shielding was employed. |
3.4. N2 abundance in IRC +10216
There is some uncertainty in the initial abundance of N2 (a parent species) in the CSE of IRC +10216. In previous models, its adopted abundance relative to H2 lay between 1 × 10⁻⁵ and 2 × 10⁻⁴ (e.g., Nejad & Millar 1987; Millar et al. 2000; MacKay & Charnley 2001; Agúndez & Cernicharo 2006). In the present work, we employ the same abundance as that in the model of McElroy et al. (2013), 2 × 10⁻⁴, which gives an overall good agreement between the modelled and observed N-bearing species’ abundances in Table 3. However, the observational investigation of Milam et al. (2008) deduced an N2 abundance of ~1 × 10⁻⁷. They used the observation of PN to infer an N2 abundance by assuming approximate equality of the abundance ratios, PN/N2≃ [P]/[N] and [P]/[N] ≃ HCP/HCN ≃ 0.001.
To test the sensitivity of daughter species to the initial N2 abundance we recomputed their chemical abundances after lowering the parent N2 abundance to 1 × 10⁻⁵, a factor of 20 lower than in our fiducial models. The results for four species, CN−, C5N−, C5N−, and N2H+ are shown in Fig. 14.
N2H+ has not been observed in IRC +10216, but has been detected in other interstellar and circumstellar environments (e.g., Liu et al. 2013; Qi et al. 2013; Codella et al. 2013). This species is thought to be a good tracer for N2, from which it forms directly via the reaction, 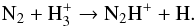 (25)The utility of N2H+ as an N2 tracer is supported by the calculated abundances plotted in Fig. 14, which are directly proportional to the assumed N2 abundance. The predicted column density of N2H+ assuming initial N2 abundances of 2 × 10⁻⁴ and 1 × 10⁻⁵ are 9.4 × 10¹⁰ and 5.3 × 109 cm-2, respectively. The peak abundance of N2H+ is located at a radius of 5 × 1016 cm (22′′). Future deeper observations of IRC+10216 with ALMA may determine the column density of N2H+ and allow for a new estimate of the N2 abundance. Note that the abundances of neither N2H+ nor HCO+, formed through a similar reaction between CO and H
 , are significantly affected by the new model treatment.
The abundances of CnN− anions are also not significantly affected by the altered parent N2 abundance. These molecules are strongly dependent on the availability of atomic nitrogen (Sect. 3.2.1) which in the region of their peak abundance forms primarily from the photodissociation of HCN. Thus, HCN is the important N-bearing parent species affecting their column densities. Note that the main source of atomic N further out in the envelope is via the photodissociation of N2.
4. Concluding remarks
In this work, the effect of self-shielding of N2 and CO, and mutual-shielding by H2, in the outer envelope of the C-rich AGB star, IRC +10216, was studied for the first time. This was performed using the latest available data for N2 and CO photodissociation, and using an extended spherically-symmetric model for molecular self-shielding. The impact of these two improvements on the chemical evolution of the expanding envelope was investigated, with special attention paid to nitrogen chemistry and detectable species.
Key points from this study are:
(i): N2 and CO are more abundant at the edge of the CSE than predicted by previous models due to molecular shielding from photodissociation.
(ii): The photodissociation of N2 and CO affects the chemistry of most species in the outer CSE. Following its improved treatment here, the transition zones of N2→ N and CO → C+→ C shift towards the outer edge of the envelope. The abundances of some species formed from N are reduced in the outer CSE. This induces large changes in the predicted column densities (factor of 10) of some species (e.g., CnN and CnN− carbon chains) and the radii of their peak abundances.
(iii): Predictions are made for column densities and peak radii of molecules whose abundances are sensitive to N2 and CO photodissociation and which could conceivably be detected. These may be verified by observations using high resolution and high sensitivity telescopes, especially ALMA and PdBI.
(iv): The abundances obtained from models which treat the full angularly-resolved spherically-symmetric radiation field incident on the outer CSE are very similar to those found in plane-parallel models in which the radiation is incident normally but with the intensity reduced by half. The proposed iterative method for implementing molecular shielding functions is most efficient when assuming that the molecule is fully shielded at the beginning of the calculation.
Other astrochemical models simulating the CSEs of AGB stars or other environments may show a similar sensitivity using a more realistic treatment of self-shielding and spherically-symmetric radiation as was found in this model of IRC +10216.
The photodissociation processes for N2 and CO (both the unshielded rate as well as the depth dependence) are now very well understood, so any major discrepancies between observations and models are likely due to other assumptions in the model.
Acknowledgments
The authors would like to thank the anonymous referee for his/her valuable comments and constructive suggestions. X. Li is delighted to thank TJM for his hospitality during a two-week visit to Queen’s University Belfast (QUB) in 2013, and thank Dr. Markus Schmalzl and Prof. Xander Tielens for some stimulating discussions. Astrochemistry in Leiden is supported by the Netherlands Research School for Astronomy (NOVA), by a Spinoza grant and grant 648.000.002 from the Netherlands Organisation for Scientific Research (NWO), and by the European Community’s Seventh Framework Programme FP7/2007-2013 under grant agreements 291141 (CHEMPLAN) and 238258 (LASSIE). Astrophysics at QUB is supported by a grant from the STFC. C. W. acknowledges support from NWO (program number 639.041.335).
References
- Agúndez, M., & Cernicharo, J. 2006, ApJ, 650, 374 [NASA ADS] [CrossRef] [Google Scholar]
- Agúndez, M., Fonfría, J. P., Cernicharo, J., Pardo, J. R., & Guélin, M. 2008, A&A, 479, 493 [NASA ADS] [CrossRef] [EDP Sciences] [Google Scholar]
- Agúndez, M., Cernicharo, J., Guélin, M., et al. 2010, A&A, 517, L2 [NASA ADS] [CrossRef] [EDP Sciences] [Google Scholar]
- Agúndez, M., Fonfría, J. P., Cernicharo, J., et al. 2012, A&A, 543, A48 [NASA ADS] [CrossRef] [EDP Sciences] [Google Scholar]
- Ajello, J. M., James, G. K., Franklin, B. O., & Shemansky, D. E. 1989, Phys. Rev. A, 40, 3524 [NASA ADS] [CrossRef] [PubMed] [Google Scholar]
- Bieging, J. H., & Rieu, N.-Q. 1988, ApJ, 329, L107 [NASA ADS] [CrossRef] [Google Scholar]
- Bohlin, R. C., Savage, B. D., & Drake, J. F. 1978, ApJ, 224, 132 [NASA ADS] [CrossRef] [Google Scholar]
- Cernicharo, J., Guélin, M., & Kahane, C. 2000, A&AS, 142, 181 [NASA ADS] [CrossRef] [EDP Sciences] [Google Scholar]
- Cernicharo, J., Guélin, M., Agúndez, M., McCarthy, M. C., & Thaddeus, P. 2008, ApJ, 688, L83 [NASA ADS] [CrossRef] [Google Scholar]
- Cernicharo, J., Waters, L. B. F. M., Decin, L., et al. 2010, A&A, 521, L8 [NASA ADS] [CrossRef] [EDP Sciences] [Google Scholar]
- Codella, C., Viti, S., Ceccarelli, C., et al. 2013, ApJ, 776, 52 [NASA ADS] [CrossRef] [Google Scholar]
- Cordiner, M. A., & Millar, T. J. 2009, ApJ, 697, 68 [NASA ADS] [CrossRef] [Google Scholar]
- De Beck, E., Lombaert, R., Agúndez, M., et al. 2012, A&A, 539, A108 [NASA ADS] [CrossRef] [EDP Sciences] [Google Scholar]
- Decin, L., Agúndez, M., Barlow, M. J., et al. 2010, Nature, 467, 64 [NASA ADS] [CrossRef] [PubMed] [Google Scholar]
- Dinh-V-Trung & Lim, J. 2008, ApJ, 678, 303 [NASA ADS] [CrossRef] [Google Scholar]
- Draine, B. T. 1978, ApJS, 36, 595 [NASA ADS] [CrossRef] [Google Scholar]
- Eichelberger, B., Snow, T. P., Barckholtz, C., & Bierbaum, V. M. 2007, ApJ, 667, 1283 [NASA ADS] [CrossRef] [Google Scholar]
- Fong, D., Meixner, M., & Shah, R. Y. 2003, ApJ, 582, L39 [NASA ADS] [CrossRef] [Google Scholar]
- Fong, D., Meixner, M., Sutton, E. C., Zalucha, A., & Welch, W. J. 2006, ApJ, 652, 1626 [NASA ADS] [CrossRef] [Google Scholar]
- Glassgold, A. E. 1996, ARA&A, 34, 241 [NASA ADS] [CrossRef] [Google Scholar]
- Guélin, M. 2011, in EPJ Web Conf., 18, 1002 [Google Scholar]
- Guélin, M., Neininger, N., & Cernicharo, J. 1998, A&A, 335, L1 [NASA ADS] [Google Scholar]
- Guélin, M., Neininger, N., Lucas, R., & Cernicharo, J. 1999, in The Physics and Chemistry of the Interstellar Medium, Proc. of 3rd Calogne-Zermatt Symp. eds. V. Ossenkopf, J. Stutzki, & G. Winnewisser, 326 [Google Scholar]
- Heays, A. N., Dickenson, G. D., Salumbides, E. J., et al. 2011, J. Chem. Phys., 135 [Google Scholar]
- Heays, A. N., Visser, R., Gredel, R., et al. 2014, A&A, 562, A61 [NASA ADS] [CrossRef] [EDP Sciences] [Google Scholar]
- Helm, H., Hazell, I., & Bjerre, N. 1993, Phys. Rev. A, 48, 2762 [NASA ADS] [CrossRef] [Google Scholar]
- Herbst, E., & Osamura, Y. 2008, ApJ, 679, 1670 [Google Scholar]
- Herbst, E., Green, S., Thaddeus, P., & Klemperer, W. 1977, ApJ, 215, 503 [NASA ADS] [CrossRef] [Google Scholar]
- Herwig, F. 2005, ARA&A, 43, 435 [NASA ADS] [CrossRef] [Google Scholar]
- Huggins, P. J., Olofsson, H., & Johansson, L. E. B. 1988, ApJ, 332, 1009 [NASA ADS] [CrossRef] [Google Scholar]
- Jura, M., & Morris, M. 1981, ApJ, 251, 181 [NASA ADS] [CrossRef] [Google Scholar]
- Knauth, D. C., Andersson, B.-G., McCandliss, S. R., & Warren Moos, H. 2004, Nature, 429, 636 [NASA ADS] [CrossRef] [Google Scholar]
- Kumar, S. S., Hauser, D., Jindra, R., et al. 2013, ApJ, 776, 25 [NASA ADS] [CrossRef] [Google Scholar]
- Le Bertre, T. 1997, Stellar Atmospheres: Theory and Observations, eds. J. P. Greve, R. Blomme, & H. Hensberge (Berlin, Heidelberg: Springer), Lect. Not. Phys., 497, 133 [Google Scholar]
- Lewis, B. R., Gibson, S. T., Zhang, W., Lefebvre-Brion, H., & Robbe, J.-M. 2005, J. Chem. Phys., 122, 144302 [NASA ADS] [CrossRef] [PubMed] [Google Scholar]
- Lewis, B. R., Baldwin, K. G. H., Sprengers, J. P., et al. 2008a, J. Chem. Phys., 129, 164305 [NASA ADS] [CrossRef] [PubMed] [Google Scholar]
- Lewis, B. R., Heays, A. N., Gibson, S. T., Lefebvre-Brion, H., & Lefebvre, R. 2008b, J. Chem. Phys., 129, 164306 [NASA ADS] [CrossRef] [PubMed] [Google Scholar]
- Li, X., Heays, A. N., Visser, R., et al. 2013, A&A, 555, A14 [NASA ADS] [CrossRef] [EDP Sciences] [Google Scholar]
- Liu, X.-L., Wang, J.-J., & Xu, J.-L. 2013, MNRAS, 431, 27 [NASA ADS] [CrossRef] [Google Scholar]
- Lucas, R., Guélin, M., Kahane, C., Audinos, P., & Cernicharo, J. 1995, Ap&SS, 224, 293 [NASA ADS] [CrossRef] [Google Scholar]
- MacKay, D. D. S., & Charnley, S. B. 2001, MNRAS, 325, 545 [NASA ADS] [CrossRef] [Google Scholar]
- Mauron, N., & Huggins, P. J. 1999, A&A, 349, 203 [NASA ADS] [Google Scholar]
- McElroy, D., Walsh, C., Markwick, A. J., et al. 2013, A&A, 550, A36 [NASA ADS] [CrossRef] [EDP Sciences] [Google Scholar]
- Melnick, G. J., Neufeld, D. A., Ford, K. E. S., Hollenbach, D. J., & Ashby, M. L. N. 2001, Nature, 412, 160 [NASA ADS] [CrossRef] [PubMed] [Google Scholar]
- Milam, S. N., Halfen, D. T., Tenenbaum, E. D., et al. 2008, ApJ, 684, 618 [NASA ADS] [CrossRef] [Google Scholar]
- Millar, T. J., Herbst, E., & Bettens, R. P. A. 2000, MNRAS, 316, 195 [NASA ADS] [CrossRef] [Google Scholar]
- Morris, M. 1975, ApJ, 197, 603 [NASA ADS] [CrossRef] [Google Scholar]
- Morris, M., & Jura, M. 1983, ApJ, 264, 546 [NASA ADS] [CrossRef] [Google Scholar]
- Ndome, H., Hochlaf, M., Lewis, B. R., et al. 2008, J. Chem. Phys., 129, 164307 [NASA ADS] [CrossRef] [PubMed] [Google Scholar]
- Nejad, L. A. M., & Millar, T. J. 1987, A&A, 183, 279 [NASA ADS] [Google Scholar]
- Ohishi, M., McGonagle, D., Irvine, W. M., Yamamoto, S., & Saito, S. 1994, ApJ, 427, L51 [NASA ADS] [CrossRef] [Google Scholar]
- Qi, C., Öberg, K. I., & Wilner, D. J. 2013, ApJ, 765, 34 [NASA ADS] [CrossRef] [Google Scholar]
- Rachford, B. L., Snow, T. P., Destree, J. D., et al. 2009, ApJS, 180, 125 [NASA ADS] [CrossRef] [Google Scholar]
- Spelsberg, D., & Meyer, W. 2001, J. Chem. Phys., 115, 6438 [NASA ADS] [CrossRef] [Google Scholar]
- Sprengers, J. P., Ubachs, W., Johansson, A., et al. 2004, J. Chem. Phys., 120, 8973 [NASA ADS] [CrossRef] [PubMed] [Google Scholar]
- Stark, G., Lewis, B. R., Heays, A. N., et al. 2008, J. Chem. Phys., 128, 114302 [NASA ADS] [CrossRef] [PubMed] [Google Scholar]
- Thaddeus, P., Cummins, S. E., & Linke, R. A. 1984, ApJ, 283, L45 [NASA ADS] [CrossRef] [Google Scholar]
- Thaddeus, P., Gottlieb, C. A., Gupta, H., et al. 2008, ApJ, 677, 1132 [NASA ADS] [CrossRef] [Google Scholar]
- Turner, B. E. 1974, Ap&SS, 29, 247 [NASA ADS] [CrossRef] [Google Scholar]
- van Dishoeck, E. F. 1988, in Rate Coefficients in Astrochemistry, eds. T. J. Millar, & D. A., Williams (Dordrecht: Kluwer Academic), 49 [Google Scholar]
- van Dishoeck, E. F., & Black, J. H. 1988, ApJ, 334, 771 [NASA ADS] [CrossRef] [Google Scholar]
- van Dishoeck, E. F., Jonkheid, B., & van Hemert, M. C. 2006, Faraday Discuss., 303, 231 [Google Scholar]
- Visser, R., van Dishoeck, E. F., & Black, J. H. 2009, A&A, 503, 323 [NASA ADS] [CrossRef] [EDP Sciences] [Google Scholar]
- Wakelam, V., Smith, I. W. M., Herbst, E., et al. 2010, Space Sci. Rev., 156, 13 [NASA ADS] [CrossRef] [Google Scholar]
- Walsh, C., Harada, N., Herbst, E., & Millar, T. J. 2009, ApJ, 700, 752 [NASA ADS] [CrossRef] [Google Scholar]
- Woods, P. M., Schöier, F. L., Nyman, L.-Å., & Olofsson, H. 2003, A&A, 402, 617 [NASA ADS] [CrossRef] [EDP Sciences] [Google Scholar]
- Zack, L. N., Halfen, D. T., & Ziurys, L. M. 2011, ApJ, 733, L36 [NASA ADS] [CrossRef] [Google Scholar]
Appendix A: Spherically-symmetric model
 |
Fig. A.1 Structure of the circumstellar envelope model of an AGB star. |
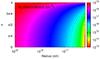 |
Fig. A.2 Map of N2 column density as a function of radius and the angle ϑ with respect to the normal direction, as described in Fig. A.1. The dashed line shows the critical column density (1.0 × 1016 cm-2). In practice, molecular N2 is ~fully shielded when its column density is higher than this value. |
In this appendix we describe the SS model employed in this work for the computation of the angle-dependent column densities of species at each radius. The SS model is shown in Fig. A.1. The star is located at point S and ejects dust and molecules to various shells with radii ri (not equidistant). Since the star itself is too cool to generate photons that can induce photodissociation of molecules (in our case, IRC +10216, ~2330 K), one only needs to consider photons from the interstellar radiation field. For a specific position P at radius ri, suppose ϑ is the angle between the direction of the incoming ray and the radius vector from the central star. Generally, the column density, N, of a species is defined as  (A.1)where n is the number density in units of cm-3 and z is the integral path length in units of cm. In the present study, the total column density, N(ri,ϑ), of a species integrated along a ray from point P to infinity is given by two cases:
-
(1)
0≤ϑ≤π/ 2, for example,
 , yielding
 ![Mathematical equation: \appendix \setcounter{section}{1} \begin{eqnarray} \label{eq:N_r_theta} && N_{\overline{\text{PA}}}(r{_i},\vartheta)=\dfrac{1}{2}\left(\sqrt{r_{i+1}^{2}-r_{i}^{2}\sin^{2}\vartheta}-r_{i}\cos\vartheta\right) \left[n(i)+ n(i+1)\right] \notag \\ && ~~~~~~~~~~~~~~~~~~~~ + \dfrac{1}{2}\sum\limits_{j=i+1}^{n-1}\left(\sqrt{r_{j+1}^{2}-r_{i}^{2}\sin^{2}\vartheta}-\sqrt{r_j^2 - r_{i}^{2}\sin^{2}\vartheta}\right) \notag \\ && ~~~~~~~~~~~~~~~~~~~~~ [n(j)+n(j+1)] ~~~~\text{cm}^{-2}, \end{eqnarray}](/articles/aa/full_html/2014/08/aa24076-14/aa24076-14-eq173.png) (A.2)where n(i) is the number density of the molecule at radius ri.
(A.2)where n(i) is the number density of the molecule at radius ri. -
(2)
π/ 2<ϑ
 π, for instance
  . Since we assume the model is spherically symmetric, one may simplify the calculations by finding a point C that satisfies
  ⊥
⊥ , then get the column density along with
  (A.3)Both
  and
and  can be conveniently calculated by case (1). Then, it is necessary to interpolate an abundance between the radially-gridded values in our model for points near the star, such as C.
Figure A.2 shows N(ri,ϑ) for molecular N2. According to our calculations, the major contribution of photons that induce photodissociation of N2 come from the area within the dashed line (N(ri,ϑ) < 1.0 × 10⁻¹⁶ cm-2), where ri> 1.6 × 1017 cm and ϑ< 3π/ 4. Deeper in the envelope, the fractional abundance of N2 stays constant because it is fully shielded.
Appendix B: Implementing the molecular shielding functions
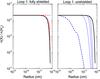 |
Fig. B.1 Illustrations of the numerical method employed for implementing N2 (and CO) shielding functions in this work. The plots show the fractional abundances of N2 as functions of radii. It is seen that one can obtain the same converged results (solid lines in black) by assuming N2 is either fully shielded (dashed line in red, left panel) or unshielded (dashed line in blue, right panel) during the first loop. The dotted lines show the intermediate abundances before reaching the final results. |
In this Appendix we introduce the new procedure employed in the current work for the implementation of molecular shielding functions. Here we take N2 as an example for the demonstration. The method has five steps.
-
Step 1
Set up the initial condition. Suppose N2 is fully shielded everywhere in the CSE, then we can set kinitial(ri) ≃ 0 for each radius, ri, which means the corresponding shielding functions from dust and molecules are zero, i.e.,
 , and
, and  . In all cases, we consider 201 incident rays as a function of ϑ between 0 and π, where ϑ = 0 gives the normal direction.
 -
Step 2
Loop 1: compute the CSE chemistry for the first time, employing kinitial(ri) prepared from Step 1. The calculated N2 abundance generates column densities, N(ri,ϑ), and corresponding dust and molecular shielding functions,
 , and
, and  , and new photodissociation rates kloop1(ri).
 -
Step 3
Loop 2: repeat the simulations of the CSE chemistry, but employing kloop1(ri) produced in Step 2 for each radius. Using the same method, generate another set of photodissociation rates, kloop2(ri).
-
Step 4
Compare the fractional abundances of N2 at each radius for Loop 1 and Loop 2, to see if they are the same. If no changes are found, go to Step 5, otherwise go to Step 3, continuing the calculations.
-
Step 5
Stop the calculation. The outputs at this step are the final results.
The simulations can also approach convergence by assuming N2 is unshielded in Step 1, namely kinitial(ri) = k0 at each radius. In this case, the fractional abundance of N2 will steeply decrease after starting the evolution of the chemical network, then approach the converged results quickly, as illustrated in Fig. B.1. The same converged results can be obtained from the two possible assumptions in Step 1. In practice, the fractional abundances of both N2 and CO (as well as all other species) reach their converged abundances after ~15 loops. In practice, starting the calculation assuming full shielding in Loop 1 is most efficient.
The iterative method proposed here may be used in other models, where output variables are also required as inputs.
All Tables
Calculated and observed column densities, as well as peak abundance radii of species detected in the CSE of IRC +10216.
All Figures
|
Fig. 1 Schematic structure of the CSE for a C-rich AGB star, which is divided into 6 regions for modelling purposes. (I): a degenerate C/O core and He/H burning shell; (II): a convective shell; (III): a stellar atmosphere in which parent species are formed; (IV): a dust formation shell with an expanding envelope; (V): an outer CSE where daughter species are formed primarily by photodissociation; (VI): the interstellar medium (ISM). This study focusses on the outer CSE where chemistry is mainly driven by the photodissociation of molecules. |
| In the text | |
|
Fig. 2 Gas density, visual extinction, and gas temperature as functions of radius for the CSE of IRC +10216 from the center of the star towards the outside of the envelope. For clarity, the radius is given in units of “cm” and “AU”. |
| In the text | |
|
Fig. 3 N2 column densities (top), photodissociation rates (middle) and their ratios (bottom) when calculated using the plane-parallel (dashed lines: χ = 1.0; spheres: χ = 0.5) and spherically-symmetric (black solid lines) models as a function of radius. The dotted horizontal line indicates kpd(PP) = kpd(SS). Outside the solid vertical line N2 photodissociation becomes considerable. |
| In the text | |
|
Fig. 4 Fractional abundance of N2, relative to H2, as a function of radius with different shielding effects. In all cases, photons are considered from all directions in space (in SS model). |
| In the text | |
|
Fig. 5 Fractional abundances, relative to H2, of N2 and N as a function of radius. Dotted lines: McElroy et al. (2013) model, dust shielding only. Spheres, dashed and solid lines: PP model (χ = 0.5), PP model (χ = 1.0), and SS model, with full shielding (dust + self- + H + H2). |
| In the text | |
|
Fig. 6 Fractional abundances of CO, C, and C+, relative to H2, as a function of radius. Dotted lines: McElroy et al. (2013) model employing an earlier CO self-shielding function (Morris & Jura 1983) and photodissociation rates (van Dishoeck 1988). Solid lines: SS model, employing the newly calculated self-shielding function and photodissociation rate of CO (Visser et al. 2009). |
| In the text | |
|
Fig. 7 Fractional abundances, relative to H2, of CnN− (n = 1,3,5) as a function of radius. Dotted lines: McElroy et al. (2013) model. Solid lines: SS model with updated shielding of N2 and CO, details are described in Sect. 2.2. |
| In the text | |
|
Fig. 8 Fractional abundances, relative to H2, of CnN (n = 1,3,5) as functions of radii. Dotted and solid lines exhibit the results from the model of McElroy et al. (2013) and the SS model. |
| In the text | |
|
Fig. 9 Fractional abundances, relative to H2, of C7N and C9N as a function of radius from the center of the star towards the outside of the envelope. Dotted and solid lines exhibit the results from the model of McElroy et al. (2013) and the SS model. |
| In the text | |
|
Fig. 10 Fractional abundances, relative to H2, of HCnN (n = 1,3,5,7,9) as a function of radius from the center of the star towards the outside of the envelope. Dotted and solid lines exhibit the results from the model of McElroy et al. (2013) and the SS model. |
| In the text | |
|
Fig. 11 Fractional abundances, relative to H2, of H2CN and CH2CN as a function of radius from the center of the star towards the outside of the envelope. Dotted and solid lines exhibit the results from the model of McElroy et al. (2013) and the SS model. |
| In the text | |
|
Fig. 12 Fractional abundances, relative to H2, of PN, SiN and HNSi as a function of radius from the center of the star towards the outside of the envelope. Dotted and solid lines exhibit the results from the model of McElroy et al. (2013) and the SS model. |
| In the text | |
|
Fig. 13 Ratio of observed and simulated peak abundance radii (Robs. and Rsim.) for selected species. In all cases, Rsim. is obtained from our SS model. Robs. is estimated from the interferometric maps of Lucas et al. (1995; black squares), Guélin et al. (1998; pink diamond), Guélin et al. (1999; blue spheres), Dinh-V-Trung & Lim (2008; green triangles), and Guélin (2011; red stars). The dashed horizontal line indicates the position where Rsim.=Robs.. |
| In the text | |
|
Fig. 14 Fractional abundances, relative to H2, of CnN− (n = 1,3,5) (left panel) and N2H+ (right panel) as a function of radius. Solid lines: calculated using an initial N2 abundance of 2 × 10⁻⁴ (relative to H2). Dash-dotted lines: calculated using an initial N2 abundance of 1 × 10⁻⁵. In both cases, the SS model with updated shielding was employed. |
| In the text | |
|
Fig. A.1 Structure of the circumstellar envelope model of an AGB star. |
| In the text | |
|
Fig. A.2 Map of N2 column density as a function of radius and the angle ϑ with respect to the normal direction, as described in Fig. A.1. The dashed line shows the critical column density (1.0 × 1016 cm-2). In practice, molecular N2 is ~fully shielded when its column density is higher than this value. |
| In the text | |
|
Fig. B.1 Illustrations of the numerical method employed for implementing N2 (and CO) shielding functions in this work. The plots show the fractional abundances of N2 as functions of radii. It is seen that one can obtain the same converged results (solid lines in black) by assuming N2 is either fully shielded (dashed line in red, left panel) or unshielded (dashed line in blue, right panel) during the first loop. The dotted lines show the intermediate abundances before reaching the final results. |
| In the text | |
Current usage metrics show cumulative count of Article Views (full-text article views including HTML views, PDF and ePub downloads, according to the available data) and Abstracts Views on Vision4Press platform.
Data correspond to usage on the plateform after 2015. The current usage metrics is available 48-96 hours after online publication and is updated daily on week days.
Initial download of the metrics may take a while.