Fig. 9
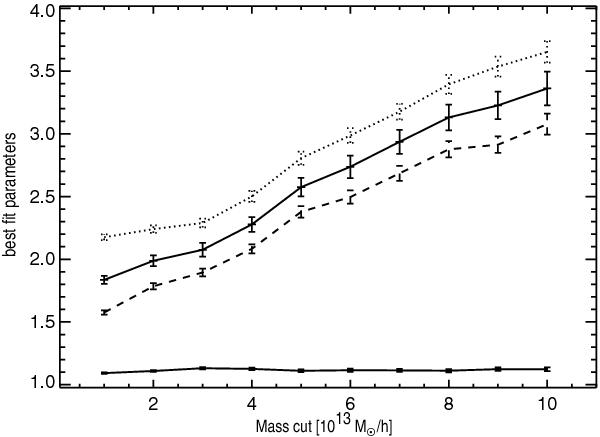
Fitted slope and amplitude for the mass bias as a function of the mass limit in the cluster catalogue. The mean of the slope is 1.1, which remains nearly constant over the cluster mass limit range (lower solid line), while the amplitude increases with the increasing mass limit (solid). The errors are calculated with one thousand bootstrappings of the sample. In comparison we show the fitted amplitude of the pair (dotted) and richer (dashed) superclusters separately where the slope is fixed to the fitted slope for the entire sample.
Current usage metrics show cumulative count of Article Views (full-text article views including HTML views, PDF and ePub downloads, according to the available data) and Abstracts Views on Vision4Press platform.
Data correspond to usage on the plateform after 2015. The current usage metrics is available 48-96 hours after online publication and is updated daily on week days.
Initial download of the metrics may take a while.