Fig. 6
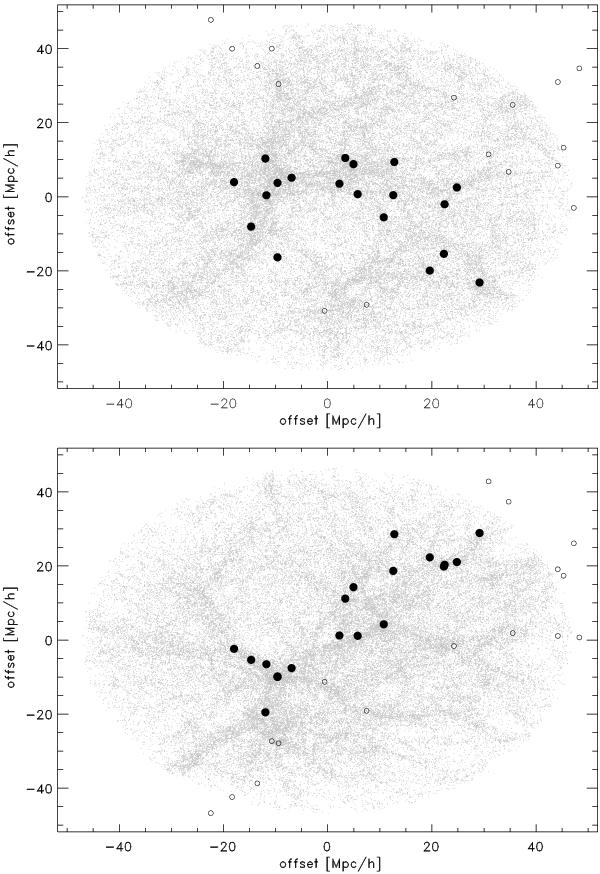
Distribution of all halos in the largest supercluster cut through two axes, in X–Y (upper), and in X–Z (lower). The offsets are in units of Mpc h-1. The member clusters are shown as filled circles, and all other halos less massive than the mass limit as grey dots, where the centre of mass is located at the origin. This supercluster, taken as an example from Fig. 4, represents superclusters with a measured density ratio lower than ten. Typically, the member clusters of these superclusters form a thin filament along one axis, which causes an over-estimation of a supercluster volume, leading to an under-estimation of the measured density ratio. The open circles mark the clusters belonging to the neighbouring superclusters whose volumes overlap with the volume of the main supercluster according to the definition of the extent.
Current usage metrics show cumulative count of Article Views (full-text article views including HTML views, PDF and ePub downloads, according to the available data) and Abstracts Views on Vision4Press platform.
Data correspond to usage on the plateform after 2015. The current usage metrics is available 48-96 hours after online publication and is updated daily on week days.
Initial download of the metrics may take a while.