| Issue |
A&A
Volume 567, July 2014
|
|
|---|---|---|
| Article Number | A97 | |
| Number of page(s) | 16 | |
| Section | Numerical methods and codes | |
| DOI | https://doi.org/10.1051/0004-6361/201423429 | |
| Published online | 21 July 2014 | |
The influence of diffuse scattered light
I. The PSF and its role in observations of the edge-on galaxy NGC 5907
Leibniz-Institut für Astrophysik Potsdam (AIP),
An der Sternwarte 16,
144 82
Potsdam,
Germany
e-mail:
This email address is being protected from spambots. You need JavaScript enabled to view it.
Received:
14
January
2014
Accepted:
12
June
2014
Abstract
All telescopes and instruments are to some degree affected by scattered light. It is possible to estimate the amount of such scattered light, and even correct for it, with a radially extended point spread function (PSF). The outer parts of the PSF have only rarely been determined, since they are faint and therefore difficult to measure. A mostly complete overview of existing properties and measurements of radially extended PSFs is presented, to both show their similarities and to indicate how bright extended objects can be used to measure the faintest regions. The importance of the far wings of the PSF and their possible temporal variations are demonstrated in three edge-on galaxy models. The same study is applied to the first edge-on galaxy where earlier observations reveal a halo, NGC 5907. All PSFs were collected in two diagrams, after they were offset or normalized, when that was possible. Surface-brightness structures of edge-on galaxies were modelled and analysed to study scattered-light haloes that result when there is an exponential disc. The models were convolved with both a lower-limit PSF and a more average PSF. The PSF of the observed data could be used in the case of NGC 5907. The comparison of the PSFs demonstrates a lower-limit r-2 power-law decline at larger radii. The analysis of the galaxy models shows that the outer parts of the PSF also are important to correctly model and analyse observations and, in particular, fainter regions. The reassessed analysis of the earlier measurements of NGC 5907 reveals an explanation for the faint halo in scattered light, within the quoted level of accuracy.
Key words: methods: data analysis / methods: observational / galaxies: structure / galaxies: individual: NGC 5907 / telescopes / galaxies: halos
© ESO, 2014
1. Introduction
Optical parts of telescopes, instruments, and detectors, as well as the atmosphere, give rise to scattered light. Imaging theory defines a point spread function (PSF) that describes how the light of a point source is affected by various optical scattering effects within these parts. The projected surface-brightness structure of an object is convolved with the PSF to form the observed structure. The time-variable and field-dependent PSF, moreover, extends to large angular radii. Whilst the PSF rapidly becomes faint with increasing radii, the integrated amount of light in its faint extended wings can still be significant. If not corrected for, the scattered light adds a systematic component to observed intensities, where the amplitude, the shape, and its influence on data are unclear.
Various astronomical studies examine, to different depths of detail, how scattered light influences their analysis. The first studies address large elliptical galaxies (de Vaucouleurs 1948; de Vaucouleurs 1953), M 31 (de Vaucouleurs 1958), and NGC 3379 (de Vaucouleurs & Capaccioli 1979; Capaccioli & de Vaucouleurs 1983, hereafter CV83); in these cases effects of scattered light are small. Corresponding effects on envelopes of supergiant elliptical (cD) galaxies appear to be small as well (Mackie 1992); however, the light profile in the outer regions of A 2029 closely follows the standard elliptical-galaxies de Vaucouleurs’ law (Uson et al. 1991), but only after they carefully remove extended and diffuse scattered-light components of field stars.
To isolate effects on colours, it is necessary to consider possible variations of the PSF with the wavelength. One study of 36 elliptical and lenticular galaxies convolve data of one bandpass with the PSF of the second bandpass before calculating colours (Idiart et al. 2002); the study, however, provides no information on how this method compares with a deconvolution in the separate bandpasses. The combined effects of colours and temporal variations of scattered light are at first studied in observations of four elliptical-type galaxies (Michard 2002); this important study reports smaller effects in the two larger galaxies NGC 4406 and NGC 4473, whilst the two smaller galaxies NGC 4550 and NGC 4551 show larger effects.
Observations of extended emission around much brighter point sources are easily corrected through the use of a scaled PSF. Several studies subtract substantial amounts of scattered light from the central-star component in observations of circumstellar shells around old giant stars (Bernat & Lambert 1975; Mauron & Caux 1992; Plez & Lambert 1994; Gustafsson et al. 1997; González Delgado et al. 2001). Observations of hosts of distant quasi-stellar objects are also corrected by subtracting emission that originates in one or a few bright components that appear as point sources (Rönnback et al. 1996; Wisotzki et al. 2002; Örndahl et al. 2003). Extended and faint ionized haloes around planetary nebulae (PNe) are affected by scattered light from the drastically brighter central parts (Middlemass et al. 1989); the authors do not measure a PSF by themselves, but analyse their data of BD+ 30°3639 with the extended PSF of King (1971, hereafter K71). Other studies search deep exposures of PNe for additional haloes (e.g., Corradi et al. 2003), focusing on observations that show clumps and asymmetries, and avoiding data that only show diffuse light. With few exceptions these studies do not derive any physical properties of the haloes. One bold spectroscopic study, so far, both addresses scattered light and aims to measure physical properties in PN haloes (Sandin et al. 2008); the goal of this study was to derive the mass-loss evolution of the previous phase on the asymptotic giant branch with the PN halo data.
De Jong (2008, hereafter J08) makes a more detailed study of the influence of scattered light on observations of smaller edge-on galaxies, both with data in the Hubble Ultra Deep Field (Beckwith et al. 2006) of the Hubble Space Telescope (HST) and in stacked data of the ground-based Sloan Digital Sky Survey (SDSS). He argues that PSF effects nearly fully explain HST data, but effects are smaller in SDSS data (accounting for 20−80 per cent of the halo light) and merely inner regions are affected. He dismisses its role in larger objects by their size, because he assumes a too steep slope at large radii (see below). Tziamtzis et al. (2009) set out to study density profiles in the halo outside a shock front around the supernova remnant of the Crab nebula, but because of high levels of scattered light, this was unattainable. Bergvall et al. (2010) make a case to dismiss scattered light as a general phenomenon in a simplified study of stacked SDSS images of low surface-brightness edge-on galaxies. The most recent study I mention is that of Feldmeier et al. (2013), who make a serious effort to account for effects of scattered light in a search for haloes around Lyα emitting galaxies; they find that haloes at redshift z ≃ 2.1 can be fully explained by scattered light, whilst small haloes of galaxies at redshift z ≃ 3.1 are partly still present after the scattered light is removed.
The cases that are mentioned above cannot be more than examples, as how scattered light is treated is nearly always part of the methods, and not a main topic. With few exceptions, studies that claim they address the role of scattered light only focus on measuring one PSF for all data, which is scaled to see how it matches object intensity structures of largely different origins. This procedure is ineffective with extended objects, where it is necessary to deconvolve surface-brightness structures with the PSF at the time of the observations. The few studies that deconvolve their data rarely consider temporal variations in the outer parts of the PSF, or they underestimate or truncate the PSF at some radius. The extended PSF is central to the analysis of scattered light, but it is unclear how it varies with wavelength, time, and location. And the faint outer wings are poorly known, partly since there is no established procedure to measure them.
This study focuses on ground-based observations in the visual wavelength range, 300–900 nm. I begin with an overview of measured radially extended PSFs in Sect. 2, providing an update of the studies of K71 and Bernstein (2007, hereafter B07). The overview focuses on two aspects that were not accounted for in any detail before. Measurements of the encircled energy show that the far regions of the PSF may contribute significant amounts of light. Current measurements of PSFs only measure stars; I demonstrate how planets, the Moon, and the Sun, can be used at larger radii instead, as in earlier studies. The analysis method that is used to model surface-brightness structures of edge-on galaxies is described in Sect. 3. Example models of a small, an intermediate-size, and a large edge-on disc galaxy are also analysed here; these examples demonstrate the decisive importance of using PSFs that are not truncated at short radii.
As an example of a real object, I analyse models and measurements of the edge-on galaxy NGC 5907 in Sect. 4. This is an important object, since it presents the first case where a halo of excess light was found around an edge-on galaxy (Sackett et al. 1994). I reassessed the analysis of Morrison et al. (1994, hereafter MBH94), to show that it is possible to explain both the halo and the red excess in the halo by scattered light. The paper is finished with a brief discussion and conclusions in Sect. 5.
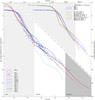 |
Fig. 1 PSF surface-brightness profiles versus the radius r for a 0 mag point source. Individual PSFs are drawn with coloured lines and symbols as indicated in the figure, see also Table 1. PSFs of stacked SDSS images are shown in the upper part of the figure, as a function of 103 × r; PSFV,0m, PSFi,0m, and the outer regions of PSFK71 are shown in both parts as references. Extrapolated PSFs are shown with dotted lines. The light (medium) grey region indicates the PSF core (blue sky) and the white region the aureole, as defined for PSFCV,1 and PSFCV,2 (CV83). |
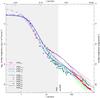 |
Fig. 2 PSF surface-brightness profiles versus the radius r for a 0 mag point source, from references that are discussed by B07. Individual PSFs are drawn with coloured lines and symbols as indicated in the figure, see also Table 1. PSFK71, PSFV,0m, PSFi,0m, and PSFCV,2 are shown in this figure as references. The light grey region indicates the PSF core, and the white region the aureole, as defined for PSFCV,1 and PSFCV,2 (CV83). |
Chronological list of measurements of radially extended PSFs.
2. Measurements and properties of the PSF
In the formalism of imaging theory the PSF describes how a point-source image is affected
by broadening through detector effects, optical aberrations, diffraction, and scattering
effects within the instrument, the telescope, and the atmosphere. The shape of the PSF is
determined by atmospheric turbulence in the bright centre region, where it can be described
by a Moffat profile, using Kolmogorov statistics (Racine
1996). The much fainter region outside the centre, the so-called aureole, is less
well understood and has been a target for scrutiny. Possible sources of the aureole include
scattering by atmospheric aerosols and dust, as well as micro-ripples and dust on optical
surfaces (for example, van de Hulst 1948; Deirmendjian 1957, 1959), and effects of diffusion and reflection within the instrument (Hasan & Burrows 1995; Racine 1996; B07; Slater et al.
2009, hereafter SHM09). The aureole eventually, at say
 , merges into an extremely faint
“blue-sky” component of Rayleigh scattering that extends to, say, 90° (Deirmendjian 1957, 1959).
, merges into an extremely faint
“blue-sky” component of Rayleigh scattering that extends to, say, 90° (Deirmendjian 1957, 1959).
I begin with an overview and comparison of empirically measured radially extended PSFs in Sect. 2.1. The PSF comparison of B07 is discussed separately in Sect. 2.2. Thereafter, I describe how the PSFs are normalized and extrapolated to larger radii in Sect. 2.3, and discuss the outcome of measurements of the encircled energy in Sect. 2.4. Guidelines on how to make new PSF measurements are provided in Sect. 2.5. Only instrument and telescope effects remain outside of the Earth atmosphere. A brief outline to how HST data could also be affected by radially extended PSFs is presented for completeness in Appendix A.
2.1. An overview of measured radially extended PSFs
Few PSFs are measured out to large angles (radii r). Here I overview a sample of PSFs that were measured with different instruments and filters, at various telescopes, to show their similarities in terms of shape and radial extent. Most PSFs are shown in Fig. 1, where they are normalized to 0 mag; the PSFs that are discussed in Sect. 2.2 are shown separately in Fig. 2, to avoid that Fig. 1 is overfilled. Information of observational setups and radial extents of all discussed PSFs are collected in Table 1.
K71 presents the radially extended PSFK71 that continues out to r ≃ 5°; this PSF
is a composite of his own measurements with the 48′′ telescope at the Palomar Observatory and, amongst
other, the measurements of de Vaucouleurs (1958),
who used the 21′′
reflector at the Lowell Observatory. Kormendy
(1973) presents PSFK73 for the radial range 7″ ≤ r ≤ 1°,
which was also measured with the 48′′ telescope at Palomar. With PSFCV, CV83 present the, so far,
radially most extended PSF, which reaches r = 90° and covers more than
30 mag in intensity. When
CV83 measure PSFCV,
they simplify their analysis and assume that the PSF is well fitted by a sum of three
Gaussian profiles (this approach is earlier also used by de Vaucouleurs 1948; Brown 1978). Their
analysis on the origin of the PSF and various sources of errors is thorough, but it is
applied to NGC 3379, which is an extended elliptical galaxy with a slowly decreasing
surface brightness; they show that in this case the PSF is of minor importance.
PSFCV,1 and
PSFCV,2, which
only differ in the core, are claimed to be measured at a seeing of
 and
and
 , respectively, instead of the real
values and
, respectively, instead of the real
values and
 that can be measured in the profiles.
Sandin et al. (2008) measure a spectroscopy PSF
using the lens array integral field unit of the Potsdam Multi Aperture Spectrograph
(PMAS). The published PSF was measured using saturated data, which resulted in a too wide
core profile. Here, PSFP,LR is presented, where the core profile is replaced with
the PSF of a faint star that was observed at  seeing (this procedure causes the
kink in PSFP,LR
that is seen at
seeing (this procedure causes the
kink in PSFP,LR
that is seen at  ). PSFP,LR only extends to
r ≃ 25″,
but it agrees well with the imaging PSFs – this indicates that PSF effects are plausibly
equally critical in imaging and spectroscopy data. Monreal-Ibero et al. (2006) show the only other example of an extended
spectroscopy PSF that I know of, for the VIsual Multi-Object Spectrograph at the Very
Large Telescope, but it only reaches r = 12″. Moreover, SHM09 study the instrumental
origin of the PSF and present the composite PSFS09, which extends to r ≃ 64′. These authors show
that the aureole brightness depends strongly on where measurements are made in the field.
Measurements that are offset from the optical axis may, depending on the amplitude of the
offset and changing optical conditions, result in asymmetric PSFs.
). PSFP,LR only extends to
r ≃ 25″,
but it agrees well with the imaging PSFs – this indicates that PSF effects are plausibly
equally critical in imaging and spectroscopy data. Monreal-Ibero et al. (2006) show the only other example of an extended
spectroscopy PSF that I know of, for the VIsual Multi-Object Spectrograph at the Very
Large Telescope, but it only reaches r = 12″. Moreover, SHM09 study the instrumental
origin of the PSF and present the composite PSFS09, which extends to r ≃ 64′. These authors show
that the aureole brightness depends strongly on where measurements are made in the field.
Measurements that are offset from the optical axis may, depending on the amplitude of the
offset and changing optical conditions, result in asymmetric PSFs.
The PSF studies that were mentioned so far do not examine any time or wavelength variations outside the centre PSF. Such variations have long since been found in photometer measurements near the solar limb (Michard 1953; Pierce 1954) and off the bright limb of the Moon (Piccirillo 1973); the latter study presents three sections of the aureole with PSFP73. Piccirillo, moreover, finds a correlation between the measured aureole and times of mirror re-aluminizing and washing, as well as the telescope location. The aureole that he measures with data from the McDonald Observatory (not published) is time invariant, whilst the one that he measures at the Goethe Link Observatory increases by up to a factor ten within a few months. Michard (2002) measures inner aureoles at the Haute-Provence Observatory with various imaging filters that also show temporal changes. He presents the only published radially extended PSFs that are available for two bands at two distinct times (they are separated by three months; PSFV,0m, PSFV,3m, PSFi,0m, and PSFi,3m). The two V-band PSFs differ by up to 1 mag arcsec-2, whilst the two i-band PSFs show a smaller difference. In general, PSFs show weak variations with wavelength, except measurements in the i-band that in some parts are affected by the CCD-specific red halo effect (Sirianni et al. 1998). PSFK71, PSFK73, PSFP73, and PSFCV (as well as PSFS74, see Sect. 2.2) were measured with photographic and photomultiplier data, and more recent PSFs with CCDs.
Several studies stack a large number of images of the Sloan Digital Sky Survey (SDSS) and then measure one PSF per band; for example, Zibetti et al. (2004); J08; Bergvall et al. (2010); and Tal & van Dokkum (2011), which extend to r ≃ 30–60″. The g- and i-band SDSS PSFs are shown in Fig. 1 versus 103 × r, separated from the other PSFs. J08 extrapolates his PSF for r> 71″, using a r-2.6 power law (dotted dark green line in Fig. 1). This extrapolation is poorly justified in comparison with, for example, PSFK71 and PSFS09, which decline as r-2, and other PSFs are even more shallow [PSFP73(°, •), PSFK73, and PSFCV]. The SDSS PSFs are all averaged using a large number of 53 s exposures that were collected during years of observations. Such PSFs, of individual filters, should be nearly identical, if they are time invariable and differences across the field are ignored. Figure 1 shows that the i-band filter PSFs differ by up to two magnitudes, in particular the i-band PSF of Tal & van Dokkum (2011) lies above the other ones. The large deviation between the PSFs in the outermost parts illustrates that the SDSS exposure time of 53 s might be too short for these measurements. It is plausible that the SDSS PSFs are affected by either temporal variations, optical-path differences across the field, or both.
Two of the three remaining PSFs in Fig. 1 are
PSFMBH and
PSF .
MBH94 present PSFMBH in their analysis of NGC 5907 and
PSF
is derived here, both PSFs are discussed further in Sect. 4.
.
MBH94 present PSFMBH in their analysis of NGC 5907 and
PSF
is derived here, both PSFs are discussed further in Sect. 4.
Most of the PSFs mentioned here are measured with telescopes that use reflective mirrors; remaining parts use scaled intensity estimates of the sky away from the sun. Abraham & van Dokkum (2014) instead use an optical configuration with eight, comparatively small, refracting telephoto lenses. Their resulting PSFA14 lies markedly lower than all other PSFs where r ≳ 30″.
The presented PSFs clearly illustrate that there is no empirical support for truncating a PSF at a shorter radius. Except in the innermost seeing-dependent core, and where 100 ≲ r ≲ 400″, PSFK71 appears to present an approximative lower limit of the extent of scattered light throughout the radial range in reflective telescopes. Except PSFS09 and PSFA14, the outer PSF (where r ≳ 500″) was measured once in the early eighties (PSFCV), and only thrice before that (PSFK71, PSFK73, and PSFP73). Additionally, Wu et al. (2002) claim that they measured a PSF that extends to r = 1700″, but they do not present it (and the data are lost, H. Wu, priv. comm.). I speculate that the r-2 dependence at large radii of the other PSFs, at least partially, occurs due to an obstructed pupil and reflective surfaces, whilst PSFs that are even brighter occur due to the degradation of, as well as deposition of dust, on reflective optical surfaces.
2.2. Further evidence against a steeper than r-2 power-law slope that contradicts the conclusion of B07
B07 discusses PSFs from the viewpoint of their slope at different radii. She notes that the slopes of the outer PSF differ, which are measured with the 48′′ telescope at Palomar by three different authors. To this purpose, she compares the r-2 slope of K71 for r< 228″ (the exact dates of these measurements are not specified) with the r-1.7 slope of Kormendy (1973, measured August 1971–April 1972) for 3 ≤ r ≤ 30′, and the r-2.6 slope of Shectman (1974, measured March–April 1971) for r = 100″, and summarizes that the PSF of this telescope is not well determined within a time frame of a few months. She notes that differences are probably the result of filter and emulsion use, mirror cleanliness, and measurement errors. In view of the two sets of PSFs of Michard (2002), it seems plausible that the temporal resolution of the Palomar PSFs is too poor to draw any conclusion about how the PSFs change with time. Note, however, that the feature at r ≈ 280″ is seen in both PSFK73 and PSFS74.
The comparison of slopes that B07 presents appears less dramatic when all PSFs are collected in the same plot. All but one PSF of B07 are shown in Fig. 2. The exception are the data of Middlemass et al. (1989), who use PSFK71 and present data of the small, but extended, planetary nebula BD+30°3639 (in their Fig. 1); B07 seemingly uses these data as a PSF. B07 measures PSFB07 that reaches r ≃ 400″, and is centred on the optical axis. She also measures a second PSF that is offset by 3′ from the optical axis; in view of the lack of details regarding the optical setup, and with respect to the discussion and results of SHM09, it is uncertain how the offset PSF can be compared to PSFB07. For example, on which side of the optical axis is the offset PSF measured? Whilst there are local deviations from a slope that decreases as r-2, there is no evidence for a globally steeper slope in telescopes that use reflective mirrors, neither in Fig. 2 nor in Fig. 1. PSFB07 is partly lower in the outermost regions, where it is also very noisy.
2.3. Extrapolating and normalizing the PSFs
I chose to normalize all PSFs that are measured near the centre to r = 90°, which is the largest radius that was considered in the derivation of a PSF (see the information on PSFCV). Even larger radii cannot be excluded. In the centre region, I extrapolated each PSF to r = 0 with centred and fitted Gaussian profiles. All details of the normalization and extrapolation to larger radii of individual PSFs are given in Appendix B.
The outer regions of the PSFs are only poorly known, at best, which makes the normalization uncertain. In this paper, I delimited the study of objects to the radial range r< 450″, and used PSFs in the radial range r< 900″ (cf. Sect. 3.4).
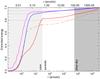 |
Fig. 3 Encircled energy versus the radius r. The four PSFs shown are: PSFK71 (magenta, uppermost line), PSFCV,1 (red, lowermost line for r< 20″), PSFCV,2 (orange, lowermost dash-dotted line for r> 20″), and PSFV,0m (blue). The light (medium) grey region indicates the PSF core (blue sky), and the white region the aureole, as defined for PSFCV,1 and PSFCV,2 (CV83). The horizontal dotted lines at 0.8, 0.9, and 0.95 are guides. |
2.4. Measuring the encircled energy
Whilst the radially extended PSF may reach r = 90°, and beyond, only the inner parts, which are induced by the instrument and not the atmosphere, are expected to affect the accuracy of flux measurements (CV83; B07). CV83 measure the B-band PSFCV and find that the energy fraction in the aureole and the blue sky, 30 per cent, corresponds to the atmospheric extinction in the B band. To check how general this finding is, the encircled energy is shown versus radius for four PSFs in Fig. 3: PSFCV,1 and PSFCV,2, which share the outer profile, and PSFK71 and PSFV,0m. About 28 per cent of the encircled energy is contained in the aureole and the blue-sky parts of PSFCV,2, in agreement with CV83. However, the value is about 18 (6.5; 8) per cent for PSFCV,1 (B-band PSFK71; V-band PSFV,0m). Also, the outer parts of PSFCV were measured without any filter (Table 1). PSFCV (and thereby PSFCV,1 and PSFCV,2) becomes more shallow for r ≳ 1000′, possibly as a result of fitting the measurements with three Gaussian profiles. The shallower PSF causes slopes that are steeper than those of PSFK71 and PSFV,0m in the outermost (blue-sky) region, cf. Fig. 3.
Considering the quoted percentages and that the extinction decreases for redder wavelengths, with the currently measured PSFs there is clearly no simple correlation between the fraction of energy in the outer PSF and the atmospheric extinction.
2.5. Recommendations for new measurements of the PSF
The total number of measured PSFs that extend beyond a few minutes of arc is small; PSFK71, PSFK73, PSFP73, PSFCV, and PSFS09 extend this far. Only PSFS09 was measured recently. Neither a wavelength dependence nor temporal variations were considered in the measurements of the outer parts of these PSFs; the general application of these static PSFs to deconvolve data is discouraged. It is also important that all flux is included in the calculation of azimuthally averaged profiles; the PSF is somewhat underestimated, if, for example, diffraction spikes are masked (this is measured here for the case of NGC 5907, cf. Sect. 4.2).
Nowadays, PSFs are exclusively measured using combined data of faint and bright stars. Measurements in different radial regions are combined by matching them in overlapping regions. Faint stars are used to measure the seeing-dependent core, and bright stars are used to determine the fainter outer regions. Very bright stars are, unfortunately, limited in number. Even if a bright star is used, the surface brightness cannot be accurately measured beyond some radius with reasonable exposure times (say, shorter than about 1800 s).
Properties of the Sun, the Moon, and the brightest planets and stars in the sky.
Earlier PSF studies also make use of observations of Jupiter, the Moon, and even the Sun. Compared to centres of stars, surface brightnesses of the planets and the Moon are lower, but integrated intensities can be drastically higher.
Extended objects are not directly comparable to point sources. However, they appear as
point sources, beginning at a geometry-dependent angular distance rPSF, after they
are normalized with the illuminated surface area (including a correction for intensity
variations across the surface). To illustrate this, I made the simplifying assumption that
each extended object is a disc of specified diameter with a constant (homogeneous)
brightness. Each surface-brightness structure was convolved with PSFV,0m and the
result was divided with the illuminated area. With the smaller planets (the larger
planets; the Moon and the Sun) I created model images where I used pixels that are
 (
( ; 10″) on the side. Surface-brightness profile
cuts at the apogee and the perigee of Venus, Jupiter, and the Moon are compared with
PSFV,0m in Fig. 4.
; 10″) on the side. Surface-brightness profile
cuts at the apogee and the perigee of Venus, Jupiter, and the Moon are compared with
PSFV,0m in Fig. 4.
Object diameters at perigee and apogee, as well as magnitudes of the Sun, the Moon, the brighter planets, and the six brightest stars are collected in Table 2. Approximate values on magnitudes and sizes should suffice in this context – real PSFs are preferably derived by matching overlapping PSFs. The beginning PSF radius rPSF, where the surface brightness of each respective extended object deviates by less than 5 per cent from PSFV,0m, is shown in the same table. Adopting a generous margin, all objects appear as PSFs outside an angular radius of two times the respective object diameter, except Mars at apogee (3.7 × the diameter). rPSF is shown in Fig. 4 also for the half Moon at apogee, as viewed on the symmetry axis and the axis that is orthogonal to that; the corresponding beginning PSF radii are rPSF = 16′ and rPSF = 29′. It seems appropriate to observe other bright objects instead of the faint Mars and Saturn at their apogee, but in particular Mars is significantly brighter at perigee.
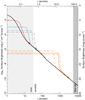 |
Fig. 4 Comparison of PSFV,0m (black line) with surface-brightness profile cuts of Venus (red lines), Jupiter (blue lines), the full Moon (solid and dash-dotted orange lines), and the half Moon on the symmetry axis (dashed orange line) and the axis orthogonal to that (dotted orange line). Profiles of objects at apogee (perigee) are drawn with solid (dash-dotted) lines. All profiles, but PSFV,0m, were divided with the illuminated area of the respective object. The light (medium) grey region indicates the PSF core (blue sky), and the white region the aureole. Bullets and circles indicate rPSF of individual profiles, cf. Table 2. |
The intermediate PSF range, say 1′ ≲ r ≲ 1°, is well measured with Mars and Saturn at perigee, and with Venus and Jupiter at any time. De Vaucouleurs (1958) uses Jupiter to measure a PSF out to r = 5°, 29 mag below the integrated magnitude (these measurements are part of PSFK71, cf. Table 1). B07 raises some concern that the faintest intensities measured around Jupiter are affected by Zodiacal light, but Jupiter is bright and the slope agrees with the other measurements. Venus is a crescent at perigee, the beginning PSF radius is therefore slightly smaller than what I calculated using a disc.
The outer PSF, say 1 ≲ r ≲ 10°, is well measured using the bright Moon, say, when half or more of the Moon is illuminated. Krisciunas & Schaefer (1991, and references therein) provide a detailed account for issues related to measurements of the surface-brightness due to the Moon across the sky (also see Patat 2003). The outermost parts of the PSF, 1 ≲ r ≲ 90° (and beyond), could be estimated using the Sun (van de Hulst 1948, CV83). The illuminated and projected area of the Moon varies between the new Moon and the full Moon – the angular distance should be measured from the centre of mass of the illuminated area.
The edge-on galaxy models that are presented in Sect. 3.4 indicate that it is necessary to measure the PSF out to a radius that is 1.5 times larger than the measurements, to ensure that observed data can be corrected for integrated scattered light. Current measurements of PSFs are crude and few, which is why it is difficult to judge their influence on observations in general. New measurements of radially extended PSF – as function of angle, time, wavelength, and position in the field – are needed for all telescope and instrument setups that are used to observe extended objects. There are several attempts to model the outer PSF theoretically, but it is not understood how the inverse-square decline with radius is created.
Lots of observing time would be required, if it was demanded that each project observes individual PSFs. With the HST PSF model code Tiny Tim (see the discussion on space-based PSFs in Appendix A) as an example, it seems worthwhile to explore possibilities to develop a similar tool for ground-based telescopes. Analysis work of both past and new observations could be improved if there was a PSF lookup library for different instrument modes at a telescope, as function of filter or wavelength, time, and position within the observable field. New observations could at first be made at some weekly or monthly intervals to determine the temporal variations of the PSF; it might be a good idea to also record the time since the last mirror aluminization and washing, the air quality, ground reflective properties, and the like. At the moment it seems that the extended PSF must be individually measured for each observed exposure, but the suggested approach would provide good foundations and constraints to develop the theory of the outer parts of the PSF.
3. Method and its application to example models
The simulations of the surface-brightness structure of the example galaxies and NGC 5907 were split into three steps. I selected a set of measured PSFs that can be used to estimate varying scattered-light effects. Thereafter, I configured models of the surface-brightness structure. Finally, I applied the PSFs to the model structures and analysed the outcome. These steps are described in the following three subsections. I apply the method to three example models in Sect. 3.4.
3.1. Choosing representative PSFs
Representative PSFs should describe both temporal variations and the red-halo effect in
the i band,
and they should extend out to r ≃ 900″, which is twice the maximum object radius
that I consider. I chose to use the only published extended PSFs that were measured with
both the (Cousins) V and the (Gunn) i bands, at two distinct
occasions that were separated by three months: PSFV,0m and
PSFi,0m that were measured three months
before PSFV,3m and PSFi,3m; the
difference with radius of PSFV,3m−PSFV,0m is on
average higher than that of PSFi,3m−PSFi,0m (Fig. 1). The comparison of the PSFs in Figs. 1 and 2 demonstrate
that PSFV,0m is perhaps ≲ 0.5 mag arcsec-2 brighter at
intermediate radii than the other PSFs; the value is a bit uncertain since it was
necessary to scale several PSFs. At larger radii, r ≳ 80″, it is difficult to
draw such a conclusion. I used PSFV,0m as an indicator of average PSF
effects with the example models in Sect. 3.4.
PSFV,3m is much brighter, and is more
representative of an upper limit. (See Sect. 4.2 for
a comparison of PSFMBH and PSF.)
The radially extended B-band PSFK71 is used as a lower limit indicator of scattered
light, both with the example models and with NGC 5907. Moreover, PSFi,0m represents
the i-band
average SDSS PSFs well where r
≳ 10″. PSFi,3m is used as an upper limit in the
i band,
similar to how PSFV,3m is used. Some PSFs show more light
at large radii than the r-2 power-law of PSFK71 (see Sect. 2); the predictive ability at larger radii is therefore
weaker.
In the simulations, I assumed that the two V-band PSFV,0m and PSFV,3m, as well as the B-band PSFK71, are the same in the R band – I do this under the assumption that measured PSFs of different bands (except the i band) are very similar, cf. Sect. 2.1. The colour predictability is delimited to R − i. I did not differentiate between Cousins, Harris, or other photometric systems. All five PSFs were measured at a seeing of several arc seconds, which is why the spatial resolution in the brightest centre region is poor. Here, faint diffuse emission is studied, where the spatial resolution and resulting lower intensities in the centre regions are of minor importance.
3.2. Setting up sets of model surface-brightness structures
Two-dimensional surface-brightness structures of edge-on disc galaxies are suitably
described in cylindrical coordinates. The space-luminosity density I′ can be
described by (van der Kruit 1988; van der Kruit & Searle 1981)
 (1)where
 is the
centre intensity, r′ the radius, hr the scale length,
z′ the vertical distance from the centre,
z0 the vertical scale height, and
ns is set to 1, 2, or ∞. The intensity drops to zero at a
galaxy-specific truncation radius. When a disc galaxy is projected edge on, and the
truncation radius as well as dust extinction are ignored, the surface-brightness structure
I(r,z) becomes
is the
centre intensity, r′ the radius, hr the scale length,
z′ the vertical distance from the centre,
z0 the vertical scale height, and
ns is set to 1, 2, or ∞. The intensity drops to zero at a
galaxy-specific truncation radius. When a disc galaxy is projected edge on, and the
truncation radius as well as dust extinction are ignored, the surface-brightness structure
I(r,z) becomes
 (2)where
 is the centre
intensity, r
the major-axis radius, z the minor-axis (vertical) distance from the centre
of the disc, and K1 the modified Bessel function of the
second kind. The intensity is slightly lower at larger radii when the truncation radius is
finite and taken into account; considering how uncertain the PSFs are, this effect is
ignored here. I assume in Sect. 3.4 that the disc is
isothermal (ns =
2), and in Sect. 4 it seems to
work better using ns = 1 with NGC 5907. No attempt is
otherwise made to make a perfect fit of the centre region of NGC 5907. The relation
μ = −2.5 log 10(I) is used to convert between
magnitudes μ
and intensities I.
is the centre
intensity, r
the major-axis radius, z the minor-axis (vertical) distance from the centre
of the disc, and K1 the modified Bessel function of the
second kind. The intensity is slightly lower at larger radii when the truncation radius is
finite and taken into account; considering how uncertain the PSFs are, this effect is
ignored here. I assume in Sect. 3.4 that the disc is
isothermal (ns =
2), and in Sect. 4 it seems to
work better using ns = 1 with NGC 5907. No attempt is
otherwise made to make a perfect fit of the centre region of NGC 5907. The relation
μ = −2.5 log 10(I) is used to convert between
magnitudes μ
and intensities I.
3.3. Models and measurements analysis procedure
Each two-dimensional R-band model image is convolved individually with the three resampled and normalized two-dimensional V-band PSFV,0m and PSFV,3m, and the B-band PSFK71. This is repeated for each i-band model image with PSFi,0m and PSFi,3m. The i-band models use the same model parameters as the R-band models, with one exception, z0,i = 0.95z0,R, which results in negative slopes in R − i with increasing vertical distance. Thereby, any red-excess haloes in convolved models are induced by the PSF. μ0,0,R − μ0,0,i is set to 1.3 mag arcsec-2, which produces a rough agreement with the V − i profile for NGC 5907 of Lequeux et al. (1996, hereafter LFD96)1. The used PSF image is twice as large as the model image, to avoid PSF truncation effects in convolved images (see below). The PSF and the model images are resampled to use the same pitch and about 100–200 pixels on the side, typically, to keep calculation times short. All convolutions are made by direct integration.
Convolved surface-brightness profiles are plotted together with model surface-brightness profiles for a cut along the minor axis, directed outwards from the centre on the same (vertical) axis. V- and R-band measurements of NGC 5907 are plotted as well in Sect. 4; I used dexter2 (Demleitner et al. 2001) to extract the data. The three resulting R − i colour profiles are shown in a separate lower panel: the model, the convolved models that used the earlier PSFV,0m and PSFi,0m, and the convolved models that used the later PSFV,3m and PSFi,3m.
The PSF induces scattered light, where surface-brightness profile cuts of input models and convolved models differ. Larger differences between profile cuts of convolved models that use PSFV,0m, PSFV,3m, and PSFK71 in the R band, or PSFi,0m and PSFi,3m in the i band, are indicators of stronger time dependence in the PSFs. The opposite applies when such differences are smaller. Measured values that are due to scattered light should fall on top of profile cuts of a model that is convolved with the PSF at the time of the observations.
A scattered-light halo radius r110 is defined as the smaller limiting radius where the convolved model intensity at all larger radii is ≥10 per cent higher than the model intensity. r110 depends on both object parameters and the PSF.
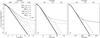 |
Fig. 5 Vertical-axis surface-brightness profiles that illustrate effects of radial truncation of PSFK71 and PSFV,0m in example models. The three panels show: a) a small edge-on galaxy, b) an edge-on galaxy of intermediate size, and c) a large edge-on galaxy. In each panel, the disc-galaxy model profile is drawn with a thick solid black line, and model profiles that were convolved with PSFV,0m (PSFK71) are drawn with thin black (grey) lines. The profile of the model that is convolved with the complete PSF is drawn with a thin solid line. Profiles are also shown where each PSF was truncated at rtr,1 (rtr,2) with a dotted line (dash-dotted line) in each panel; a) rtr,1 = 4″ and rtr,2 = 10″; b) rtr,1 = 10″ and rtr,2 = 25″; c) rtr,1 = 10″ (lines fall on top of the model line and are not visible) and rtr,2 = 250″ (Table 3). |
3.4. Application of the method on three example models
I calculated three example models of a small, an intermediate, and a large galaxy that are viewed edge on, at a high inclination angle, to illustrate consequences of using radially truncated PSFs. I varied the minor-axis scale height z0 and set hr = 5z0 and ns = 2. Each model was convolved with PSFK71 and an extrapolated PSFV,0m. Additionally, each model was convolved with either PSF, after the PSF was truncated at a smaller radius rtr,1 or a larger radius rtr,2. Model parameters and truncation radii rtr are given for each model in Table 3. The resulting minor-axis surface-brightness profiles are shown in Fig. 5. Values that are quoted in parentheses below used PSFK71, and the other values PSFV,0m.
Example model parameters.
3.4.1. The small galaxy
The convolved profiles show excess scattered light at all distances
 (Fig. 5a), whilst less light is seen at shorter distances (this decrease is
largely caused by the seeing-dominated part of the PSFs). The scattered-light halo of
the convolved model is too faint for z ≳ 4″ (
(Fig. 5a), whilst less light is seen at shorter distances (this decrease is
largely caused by the seeing-dominated part of the PSFs). The scattered-light halo of
the convolved model is too faint for z ≳ 4″ ( ) when the PSF is truncated at
rtr =
4″. The corresponding value for rtr = 10″ is
z ≳ 8″
(z ≳ 8″).
The surface-brightnesses that were calculated using the three versions of the truncated
PSFV,0m differ by up to 0.2 mag arcsec-2 at the centre,
due to the variations of the individual normalization of the PSFs. The correct amount of
scattered light at z =
15″ is only achieved when the PSF is not truncated within, say,
r ≈ 19″
(15″ × 10″/8″). Both PSFK71 and PSFV,0m are about 10 mag arcsec-2 fainter at
r = 15″,
compared to the centre. The model surface brightness is about 8.2 (6.6) mag arcsec-2 fainter than the
convolved structure at z =
12″; the signal-to-noise (S/N) value that would be required to
extract the intensity structure of the model structure is about 1900 (440). At
) when the PSF is truncated at
rtr =
4″. The corresponding value for rtr = 10″ is
z ≳ 8″
(z ≳ 8″).
The surface-brightnesses that were calculated using the three versions of the truncated
PSFV,0m differ by up to 0.2 mag arcsec-2 at the centre,
due to the variations of the individual normalization of the PSFs. The correct amount of
scattered light at z =
15″ is only achieved when the PSF is not truncated within, say,
r ≈ 19″
(15″ × 10″/8″). Both PSFK71 and PSFV,0m are about 10 mag arcsec-2 fainter at
r = 15″,
compared to the centre. The model surface brightness is about 8.2 (6.6) mag arcsec-2 fainter than the
convolved structure at z =
12″; the signal-to-noise (S/N) value that would be required to
extract the intensity structure of the model structure is about 1900 (440). At
 , the corresponding values are
3.7 mag
arcsec-2 and S/N ≈ 30 (2.1 mag arcsec-2 and
S/N ≈ 7).
, the corresponding values are
3.7 mag
arcsec-2 and S/N ≈ 30 (2.1 mag arcsec-2 and
S/N ≈ 7).
3.4.2. The intermediate-size galaxy
There is less excess light compared to the small galaxy near the centre, Fig. 5b. The convolved profiles show excess scattered light at all distances z ≳ 5″, and they overlap each other using either PSF for z ≲ 11″. When the PSF is truncated at rtr = 10″, there is an excess due to scattered light of only about 0.5 (0.2) mag arcsec-2 for z ≳ 10″. When the PSF is instead truncated at rtr = 25″, the convolved model becomes significantly fainter than the model that is convolved using the full PSF for z ≳ 16″ (z ≳ 18″). The correct amount of scattered light at, say, z = 40″ is only achieved when PSF is not truncated within, say, r = 65″ (40″ × 25″ / 16″). Compared to the centre, the PSF is about 12 (14) mag arcsec-2 fainter at r = 40″. The model surface brightness is about 7.3 (5.6) mag arcsec-2 fainter than the convolved structure at z = 30″, and the required S/N ≈ 830 (S/N ≈ 170); at z = 20″ the corresponding values are about 2.6 mag arcsec-2 and S/N ≈ 11 (1.4 mag arcsec-2 and S/N ≈ 3.6).
3.4.3. The large galaxy
Using either of the radially complete PSFs, the convolved model shows significant excess that is due to scattered light, beginning at z ≈ 120″, Fig. 5c. The halo is not reproduced at all when the PSF is truncated at rtr = 10″. The scattered-light halo of the convolved model is too faint for z ≳ 160″ when the PSF is truncated at r = 250″. The PSF is about 20 mag arcsec-2 fainter at r = 330″ than at the centre (see Fig. 1). To measure the modelled intensity at z ≃ 250″, which is about 4.1 mag arcsec-2 fainter than the scattered-light halo, the required S/N ≈ 44. The convolved profiles of the two PSFs nearly overlap since they are the same for r > 200″. It is important to note that the surface brightness of the model that is convolved with PSFK71 in Fig. 5c is brighter at large radii than in it is in Figs. 5a and 5b; this is expected, because, compared to where r ≲ 30″, the PSF is more shallow at larger radii.
3.4.4. Summarizing the results of the example models
The faintness of the PSF cannot be a limiting factor in accurate analyses of extended edge-on disc galaxies. It is instead the radial extent of the PSF that sets the limit on what can be corrected for. Not only small edge-on galaxies are strongly affected by scattered light, but also large galaxies, and time-dependent variations of the PSF cause variable structures.
The only way to remove scattered light, in the form of galaxy haloes, is through deconvolution with an accurately determined PSF and observations that, at least, cover all brighter regions at high enough S/N. However, the required accuracy in the measurements quickly becomes enormous with increasing vertical distances, and the required accuracy of the PSF cannot be lower than this, but is likely higher. It should, nevertheless, be safe to use a PSF with a radius that is twice as large as the maximum measured radius, accounting for symmetric objects. The tests above indicate that for these extended edge-on galaxies the minimum radial extent of the PSF is 1.5 times the outermost measured radius of the galaxy.
This study applies to already correctly determined surface-brightness structures and PSFs. Two factors that may play an important role to their determination are the assumed sky background level and scattered light from surrounding objects. Additionally, scattered light also affects the sky background. I show one example of how a slightly different value on the sky background changes the outcome of the analysis for observations of NGC 5907 in Sect. 4.
4. On observations of the edge-on galaxy NGC 5907
An extended faint halo was first found around an edge-on disc galaxy in R-band observations of NGC
5907 (Sackett et al. 1994; MBH94). Here, I re-examine
the observations in the visual wavelength range of this galaxy with a focus on the role of
integrated and time-varying scattered light. My analysis approach is to use both the
originally derived PSFMBH and vertical surface-brightness structure of MBH94, as
well as PSF
and a surface-brightness structure that I derived myself as a consistency check, using the
original data.
4.1. Original observations and the derivation of PSFMBH
The first observations of the halo of NGC 5907 by MBH94 were made using a Harris
R-band
filter with the Kitt Peak National Observatory No. 1 0.9 m telescope on 29 April 1990 and
30, as part of a five-night observing run. The two nights were photometric and the seeing
was  . LFD96 made follow-up observations of
NGC 5907 using the V-band filter with the Canada-France-Hawaii Telescope
at a seeing of 1″. The
telescope archive reveals that the observations were made on 3 to 7 June 1995. Zheng et al. (1999, hereafter ZSS99) observed NGC 5907
using a BATC 6660 Å filter with the Beijing Astronomical Observatory 0.6/0.9 m telescope
in 23 nights on 31 January to
27 June 1995. The seeing was about 4″. The filter bandwidth ratio of the R band (1380 Å) to the BATC 6660 Å band
(480 Å) is about
2.9, which corresponds to a
magnitude difference of −1.15 mag
arcsec-2, assuming a constant intensity across the
bandpass. The authors instead apply an offset of 0.3 mag arcsec-2 to the
R-band data
of MBH94, to match them with their 6660 Å-band data – the chosen value is not further
motivated.
. LFD96 made follow-up observations of
NGC 5907 using the V-band filter with the Canada-France-Hawaii Telescope
at a seeing of 1″. The
telescope archive reveals that the observations were made on 3 to 7 June 1995. Zheng et al. (1999, hereafter ZSS99) observed NGC 5907
using a BATC 6660 Å filter with the Beijing Astronomical Observatory 0.6/0.9 m telescope
in 23 nights on 31 January to
27 June 1995. The seeing was about 4″. The filter bandwidth ratio of the R band (1380 Å) to the BATC 6660 Å band
(480 Å) is about
2.9, which corresponds to a
magnitude difference of −1.15 mag
arcsec-2, assuming a constant intensity across the
bandpass. The authors instead apply an offset of 0.3 mag arcsec-2 to the
R-band data
of MBH94, to match them with their 6660 Å-band data – the chosen value is not further
motivated.
MBH94 determine that the error in the 15 sky frames that they use is 1760 ADU (analogue-to-digital unit), and the associated error is 5.1–10.3 ADU. They also derive PSFMBH, using two brighter field stars, which extends out to r = 116″; this PSF is shown in Fig. 1. Outside the seeing disc, PSFMBH lies above PSFV,0m and PSFV,3m for r ≲ 10″, is closer to PSFV,0m where 20 ≲ r ≲ 70″, and then turns upwards for larger radii. Additional details on the original observations of NGC 5907 are given in Appendix C.1.
4.2. Reconsidering the analysis of the original data
Two issues with the original study of MBH94 motivate a reassessed analysis of the measurements: the background in the field around the galaxy does not appear flat on large scales, and the integrated PSF is underestimated when diffraction spikes are masked. I made a detailed reconsideration of the analysis of the originally reduced data of MBH94, cf. Appendix C.2.
A flat background – at the level of a few counts – is important when measuring surface
brightnesses that are only slightly fainter than the sky. The new analysis revealed
PSF
that is brighter at larger radii than PSFMBH, see Fig. 1; it
is brighter because of a lower background value in the vicinity of the two saturated stars
that are used to derive the PSF. The value is only 3–4 ADU lower than the value that MBH94 seem to use, and is within the
error bars of their flat-field image (5.1–10.3
ADU). The new PSF
is also mostly within the error bars of PSFMBH. The difference between PSFMBH and
PSF
is about 0.5 mag
arcsec-2 for 40 ≲
r ≲ 60″.
The galaxy image is the result of the convolution with a PSF where diffraction spikes are present, therefore their contribution must not be removed from the PSF when it is used to correct object images for PSF effects. However, the difference due to masked diffraction spikes is small. A masked PSF is, when compared to an unmasked PSF, 0.1 mag arcsec-2 fainter at r ≃ 20″, this difference decreases to 0.0 mag arcsec-2 at r ≃ 40″.
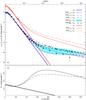 |
Fig. 6 Vertical-axis R-band and i-band surface-brightness profiles versus the vertical distance z of models and measurements of the edge-on galaxy NGC 5907. a) Blue and purple lines show R-band profiles, and red lines i-band profiles. Model profiles are drawn with thick solid lines. Solid (dash-dotted) lines are profiles of convolved models using PSFV,0m and PSFi,0m (PSFV,3m and PSFi,3m), the purple line used PSFK71. Three different symbols and error bars show measured values: •R band (Sackett et al. 1994; MBH94), ⋆V band (LFD96), and from profiles on both sides of the disc °6660 Å band (ZSS99). The R-band model was convolved with the measured PSFMBH (including lower and upper errors) to produce the white line (cyan-coloured region). The lower limiting radius r110 – where the convolved models using PSFV,0m, PSFi,0m, and PSFK71 lie ≥ 10 per cent above the input model – is marked with a coloured bullet with a black border. b) Three colour profiles R − i are shown for: the model (thick solid line), the convolved model using PSFV,0m and PSFi,0m (solid line), and the convolved model using PSFV,3m and PSFi,3m (dash-dotted line). |
4.3. Models of the surface-brightness structure
I modelled NGC 5907 with hr = 90″,
z0 =
15″, ns = 2, and assumed D = 11.7 Mpc. In
comparison, MBH94 use the values hr = 90″ and
z0 =
16″ (which corresponds to  ; they specify all parameters in kpc and
assume D = 11
Mpc). Model and observed vertical-axis profiles are shown in Fig. 6a, and corresponding R − i
colour profiles in Fig. 6b. The five PSFs that are
used in the R
band cause intensity (colour) differences of up to 1.5 (0.3) mag arcsec-2 at r = 70″. At the same radius
the surface-brightness (colour) profiles of the convolved models are 2.2–3.7 (0.96–1.5)
mag arcsec-2
brighter than the input model value. The R-band (Sackett et
al. 1994), 6660
Å-band (ZSS99), and V-band (LFD96) measurements fall between the
convolved profiles of PSFV,0m and PSFV,3m throughout
most of the radial range. V-band and R-band data nearly overlap where r ≲ 30″, and differ by up
to about 1 mag
arcsec-2 at larger radii in the halo.
; they specify all parameters in kpc and
assume D = 11
Mpc). Model and observed vertical-axis profiles are shown in Fig. 6a, and corresponding R − i
colour profiles in Fig. 6b. The five PSFs that are
used in the R
band cause intensity (colour) differences of up to 1.5 (0.3) mag arcsec-2 at r = 70″. At the same radius
the surface-brightness (colour) profiles of the convolved models are 2.2–3.7 (0.96–1.5)
mag arcsec-2
brighter than the input model value. The R-band (Sackett et
al. 1994), 6660
Å-band (ZSS99), and V-band (LFD96) measurements fall between the
convolved profiles of PSFV,0m and PSFV,3m throughout
most of the radial range. V-band and R-band data nearly overlap where r ≲ 30″, and differ by up
to about 1 mag
arcsec-2 at larger radii in the halo.
For 30 ≲ r ≲
95″, the halo that MBH94 measure is up to about 1 mag arcsec-2 brighter than the
model that was convolved with PSFMBH. According to the authors, the halo is not scattered
light. However, the conclusion is different with PSFMBH using its upper error bars,
and with PSF,
which convolved models nearly overlap all measured values, but the two ones at
r = 74″ and
r = 83″.
The upturn in the outer part of PSFMBH and PSF
causes a shelf of nearly constant brightness in the convolved model profile where
80 ≲ r ≲
115″ – there is no corresponding shelf in the measurements3. Considering the difficulties in measuring
PSF
accurately at both smaller and larger radii (Sect. C.2), it cannot be excluded that all of the measurements can be explained as
scattered light. PSF
is particularly noisy in the range 70 ≲
r ≲ 95″, which delimits the accuracy of the two
values that are brighter than the convolved model. Under the assumption that the
measurements are scattered light, at z = 70″ the required S/N of the measurements to
measure the 2.5 mag
arcsec-2 fainter input model is 10. The accuracy requirement
quickly grows to enormous values at larger distances, where it is impossible to measure
the exponential structure (also see Sect. 3.4).
According to ZSS99, the 0.3 mag arcsec-2 offset, which they adopt between the R-band and the 6660 Å-band measurements, occurs due to different filter bandwidths. Under the assumption that the halo is scattered light, varying PSFs justify deviating measurements, also the 1 mag arcsec-2 fainter V-band measurements of LFD96. I have no J-band or K-band PSFs to model the near-infrared observations of Rudy et al. (1997) or James & Casali (1998), but the PSFs of these bands – as measured with, for example, data of the 2MASS Large Galaxies Atlas (Jarrett et al. 2003, where observations were made at Mt. Hopkins in Arizona and the Cerro Tololo Inter-American Observatory) – are even brighter at larger radii than the I-band PSF (Michard 2007), and scattered-light effects are therefore even stronger.
The R − i colour profiles of the convolved models in Fig. 6b show red excess where z> 18″, in qualitative agreement with the V − I profile of LFD96 (see their Fig. 3). The difference between the colour profiles that were derived using PSFV,0m and PSFi,0m, versus PSFV,3m and PSFi,3m, illustrate that derived colours in the halo, which is dominated by scattered light, completely depend on the PSFs in the used bandpasses. Whilst PSFV,0m and PSFi,0m contain fainter wings than PSFV,3m and PSFi,3m, their radial difference is greater, which result in more red excess in the halo.
5. Discussion and conclusions
I have presented a first detailed overview and comparison of already measured radially extended PSFs, since the first summary of K71 and the more recent summary of B07. The overview demonstrates that all PSFs are expected to continue to large radii (angles), and that our knowledge is poor of how the PSF varies with the time and the wavelength, in particular at large radii. de Vaucouleurs (1958) and later K71 (amongst a few others), find that the PSF declines as an r-2 power-law at large distances. B07 presents a summary of PSFs to show that various measurements contradict the use of a general r-2 slope. I have normalized all PSFs and put them in the same plot, and the result shows no evidence against an r-2 power-law slope at large radii. Instead, several radially extended measurements point at a more shallow decline. There is one exception, the PSF of Abraham & van Dokkum (2014), which is measured with the only configuration that uses refractive instead of reflective optics. Encircled energy plots show significant amounts of light in the far wings of the PSF, and there is currently no clear correspondence between the amount of encircled energy in the outer parts of the PSF and atmospheric extinction.
Early studies measured the outer parts of the PSF with observations of planets, the Moon, and the Sun, instead of using (only) stars. I have shown that extended objects can be regarded as point sources, beginning at a geometry-dependent radius. Complementary observations of these comparatively bright objects will make possible more accurate measurements of varying and radially extended PSFs. An additional point of concern that I have not addressed here, is how the PSF changes across the surface, away from the optical axis (SHM09); new PSF measurements need to take such issues into account as well.
I have studied the role of scattered light to shape the surface-brightness structure of three models of edge-on disc galaxies; the model set consisted of a small galaxy, an intermediate-sized galaxy, and a large galaxy, which all contain a single thin disc. I have used PSFK71 (K71) as a lower limit, and PSFV,0m (Michard 2002) as a slightly-above average indicator of scattered-light effects. The results show that in the case of edge-on galaxies it is necessary to use a PSF that extends to at least 1.5 times the measured radius, regardless of the size of the galaxy, or the measurements cannot be corrected; it seems that it would be safe, for any measurement, to use a PSF of twice the measured radius. It is notable that the requirements on the accuracy of the measurements at large vertical distances quickly becomes insurmountable to measure an underlying exponential component.
Surface-brightness profiles of edge-on galaxies are divided into four components: a centre bulge, a thin disc, a thick disc, and a halo. The first faint diffuse halo around an edge-on disc galaxy was found around the Sc-type NGC 5907. Examples of explanations to the origin of the halo include that it traces the dark-matter halo (Sackett et al. 1994), and that parts or all matter in the halo could be low-mass stars (Sackett et al. 1994; LFD96). Zepf et al. (2000) find one halo star in their HST H-band observations of NGC 5907, instead of the expected 100; they favour a stellar population with a very high dwarf-to-giant ratio to explain the halo. Yost et al. (2000) present near-infrared observations from above the Earth atmosphere, and rule out hydrogen-burning stars as a possible cause of the halo. Shang et al. (1998), ZSS99, and Martínez-Delgado et al. (2008) discover and discuss comparatively faint stellar tidal streams that extend far out from NGC 5907 on its north-east and south-west sides. The influence of the tidal streams on the results presented here is minor, despite that the streams partly overlap the regions that are used to measure the galaxy profile and the PSFs; the reason is that the relative intensity between the streams and the background is very small, and even smaller than the errors in the reduced image of MBH94. ZSS99 also find that vertical surface-brightness structures away from the minor axis are asymmetric, and conclude that the halo is not real, but is contaminated by light from the stream and residual light from field stars. They do not consider scattered light from the galaxy itself.
Scattered light was dismissed as an explanation to the halo by MBH94 after a careful
analysis of the PSF, which later studies of this galaxy do not address with as much care. I
have reassessed the original analysis of NGC 5907, regarding the role of scattered light,
and I have come to the conclusion that it likely is the major reason to the appearance of
the halo. Specifically, I have analysed the influence of the variations in the galaxy
background. I have lowered the background value by 3 ADU (0.17%), compared to the value that
was seemingly used to measure the extended original PSFMBH. I have then measured a
significantly brighter PSF,
where the new PSF is still mostly within the error bars of PSFMBH. MBH94 quote the accuracy of
their sky data as 10.3 ADU,
which is more than three times as large as the background offset that I applied. The new
finding illustrates the high accuracy that is required of both the PSF and the measurements
when dealing with scattered light.
Finally, the R − i colour profiles of the scattered-light dominated halo of the models show very strong red excess, which is all caused by the shape of the PSFs. Notably, J08 comes to the same conclusion, based on models that are convolved with less extended PSFs. It seems that the CCD-specific red-halo effect (Sirianni et al. 1998) plays a strong role to enhance the red excess in the i band.
I emphasize that the object asymmetry and the varying background complicate the modelling.
Measurements of other authors of NGC 5907 agree with this conclusion. In particular, it
appears that the observations of LFD96 were made with a fainter V-band PSF that is similar to
PSFK71, whilst
PSF
is brighter than PSFV,0m throughout most of the radial range.
Assuming that the halo is induced by the PSF, there is also no argument against a larger
offset value between the R and the 6660 Å bandpasses that ZSS99 use. In view of
the alternative explanations to the bright measurements in the halo of NGC 5907, the one of
scattered light is simple, and does not require any exotic stellar populations. Despite very
small adjustments to values that were used in the analysis, the impact on physical results
is large.
With his study on two sets of smaller edge-on galaxies, J08 points out that effects of scattered light in observations of edge-on disc galaxies can be significant. The conclusion of this paper is that these effects can be even stronger – faint regions around edge-on galaxies of all sizes are affected by scattered light. I have indicated that PSFs generally vary with time and wavelength, and that also their faint outer wings contribute significantly to observed structures. The question is, in view of this new awareness, how observations of astronomical objects and their faint structures in general are affected by scattered light? In a second paper, I will study the influence of scattered light on a larger set of models and observations of different types of galaxies.
The exact difference is unimportant to the demonstration here, where the main point is to illustrate the spatial dependence of the colour profile. All colour profiles are offset by the same value.
dexter is available at: http://dexter.sourceforge.net
It was necessary to extrapolate PSFMBH and PSF
with a decreasing slope outside their largest radii to avoid positive slopes in the outer
regions of convolved model profiles.
The Tiny Tim website at the STScI: http://tinytim.stsci.edu
The ACS instrument handbook is available at: http://www.stsci.edu/hst/acs/documents/handbooks/current/cover.html
Acknowledgments
I am most grateful to H. Morrison, who provided me with the originally reduced images of NGC 5907. I thank R. Abraham for sending me the Dragonfly Array PSF data. I thank A. Partl, A. Monreal-Ibero, R. de Jong, C. Vocks, and M. M. Roth for comments on the manuscript. This research was supported by funds of PTDESY-05A12BA1.
References
- Abraham, R. G., & van Dokkum, P. 2014, PASP, 126, 935 [Google Scholar]
- Beckwith, S. V. W., Stiavelli, M., Koekemoer, A. M., et al. 2006, AJ, 132, 1729 [NASA ADS] [CrossRef] [Google Scholar]
- Bergvall, N., Zackrisson, E., & Caldwell, B. 2010, MNRAS, 405, 2697 [NASA ADS] [Google Scholar]
- Bernat, A. P., & Lambert, D. L. 1975, ApJ, 201, L153 [NASA ADS] [CrossRef] [Google Scholar]
- Bernstein, R. A. 2007, ApJ, 666, 663 (B07) [NASA ADS] [CrossRef] [Google Scholar]
- Brown, G. S. 1978, in Modern Techniques in Astronomical Photography, eds. R. M. West, & J. L. Heudier (Geneva: ESO), 169 [Google Scholar]
- Capaccioli, M., & de Vaucouleurs, G. 1983, ApJS, 52, 465 (CV83) [NASA ADS] [CrossRef] [Google Scholar]
- Corradi, R. L. M., Schönberner, D., Steffen, M., & Perinotto, M. 2003, MNRAS, 340, 417 [NASA ADS] [CrossRef] [Google Scholar]
- de Jong, R. S. 2008, MNRAS, 388, 1521 (J08) [NASA ADS] [Google Scholar]
- de Vaucouleurs, G. 1948, Ann. Astrophys., 11, 247 [Google Scholar]
- de Vaucouleurs, G. 1953, MNRAS, 113, 134 [NASA ADS] [CrossRef] [Google Scholar]
- de Vaucouleurs, G. 1958, ApJ, 128, 465 [NASA ADS] [CrossRef] [Google Scholar]
- de Vaucouleurs, G., & Capaccioli, M. 1979, ApJS, 40, 699 [NASA ADS] [CrossRef] [Google Scholar]
- Deirmendjian, D. 1957, Ann. Geophys., 13, 286 [Google Scholar]
- Deirmendjian, D. 1959, Ann. Geophys., 15, 218 [Google Scholar]
- Demleitner, M., Accomazzi, A., Eichhorn, G., et al. 2001, in ADASS X, eds. F. R. Harnden, Jr., F. A. Primini, & H. E. Payne (San Francisco: ASP), ASP Conf. Ser., 238, 321 [Google Scholar]
- Feldmeier, J., Hagen, A., Ciardullo, R., et al. 2013, ApJ, 776, 75 [NASA ADS] [CrossRef] [Google Scholar]
- Gonzalez, A. H., Zabludoff, A. I., & Zaritsky, D. 2005, ApJ, 618, 195 [Google Scholar]
- GonzálezDelgado, D., Olofsson, H., Schwarz, H. E., Eriksson, K., & Gustafsson, B. 2001, A&A, 372, 885 [NASA ADS] [CrossRef] [EDP Sciences] [Google Scholar]
- Gustafsson, B., Eriksson, K., Kiselman, D., Olander, N., & Olofsson, H. 1997, A&A, 318, 535 [NASA ADS] [Google Scholar]
- Hasan, H., & Burrows, C. J. 1995, PASP, 107, 289 [NASA ADS] [CrossRef] [Google Scholar]
- Idiart, T. P., Michard, R., & de Freitas Pacheco, J. A. 2002, A&A, 383, 30 [NASA ADS] [CrossRef] [EDP Sciences] [Google Scholar]
- James, P. A., & Casali, M. M. 1998, MNRAS, 301, 280 [NASA ADS] [CrossRef] [Google Scholar]
- Jarrett, T. H., Chester, T., Cutri, R., Schneider, S. E., & Huchra, J. P. 2003, AJ, 125, 525 [NASA ADS] [CrossRef] [Google Scholar]
- King, I. R. 1971, PASP, 83, 199 (K71) [NASA ADS] [CrossRef] [Google Scholar]
- Kormendy, J. 1973, AJ, 78, 255 [NASA ADS] [CrossRef] [Google Scholar]
- Krisciunas, K., & Schaefer, B. E. 1991, PASP, 103, 1033 [Google Scholar]
- Krist, J. E. 1995, in Proc. Calibrating Hubble Space Telescope, Post Servicing Mission, eds. A. P. Koratkar, & C. Leitherer (Baltimore: Space Telescope Science Institute), 311 [Google Scholar]
- Krist, J., & Burrows, C. 1992, in WFPC2 Instrument Science Report, Tech. Rep. (Space Telescope Science Institute), 94-01 [Google Scholar]
- Krist, J. E., Hook, R. N., & Stoehr, F. 2011, in Optical Modeling and Performance Predictions V., ed. M. A. Kahan (Bellingham: SPIE), Proc. SPIE, 8127, 0J [Google Scholar]
- Lequeux, J., Fort, B., Dantel-Fort, M., Cuillandre, J.-C., & Mellier, Y. 1996, A&A, 312, L1 (LFD96) [NASA ADS] [Google Scholar]
- Mackie, G. 1992, ApJ, 400, 65 [NASA ADS] [CrossRef] [Google Scholar]
- Martínez-Delgado, D., Peñarrubia, J., Gabany, R. J., et al. 2008, ApJ, 689, 184 [NASA ADS] [CrossRef] [Google Scholar]
- Mauron, N., & Caux, E. 1992, A&A, 265, 711 [NASA ADS] [Google Scholar]
- Michard, R. 1953, Ann. Astrophys., 16, 217 [NASA ADS] [Google Scholar]
- Michard, R. 2002, A&A, 384, 763 [NASA ADS] [CrossRef] [EDP Sciences] [Google Scholar]
- Michard, R. 2007, A&A, 464, 507 [NASA ADS] [CrossRef] [EDP Sciences] [Google Scholar]
- Middlemass, D., Clegg, R. E. S., & Walsh, J. R. 1989, MNRAS, 239, 1 [NASA ADS] [CrossRef] [Google Scholar]
- Monreal-Ibero, A., Roth, M. M., Schönberner, D., Steffen, M., & Böhm, P. 2006, New A Rev., 50, 426 [Google Scholar]
- Morrison, H. L., Boroson, T. A., & Harding, P. 1994, AJ, 108, 1191 (MBH94) [NASA ADS] [CrossRef] [Google Scholar]
- Örndahl, E., Rönnback, J., & van Groningen, E. 2003, A&A, 404, 883 [NASA ADS] [CrossRef] [EDP Sciences] [Google Scholar]
- Patat, F. 2003, A&A, 400, 1183 [Google Scholar]
- Piccirillo, J. 1973, PASP, 85, 278 [NASA ADS] [CrossRef] [Google Scholar]
- Pierce, A. K. 1954, ApJ, 120, 221 [NASA ADS] [CrossRef] [Google Scholar]
- Plez, B., & Lambert, D. L. 1994, ApJ, 425, L101 [NASA ADS] [CrossRef] [Google Scholar]
- Racine, R. 1996, PASP, 108, 699 [NASA ADS] [CrossRef] [Google Scholar]
- Redman, R. O., & Shirley, E. G. 1938, MNRAS, 98, 613 [NASA ADS] [CrossRef] [Google Scholar]
- Rönnback, J., van Groningen, E., Wanders, I., & Örndahl, E. 1996, MNRAS, 283, 282 [NASA ADS] [CrossRef] [Google Scholar]
- Rudy, R. J., Woodward, C. E., Hodge, T., Fairfield, S. W., & Harker, D. E. 1997, Nature, 387, 159 [NASA ADS] [CrossRef] [Google Scholar]
- Sackett, P. D., Morrison, H. L., Harding, P., & Boroson, T. A. 1994, Nature, 370, 441 [NASA ADS] [CrossRef] [Google Scholar]
- Sandin, C., Schönberner, D., Roth, M. M., et al. 2008, A&A, 486, 545 [NASA ADS] [CrossRef] [EDP Sciences] [Google Scholar]
- Shang, Z., Zheng, Z., Brinks, E., et al. 1998, ApJ, 504, L23 [NASA ADS] [CrossRef] [Google Scholar]
- Shectman, S. A. 1974, ApJ, 188, 233 [NASA ADS] [CrossRef] [Google Scholar]
- Sirianni, M., Clampin, M., Hartig, G. F., et al. 1998, in Optical Astronomical Instrumentation, ed. S. D’Odorico (Bellingham: SPIE), Proc. SPIE, 3355, 608 [Google Scholar]
- Sirianni, M., Jee, M. J., Benítez, N., et al. 2005, PASP, 117, 1049 [NASA ADS] [CrossRef] [Google Scholar]
- Slater, C. T., Harding, P., & Mihos, J. C. 2009, PASP, 121, 1267 (SHM09) [NASA ADS] [CrossRef] [Google Scholar]
- Surma, P., Seifert, W., & Bender, R. 1990, A&A, 238, 67 [NASA ADS] [Google Scholar]
- Tal, T., & van Dokkum, P. G. 2011, ApJ, 731, 89 [NASA ADS] [CrossRef] [Google Scholar]
- Tziamtzis, A., Schirmer, M., Lundqvist, P., & Sollerman, J. 2009, A&A, 497, 167 [NASA ADS] [CrossRef] [EDP Sciences] [Google Scholar]
- Uson, J. M., Boughn, S. P., & Kuhn, J. R. 1991, ApJ, 369, 46 [NASA ADS] [CrossRef] [Google Scholar]
- van de Hulst, H. C. 1948, in The Atmospheres of the Earth and Planets, ed. G. P. Kuiper (Chicago: The University of Chicago Press), 49 [Google Scholar]
- van der Kruit, P. C. 1988, A&A, 192, 117 [NASA ADS] [Google Scholar]
- van der Kruit, P. C., & Searle, L. 1981, A&A, 95, 105 [NASA ADS] [Google Scholar]
- Wisotzki, L., Schechter, P. L., Bradt, H. V., Heinmüller, J., & Reimers, D. 2002, A&A, 395, 17 [NASA ADS] [CrossRef] [EDP Sciences] [Google Scholar]
- Wu, H., Burstein, D., Deng, Z., et al. 2002, AJ, 123, 1364 [NASA ADS] [CrossRef] [Google Scholar]
- Yost, S. A., Bock, J. J., Kawada, M., et al. 2000, ApJ, 535, 644 [NASA ADS] [CrossRef] [Google Scholar]
- Zepf, S. E., Liu, M. C., Marleau, F. R., Sackett, P. D., & Graham, J. R. 2000, AJ, 119, 1701 [NASA ADS] [CrossRef] [Google Scholar]
- Zheng, Z., Shang, Z., Su, H., et al. 1999, AJ, 117, 2757 (ZSS99) [NASA ADS] [CrossRef] [Google Scholar]
- Zibetti, S., White, S. D. M., & Brinkmann, J. 2004, MNRAS, 347, 556 [NASA ADS] [CrossRef] [Google Scholar]
Appendix A: About HST PSFs
PSFs that are measured with the HST – and other space-based telescopes – are less affected by dust and the Earth atmosphere than PSFs of ground-based telescopes, and they are often much more compact. The tool Tiny Tim (Krist et al. 2011) was created to provide model PSFs for all instruments and most observing modes of the HST. The tool, its documentation, and additional information are available on the project website4. Tiny Tim makes a best effort to account for all factors in the optical path that affect the PSF (see the Tiny Tim user guide). The resulting PSFs are many times of good quality, considering that many of these factors vary with time or field position. One comment below the “Performance” section on the project website is relevant to this study: This is a highly important comment, considering that in this paper I demonstrate the decisive influence of the outer faint regions of the PSF to induce haloes and affect colour profiles.
I mention additional content of two sections in the Tiny Tim user guide (version 6.3) that are related to this issue. Light is scattered into the outer regions of the PSF of the second Wide Field and Planetary Camera (WFPC2; Krist & Burrows 1992; Krist 1995); outer regions of the PSF will be underestimated since this effect is not included in Tiny Tim. Furthermore, due to a defect in the High-Resolution CCD (HRC) of the Advanced Camera for Surveys (ACS), a halo is created that surrounds the PSF for wavelengths λ> 600 nm; Tiny Tim provides a first estimate of the halo effect. In the ACS instrument handbook5, the halo is said to appear for λ> 700 nm (HRC) and λ> 900 nm (wide-field camera, WFC).
Sirianni et al. (2005) present measurements of the
ACS PSFs where they consider  a safe extent to measure all flux
within an “infinite” aperture; they treat all filters of both the HRC and the WFC. I show
in Sect. 3.4 how important it is to use a PSF that
is not truncated or underestimated at large radii, and I advocate the use of a PSF that is
at least 1.5 times as extended as the vertical distance of the edge-on galaxy. It would be
valuable to see how an extension of the PSF to, say, r = 10″ would affect
integrated scattered light in a study that is similar to what I present here for
ground-based telescopes – this would show if radially extended PSFs make any difference
also with HST data.
a safe extent to measure all flux
within an “infinite” aperture; they treat all filters of both the HRC and the WFC. I show
in Sect. 3.4 how important it is to use a PSF that
is not truncated or underestimated at large radii, and I advocate the use of a PSF that is
at least 1.5 times as extended as the vertical distance of the edge-on galaxy. It would be
valuable to see how an extension of the PSF to, say, r = 10″ would affect
integrated scattered light in a study that is similar to what I present here for
ground-based telescopes – this would show if radially extended PSFs make any difference
also with HST data.
Appendix B: Details of the extrapolation and normalization of the PSFs discussed
I extrapolated PSFK71, PSFV,0m, and PSFV,3m to r = 90°, assuming a power-law dependence r-2; in agreement with the existing outer parts of PSFK71, PSFP73(▴), and PSFS09. Studies that report on contradicting slopes present a noisy outer PSF that does not extend very far (PSFB07, SDSS PSFs).
The spectroscopic PSFP,LR (seeing ) does not extend far; it was
extrapolated with PSFCV, as the two PSFs match well in the range 4 ≤ r ≤ 25″. I could shift
three PSFs precisely, with available information on how they overlap other PSFs:
PSFK73,
PSFP73 (which
triangle-symbol points overlap the aureole line of PSFK71), and PSFV,0m.
PSFV,3m, PSFi,0m, and
PSFi,3m are fixed relative to
PSFV,0m. PSFS09 is not measured at small
radii, which is why I offset it by +0.25 mag
arcsec-2, to match it with the other PSFs, the true value
could be slightly lower or higher. Abraham & van
Dokkum (2014) fix the offset between PSFA14 and PSFS09, I used the same value. I
offset the SDSS PSFs by hand, to have them agree with the integrated PSFs. These PSFs are
poorly determined near their outer limit at r ≃ 30–60″, which makes an accurate extrapolation to larger radii difficult.
PSFMBH is also
poorly determined at large radii; I offset it by −13.6 mag arcsec-2 to have this
large-seeing PSF slightly fainter at the centre than PSFV,0m. I used the
same offset with PSF.
The measurements of PSFS74 and PSFM92 were offset by −7 mag arcsec-2 to overlap PSFK71, and all three versions of PSFG05 were offset by −12 mag arcsec-2 to overlap PSFi,0m. These three PSFs were not measured in the centre, and the true offsets could be both slightly larger and slightly smaller. Finally, the (centred) PSFB07 was offset to agree with PSFK71 in the centre region.
Appendix C: Details of the analysis of NGC 5907
This section contains supplementary details to the discussion of the original analysis and the reconsidered analysis of NGC 5907 in Sect. 4.
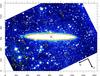 |
Fig. C.1 Originally reduced image of MBH94 for NGC 5907, shown with a colour map that emphasizes the variations of the background field (their Fig. 1b). The unit of the axes is pixels. The galaxy centre position used is marked with an ×. Two sets of green circles indicate the distance at 100 and 150 px away from the two saturated stars 1 and 2. The positions of five bright stars (twelve regions that were used to measure the background) are indicated with markers and a number (circles and a character), cf. Table C.2 (Table C.1). |
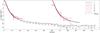 |
Fig. C.2 PSFs derived from the reduced R-band image of NGC 5907 (Fig. C.1). The azimuthal average is drawn as magnitude
versus radius. The left-hand set of lines used individually set background values.
The set of lines that are offset by 60′′ were all derived using the background value
1760 ADU. PSFMBH is drawn with a dotted line, together with its
error bars. The saturated-star PSFs are drawn with solid black (1) and dash-dotted
(2) lines – PSF |
Appendix C.1: Details of the original observations
To make possible a careful flat fielding of their data, MBH94 took 22 1800 s exposures of the sky during the five nights of the observing run; these sky regions were offset some 1° from the galaxies of their study. Out of the 22 frames they use 15 frames that are judged to be free from bright stars or defects that could compromise the flat field. The sky frames have about 1760 ADU per pixel, which ought to produce a flatfield where pixel-to-pixel errors are smaller than about 0.29 per cent (5.1 ADU). They make a more detailed error model of the sky, and derive an error of the rotated and shifted sky-image pixels as 0.60 per cent (10.5 ADU), which agrees well with their empirically measured value 0.59 per cent (10.3 ADU).
MBH94 use several bright, but not saturated, stars, to measure the inner parts of a PSF. They measure the outer PSF with the two bright and saturated stars that are seen to the lower left of the galaxy disc in their Fig. 1; their figure is reproduced here in Fig. C.1. To this end they prepare and apply a mask that removes all stars, diffraction spikes, and background galaxies in the field around each star. The unmasked pixels are averaged in radial annuli around the centre, starting at r = 20 px. The resulting PSFMBH is reproduced in Fig. 1 (and also with its error bars in Fig. C.2), it extends out to r = 116″.
Later, LFD96 claim to measure a PSF that reaches 10-7 of the peak intensity at r = 16″ (the PSF is not published). This PSF is likely incorrectly measured, as it is (along with the SDSS PSFs of Zibetti et al. 2004) much steeper than any of the other PSFs in Figs. 1 and 2. ZSS99 also claim to derive a PSF, but there is no information about how far radially and deeply it extends.
The vertical surface-brightness structure of NGC 5907 is measured after dust and stars are masked, and remaining pixels are averaged in 100 pixel wide strips, which heights change exponentially from 5 px near the major axis to a maximum of 99 px at the vertical distance z = 160″. The mask they use is shown in Fig. 3 in MBH94.
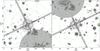 |
Fig. C.3 Contour plots of the two saturated stars a) 1 and b) 2 in Fig. C.1, where masked regions are marked in grey. The grey tilted crosses indicate the masked diffraction spikes. The green circles mark the radii 100 and 150 px. |
Appendix C.2: Details of the reconsidered analysis
Following the approach of MBH94, I derived a PSF by averaging unmasked pixels in radial annuli around the centre of bright stars. Whilst MBH94 quote a background value of 1760 ADU in the sky image, that value does not seem to apply in all parts of the galaxy image. To quantify the differences I measured background values in different regions in Fig. C.1; image statistics of twelve regions a–l are shown in Table C.1. In the same table I also marked whether the respective region falls on top of the tidal streams around NGC 5907, as are visible in Martínez-Delgado et al. (2008).
This test shows slightly lower values on the left-hand side of the image, and near the two saturated stars. As a compromise, I estimated that the average background of the regions a, d, and e near the lower saturated star (2) is 1759 ADU. This value is a bit uncertain, and it is possible that it varies by, say, about 2 ADU in the radial range away from each saturated star. The same values also illustrate the difficulties in measuring a PSF at the level of the background with these data, in particular for radii r ≳ 100 px where all three background regions fall inside the measured region; here, scattered light from star 2 makes these values higher than the sky background. The two stars are also situated right next to a tidal stream around NGC 5907 (compare the position of region d with Fig. 2 in Martínez-Delgado et al. 2008), but this is not obvious when comparing the values of the separate regions.
The background is brighter on the right-hand side of the image, where I measured 1759.5–1764.2 ADU in the regions g, i, j, and k. None of these regions falls directly on top of a tidal stream. For comparison, in the other parts of the galaxy, MBH94 measure a lower value in the region that is offset by 100 px (4.1 kpc) to the left of the galaxy centre, which they attribute a flat-fielding defect. In this region, f, I measured the mean value 1761.8 ADU, which is slightly lower than in the regions j and k, but still significantly higher than the mean value 1759 ADU around the lower saturated star 2. All background values that are quoted here fall within the statistical accuracy of 5–10 ADU.
I derived a PSF for five bright stars in Fig. C.1, using both 1760 ADU and an individually selected value as background, cf. Table C.2; the PSF of each of these relatively faint stars is only useful out to an approximative radius that I refer to as rmax. I also derived more extended PSFs for the same saturated stars as MBH94. The brighter contour levels and the regions that I masked around these two stars are shown in Fig. C.3. The original PSFMBH is shown together with the new PSFs of all seven stars in Fig. C.2.
PSFs that are measured in different parts of the image should overlap (neglecting spatial differences across the field such as reported by SHM09, and which magnitudes are in any case unknown here). The PSFs of stars 1 and 2 are slightly closer to PSFMBH when the background value 1760 ADU is used, and they nearly overlap when the value is instead 1762 ADU (not shown). The PSF of star 3, which is located above the galaxy disc in Fig. C.1, lies above the other PSFs in the region r ≳ 5″. It overlaps the other PSFs better when the background is set to 1762 ADU, which seems to be an appropriate background value in the neighbourhood of this star. The stars 4 and 6 are located right and below of the galaxy disc; their PSFs seem to overlap the other PSFs using the background value 1760 ADU. The stars 5 and 7 are located to the left side of the galaxy disc. The background level of both these stars seems to be closer to 1758 ADU, as in this case they overlap the PSFs of stars 1 and 2. The background values are low, even though both stars lie directly on top of a tidal stream. Both PSFs are markedly fainter if the value 1760 ADU is used instead.
The PSFs of stars 1 and 2 overlap each other closely for r<
70″. For larger radii the surface-brightness slope is positive; the
overestimated measurements are there influenced by the PSF wings of other field stars as
well as the varying background. The same conclusion applies as a plausible cause to the
upwards slope in the outermost parts of PSFMBH. The two PSFs are about 0.5 mag arcsec-2 brighter than
PSFMBH at both
r = 40″
and r =
60″. Their average, PSF,
is poorly determined for r> 70″. It is worth
noting that the fainter parts of the surface-brightness structure of NGC 5907 depend on
these far regions of the PSF.
The entire difference between PSFMBH and PSF
occurs due to a background level that is 3–4 ADU (0.17−0.23 per cent) lower than the value that
MBH94 appear to use (1762−1763 ADU). This test indicates the high accuracy that is required in
the background to derive a PSF with the two used relatively faint stars; it is higher
than the expected accuracy of the flatfield image they use, 5–10 ADU
(0.29−0.59 per cent). The
data and the resulting PSF
are not accurate enough to deconvolve the galaxy measurements accurately. The
reconsidered PSF
is also drawn in Fig. 1.
To test the influence of masking or not masking the diffraction spikes, I calculated an additional PSF where these were masked (the affected regions are indicated by the tilted cross in Fig. C.3). This test shows that the difference due to the diffraction spikes is small. The masked PSF is about 0.1 mag arcsec-2 fainter than the unmasked PSF at r = 22″, which decreases to near zero at r = 40″ (not shown).
For completeness, I calculated a vertical surface-brightness profile below (east-north-east of) the galaxy disc that is nearly identical to that of MBH94; to this effect I set the galaxy centre to (x,y) = (827,631) px (this position is indicated in Fig. C.1), the background value to 1760 ADU, and used the same mask. A slightly different profile results if the galaxy centre is instead set to the peak of the surface-brightness profile at (x,y) = (827,628) px. The galaxy surface-brightness structure is, moreover, not perfectly symmetric due to (horizontal) dust lanes, which are present in particular above the galaxy disc (these cannot be seen in Fig. C.1). Tidal streams above the galaxy (see Fig. 2 in Martínez-Delgado et al. 2008) plausibly contribute to the asymmetry as well. The vertical profile that is measured above the disc, furthermore, differs slightly from the profile that is measured below the disc. Also, the used mask is unable to account for extended wings of the PSFs of numerous field stars around the galaxy and near the two saturated stars. However, as in the case of the two saturated stars, the biggest uncertainty to the (outer parts of the) galaxy profile is also here the background value, and the other effects are secondary to this effect. Therefore, in the discussion in Sect. 4.3, I used the profile of MBH94.
All Tables
All Figures
|
Fig. 1 PSF surface-brightness profiles versus the radius r for a 0 mag point source. Individual PSFs are drawn with coloured lines and symbols as indicated in the figure, see also Table 1. PSFs of stacked SDSS images are shown in the upper part of the figure, as a function of 103 × r; PSFV,0m, PSFi,0m, and the outer regions of PSFK71 are shown in both parts as references. Extrapolated PSFs are shown with dotted lines. The light (medium) grey region indicates the PSF core (blue sky) and the white region the aureole, as defined for PSFCV,1 and PSFCV,2 (CV83). |
| In the text | |
|
Fig. 2 PSF surface-brightness profiles versus the radius r for a 0 mag point source, from references that are discussed by B07. Individual PSFs are drawn with coloured lines and symbols as indicated in the figure, see also Table 1. PSFK71, PSFV,0m, PSFi,0m, and PSFCV,2 are shown in this figure as references. The light grey region indicates the PSF core, and the white region the aureole, as defined for PSFCV,1 and PSFCV,2 (CV83). |
| In the text | |
|
Fig. 3 Encircled energy versus the radius r. The four PSFs shown are: PSFK71 (magenta, uppermost line), PSFCV,1 (red, lowermost line for r< 20″), PSFCV,2 (orange, lowermost dash-dotted line for r> 20″), and PSFV,0m (blue). The light (medium) grey region indicates the PSF core (blue sky), and the white region the aureole, as defined for PSFCV,1 and PSFCV,2 (CV83). The horizontal dotted lines at 0.8, 0.9, and 0.95 are guides. |
| In the text | |
|
Fig. 4 Comparison of PSFV,0m (black line) with surface-brightness profile cuts of Venus (red lines), Jupiter (blue lines), the full Moon (solid and dash-dotted orange lines), and the half Moon on the symmetry axis (dashed orange line) and the axis orthogonal to that (dotted orange line). Profiles of objects at apogee (perigee) are drawn with solid (dash-dotted) lines. All profiles, but PSFV,0m, were divided with the illuminated area of the respective object. The light (medium) grey region indicates the PSF core (blue sky), and the white region the aureole. Bullets and circles indicate rPSF of individual profiles, cf. Table 2. |
| In the text | |
|
Fig. 5 Vertical-axis surface-brightness profiles that illustrate effects of radial truncation of PSFK71 and PSFV,0m in example models. The three panels show: a) a small edge-on galaxy, b) an edge-on galaxy of intermediate size, and c) a large edge-on galaxy. In each panel, the disc-galaxy model profile is drawn with a thick solid black line, and model profiles that were convolved with PSFV,0m (PSFK71) are drawn with thin black (grey) lines. The profile of the model that is convolved with the complete PSF is drawn with a thin solid line. Profiles are also shown where each PSF was truncated at rtr,1 (rtr,2) with a dotted line (dash-dotted line) in each panel; a) rtr,1 = 4″ and rtr,2 = 10″; b) rtr,1 = 10″ and rtr,2 = 25″; c) rtr,1 = 10″ (lines fall on top of the model line and are not visible) and rtr,2 = 250″ (Table 3). |
| In the text | |
|
Fig. 6 Vertical-axis R-band and i-band surface-brightness profiles versus the vertical distance z of models and measurements of the edge-on galaxy NGC 5907. a) Blue and purple lines show R-band profiles, and red lines i-band profiles. Model profiles are drawn with thick solid lines. Solid (dash-dotted) lines are profiles of convolved models using PSFV,0m and PSFi,0m (PSFV,3m and PSFi,3m), the purple line used PSFK71. Three different symbols and error bars show measured values: •R band (Sackett et al. 1994; MBH94), ⋆V band (LFD96), and from profiles on both sides of the disc °6660 Å band (ZSS99). The R-band model was convolved with the measured PSFMBH (including lower and upper errors) to produce the white line (cyan-coloured region). The lower limiting radius r110 – where the convolved models using PSFV,0m, PSFi,0m, and PSFK71 lie ≥ 10 per cent above the input model – is marked with a coloured bullet with a black border. b) Three colour profiles R − i are shown for: the model (thick solid line), the convolved model using PSFV,0m and PSFi,0m (solid line), and the convolved model using PSFV,3m and PSFi,3m (dash-dotted line). |
| In the text | |
|
Fig. C.1 Originally reduced image of MBH94 for NGC 5907, shown with a colour map that emphasizes the variations of the background field (their Fig. 1b). The unit of the axes is pixels. The galaxy centre position used is marked with an ×. Two sets of green circles indicate the distance at 100 and 150 px away from the two saturated stars 1 and 2. The positions of five bright stars (twelve regions that were used to measure the background) are indicated with markers and a number (circles and a character), cf. Table C.2 (Table C.1). |
| In the text | |
|
Fig. C.2 PSFs derived from the reduced R-band image of NGC 5907 (Fig. C.1). The azimuthal average is drawn as magnitude
versus radius. The left-hand set of lines used individually set background values.
The set of lines that are offset by 60′′ were all derived using the background value
1760 ADU. PSFMBH is drawn with a dotted line, together with its
error bars. The saturated-star PSFs are drawn with solid black (1) and dash-dotted
(2) lines – PSF |
| In the text | |
|
Fig. C.3 Contour plots of the two saturated stars a) 1 and b) 2 in Fig. C.1, where masked regions are marked in grey. The grey tilted crosses indicate the masked diffraction spikes. The green circles mark the radii 100 and 150 px. |
| In the text | |
Current usage metrics show cumulative count of Article Views (full-text article views including HTML views, PDF and ePub downloads, according to the available data) and Abstracts Views on Vision4Press platform.
Data correspond to usage on the plateform after 2015. The current usage metrics is available 48-96 hours after online publication and is updated daily on week days.
Initial download of the metrics may take a while.