Fig. 1
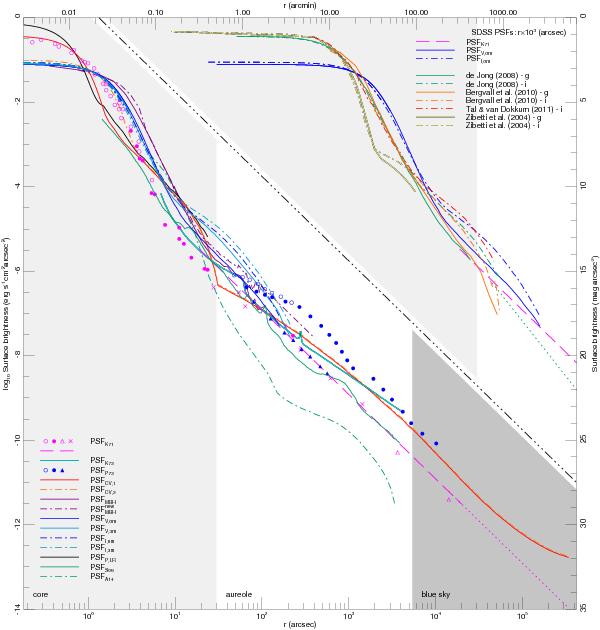
PSF surface-brightness profiles versus the radius r for a 0 mag point source. Individual PSFs are drawn with coloured lines and symbols as indicated in the figure, see also Table 1. PSFs of stacked SDSS images are shown in the upper part of the figure, as a function of 103 × r; PSFV,0m, PSFi,0m, and the outer regions of PSFK71 are shown in both parts as references. Extrapolated PSFs are shown with dotted lines. The light (medium) grey region indicates the PSF core (blue sky) and the white region the aureole, as defined for PSFCV,1 and PSFCV,2 (CV83).
Current usage metrics show cumulative count of Article Views (full-text article views including HTML views, PDF and ePub downloads, according to the available data) and Abstracts Views on Vision4Press platform.
Data correspond to usage on the plateform after 2015. The current usage metrics is available 48-96 hours after online publication and is updated daily on week days.
Initial download of the metrics may take a while.