Fig. 6
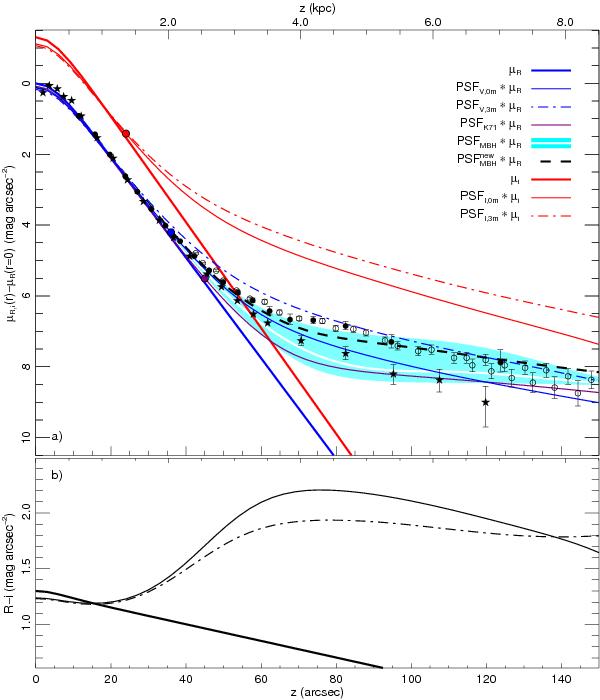
Vertical-axis R-band and i-band surface-brightness profiles versus the vertical distance z of models and measurements of the edge-on galaxy NGC 5907. a) Blue and purple lines show R-band profiles, and red lines i-band profiles. Model profiles are drawn with thick solid lines. Solid (dash-dotted) lines are profiles of convolved models using PSFV,0m and PSFi,0m (PSFV,3m and PSFi,3m), the purple line used PSFK71. Three different symbols and error bars show measured values: •R band (Sackett et al. 1994; MBH94), ⋆V band (LFD96), and from profiles on both sides of the disc °6660 Å band (ZSS99). The R-band model was convolved with the measured PSFMBH (including lower and upper errors) to produce the white line (cyan-coloured region). The lower limiting radius r110 – where the convolved models using PSFV,0m, PSFi,0m, and PSFK71 lie ≥ 10 per cent above the input model – is marked with a coloured bullet with a black border. b) Three colour profiles R − i are shown for: the model (thick solid line), the convolved model using PSFV,0m and PSFi,0m (solid line), and the convolved model using PSFV,3m and PSFi,3m (dash-dotted line).
Current usage metrics show cumulative count of Article Views (full-text article views including HTML views, PDF and ePub downloads, according to the available data) and Abstracts Views on Vision4Press platform.
Data correspond to usage on the plateform after 2015. The current usage metrics is available 48-96 hours after online publication and is updated daily on week days.
Initial download of the metrics may take a while.