Fig. C.2
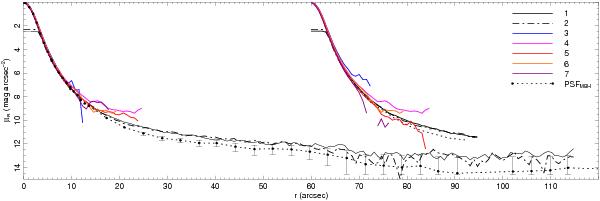
PSFs derived from the reduced R-band image of NGC 5907 (Fig. C.1). The azimuthal average is drawn as magnitude
versus radius. The left-hand set of lines used individually set background values.
The set of lines that are offset by 60′′ were all derived using the background value
1760 ADU. PSFMBH is drawn with a dotted line, together with its
error bars. The saturated-star PSFs are drawn with solid black (1) and dash-dotted
(2) lines – PSF is the average of these two PSFs. The PSF of the remaining five bright stars are
drawn with coloured lines out to a maximum radius rmax, cf.
the legend and Table C.2.
is the average of these two PSFs. The PSF of the remaining five bright stars are
drawn with coloured lines out to a maximum radius rmax, cf.
the legend and Table C.2.
Current usage metrics show cumulative count of Article Views (full-text article views including HTML views, PDF and ePub downloads, according to the available data) and Abstracts Views on Vision4Press platform.
Data correspond to usage on the plateform after 2015. The current usage metrics is available 48-96 hours after online publication and is updated daily on week days.
Initial download of the metrics may take a while.