| Issue |
A&A
Volume 564, April 2014
|
|
|---|---|---|
| Article Number | L2 | |
| Number of page(s) | 5 | |
| Section | Letters | |
| DOI | https://doi.org/10.1051/0004-6361/201423639 | |
| Published online | 27 March 2014 | |
Molecular observations of comets C/2012 S1 (ISON) and C/2013 R1 (Lovejoy): HNC/HCN ratios and upper limits to PH3⋆,⋆⋆
1
Univ. Bordeaux, LAB, UMR 5804, 33270
Floirac, France
e-mail: This email address is being protected from spambots. You need JavaScript enabled to view it.
2
LESIA, Observatoire de Paris, CNRS, UPMC, Université
Paris-Diderot, 5 place Jules
Janssen, 92195
Meudon,
France
3
Instituto de Astrofísica de Andalucía - CSIC,
Glorieta de la Astronomía s/n,
18008
Granada,
Spain
Received: 13 February 2014
Accepted: 3 March 2014
Abstract
We present molecular observations carried out with the IRAM 30 m telescope at wavelengths around 1.15 mm towards the Oort cloud comets C/2012 S1 (ISON) and C/2013 R1 (Lovejoy) when they were at ~0.6 and ~1 au, respectively, from the Sun. We detect HCN, HNC, and CH3OH in both comets, together with the ion HCO+ in comet ISON and a few weak unidentified lines in comet Lovejoy, one of which might be assigned to methylamine (CH3NH2). The monitoring of the HCN J = 3–2 line showed a tenfold enhancement in comet ISON on November 14.4 UT due to an outburst of activity whose exact origin is unknown, although it might be related to some break-up of the nucleus. The set of CH3OH lines observed was used to derive the kinetic temperature in the coma, 90 K in comet ISON and 60 K in comet Lovejoy. The HNC/HCN ratios derived, 0.18 in ISON and 0.05 in Lovejoy, are similar to those found in most previous comets and are consistent with an enhancement of HNC as the comet approaches the Sun. Phosphine (PH3) was also searched for unsuccessfully in both comets through its fundamental 10–00 transition, and 3σ upper limits corresponding to PH3/H2O ratios 4–10 times above the solar P/O elemental ratio were derived.
Key words: comets: general / comets: individual: C/2012 S1 (ISON) / comets: individual: C/2013 R1 (Lovejoy)
Based on observations carried out with the IRAM 30 m telescope. IRAM is supported by INSU/CNRS (France), MPG (Germany) and IGN (Spain).
Tables 3 and 4 are available online at http://www.aanda.org and also at the CDS via anonymous ftp to cdsarc.u-strasbg.fr (130.79.128.5) or via http://cdsarc.u-strasbg.fr/viz-bin/qcat?J/A+A/564/L2
© ESO, 2014
1. Introduction
Radio spectroscopic observations of comets during their visit to the inner solar system have allowed us to detect a wide variety of molecules in their coma (e.g., Bockelée-Morvan & Crovisier 2002). These observations have provided significant constraints on the chemical nature of comets coming from the two main solar system reservoirs, the Oort cloud and the Kuiper belt, whose composition is expected to reflect to some extent that of the regions of the protosolar nebula where they were once formed.
Two bright comets coming from the Oort cloud approached the Sun in late 2013, allowing us to perform sensitive radio spectroscopic observations and to probe their volatile content. C/2012 S1 (ISON) –hereafter ISON– was discovered on September 2012 at 6.3 au from the Sun using a 0.4-m telescope of the International Scientific Optical Network (Nevski et al. 2012). It is a sungrazing comet, which at perihelion, on 2013 Nov. 28.8 UT, passed at just 0.012 au from the Sun (MPEC 2013-Q27). Its orbital elements are consistent with a dynamically new comet, with fresh ices not previously irradiated by sunlight. A worldwide observational campaign has extensively followed this comet from heliocentric distances beyond 4 au (O’Rourke et al. 2013; Li et al. 2013) to disappearance around perihelion (Knight & Battams 2014). C/2013 R1 (Lovejoy, so referred to hereafter) was discovered in September 2013 at rh = 1.94 au by Terry Lovejoy using a 0.2-m telescope (Guido et al. 2013). This comet reached perihelion on 2013 December 22.7 UT. According to its orbital elements (MPEC 2014-D13), this is not its first perihelion passage.
In this Letter we report IRAM 30m spectroscopic observations of the comets ISON and Lovejoy carried out when they were at heliocentric distances of ~0.6 and ~1 au, respectively.
2. Observations
The observations of comets ISON and Lovejoy were carried out with the IRAM 30m telescope during the period of Nov. 13−16, 2013. At these dates (before perihelion for both comets) ISON spanned a heliocentric distance of 0.67−0.58 au and a geocentric distance of 0.93−0.89 au, while Lovejoy was at 1.09−1.06 au from the Sun and 0.43−0.41 au from the Earth. The position of the comets was tracked using the orbital elements from JPL Horizons1.
The EMIR 230 GHz dual polarization receiver (Carter
et al. 2012) and the FTS spectrometer (Klein
et al. 2012) were used to obtain spectra in the frequency ranges 249.0–256.7 GHz
and 264.7–272.4 GHz with a spectral resolution of 0.2 MHz (~0.23 km s-1 if expressed as equivalent
radial velocity). Important molecular lines such as HCN J = 3–2, HNC J = 3–2, HCO+J = 3–2, PH3 10–00, and various CH3OH rotational transitions fall
within the spectral range covered. Most of the observations were carried out using the
wobbler-switching observing mode, with the secondary mirror nutating by ±90′′ at a rate of 0.5 Hz. Pointing and focus were regularly checked on
Mars and nearby quasars. Weather conditions were rather poor on Nov. 13 and 14, with 6–12 mm
of precipitable water vapour (pwv), quite good on Nov. 15 (pwv 1–3 mm), and excellent on
Nov. 16 (pwv < 1 mm). The
half-power beam width of the IRAM 30 m telescope at the observed frequencies ranges from 8.9
to 9.8′′, and the pointing error
is typically lower than 2′′.
Line intensities were converted from antenna temperature
 to main beam brightness temperature
Tmb by dividing by Beff/Feff (e.g., Kramer 1997), where Beff is in the
range 0.50–0.54 and Feff is 0.88 at the observed frequencies.
The data were reduced using the software GILDAS2.
to main beam brightness temperature
Tmb by dividing by Beff/Feff (e.g., Kramer 1997), where Beff is in the
range 0.50–0.54 and Feff is 0.88 at the observed frequencies.
The data were reduced using the software GILDAS2.
The bright HCN J = 3–2 line was observed to monitor cometary activity and to locate the position of maximum molecular emission. In both comets the maximum intensity of the HCN J = 3–2 line was found slightly offset from the presumed position of the comet nucleus, at offsets, in (RA, Dec), of (−8′′, + 4′′) for ISON (i.e., in the direction of the tail) and of (0′′, + 5′′) in the case of Lovejoy. Due to the more favourable weather conditions on Nov. 15 and 16, the highest quality data for both comets were acquired during these dates, on Nov. 15.4 UT for ISON and Nov. 16.4 UT for Lovejoy. The Tmb rms noise levels reached, per 0.2 MHz channel, were 0.013–0.017 K for ISON and 0.008−0.010 K for Lovejoy, after averaging the two polarizations.
3. HCN monitoring
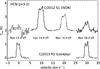 |
Fig. 1 Monitoring of the HCN J = 3–2 line on ISON and Lovejoy during Nov. 13.4–16.4 UT. Lines are shifted in velocity by multiple integers of 10 km s-1 and in Tmb by 2 K for a better visualization. The line intensity shows strong time variations in ISON but remains nearly constant from Nov. 13.4 to 16.4 UT in Lovejoy. |
A strong variation of the HCN J = 3–2 intensity was observed in comet ISON during November 13.4-16.4 UT, with a tenfold intensity enhancement from Nov. 13.4 to 14.4 UT and a progressive decline afterwards (see Fig. 1 and Table 1). The outburst of activity of comet ISON on Nov. 14 was reported by various teams observing at different wavelengths. The dramatic increase of the production rate of HCN reported by Biver et al. (2013) and presented here was matched by enhancements in the production rates of other molecules such as OH, CN, and C2 (Crovisier et al. 2013; Opitom et al. 2013a), an increase in the visual brightness, and the appearance of wings in the coma, which may suggest that the outburst was caused by some splitting of the nucleus (Boehnhardt et al. 2013). Another outburst of activity was reported on Nov. 19 by Opitom et al. (2013b). Whether these outbursts were caused by nucleus splitting, delayed sublimation (e.g., Altenhoff et al. 2009), a change in the orientation of the rotation axis, or some other reason is not clear.
In the case of the comet Lovejoy, the intensity of the HCN J = 3–2 line remained nearly constant (within 10%) from Nov. 13.4 to 16.4 UT (see Fig. 1 and Table 1).
HCN J = 3–2 line parameters and HCN production rates
4. Observed molecules
In addition to the bright J = 3–2 HCN line, some other weaker lines were detected in ISON and Lovejoy within the covered frequency range. We restricted the analysis of lines other than J = 3–2 HCN to the dates of more favourable weather conditions, when acquired spectra were significantly more sensitive, i.e., Nov. 15.4 UT for ISON (rh = 0.61 au) and Nov. 16.4 UT for Lovejoy (rh = 1.06 au). A plethora of CH3OH lines and the J = 3–2 line of HNC were detected in both comets, while the J = 3–2 line of HCO+ was only detected in ISON. The 10–00 rotational transition of PH3 at 266.9 GHz was searched for in both comets without success, and here we report upper limits for this P-bearing molecule (see Sect. 4.3). Observed lines are shown in Fig. 2, while line parameters and derived production rates are compiled in Table 2. Some weak unidentified lines were also detected in Lovejoy (see Sect. 4.4).
Observed lines and inferred molecular production rates in comets ISON at rh = 0.61 au and Lovejoy at rh = 1.06 au.
Line widths are ~2.2 km s-1 in ISON and ~1.7 km s-1 in Lovejoy (see Table 2), which imply outflow velocities of 1.1 and 0.85 km s-1, respectively, in good agreement with the typical values expected at their heliocentric distances, 0.85 km s-1 (rh/au)−1/2 according to Budzien et al. (1994). The line profiles of HCN and HNC are quite similar, but that of HCO+ in ISON seems to be distinct within the limited signal-to-noise ratio (S/N) reached (see Fig. 2). Observations of HCO+ in comet C/1995 O1 (Hale-Bopp) indicate that this product species has a complex and variable spatial and kinematical distribution (Lovell et al. 1998; Milam et al. 2004). The interpretation of HCO+ data in ISON is beyond the scope of this Letter as it would require to model the chemistry and dynamics of the coma.
4.1. Methanol: kinetic temperature in the coma
A large number of methanol lines were observed in both comets within the 249–267 GHz range, most of them belonging to the J3–J2 series of the A± and A∓ torsional states (see Table 3). The observed line intensities were used in a non-LTE excitation model (Biver et al. 2006) to derive the gas kinetic temperature in the coma, which resulted in 90 K for ISON at rh = 0.61 au and 60 K for Lovejoy at rh = 1.06 au. Production rates derived for methanol imply Q(CH3OH)/Q(HCN) ratios of 12 and 18 for ISON and Lovejoy, respectively, within the typical range of values observed in other comets (e.g., Crovisier et al. 2009; Bockelée-Morvan 2011).
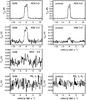 |
Fig. 2 Molecular lines observed in comet ISON on Nov. 15.4 UT (left panels) and in comet Lovejoy on Nov. 16.4 UT (right panels). The HCN J = 3–2 and HNC J = 3–2 lines are clearly detected in both comets, the HCO+J = 3–2 line only in comet ISON, and the PH3 10–00 line is not detected in either of the comets. |
4.2. HNC/HCN ratio
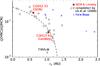 |
Fig. 3 HNC/HCN ratios observed in comets as a function of heliocentric distance. Values derived in comets ISON and Lovejoy are indicated as red squares. We also show the values (empty circles) and upper limits (empty triangles) derived in the sample of 14 moderately active comets compiled by Lis et al. (2008). The empirical relation found by these authors is shown as a dashed line. Values derived at various heliocentric distances before perihelion in comet Hale-Bopp (Biver et al. 1997; Irvine et al. 1998) are also shown as blue crosses. |
Hydrogen isocyanide (HNC), a metastable isomer of HCN, was first detected in comet C/1996 B2 (Hyakutake) by Irvine et al. (1996) and has later on been observed in about a dozen of comets. These observations have served to establish that the HNC/HCN ratio in comets increases as the heliocentric distance reduces, as observed in comet Hale-Bopp (Biver et al. 1997; Irvine et al. 1998) and indicated by the empirical correlation found by Lis et al. (2008) in a sample of 14 moderately active comets spanning heliocentric distances in the range 0.1–1.5 au (see Fig. 3). It is remarkable that most HNC/HCN ratios derived in comets can be accounted for by a simple expression that solely depends on rh and not on any intrinsic property of the comet. A few comets show important deviations from this simple relation, however. For example, in the case of 73P/Schwassmann-Wachmann (fragment B) the sensitive upper limit obtained at rh ~ 1 au (Lis et al. 2008) points to a HNC/HCN ratio well below that of other comets at similar heliocentric distances. Moreover, for Hale-Bopp the HNC/HCN ratio derived at heliocentric distances beyond 2 au is much higher than expected from extrapolating the behaviour of most other comets. In any case, the variation of the HNC/HCN ratio with rh indicates that HNC is not directly released from the cometary nucleus but formed in situ in the coma, although its exact origin is still a mystery. It has been argued that HNC may be formed by thermal degradation of organic polymers or dust grains (Rodgers & Charnley 2001; Lis et al. 2008), although the high HNC/HCN ratios observed in Hale-Bopp at large heliocentric distances seem to require a different source of HNC. Formation of HNC by radiative isomerization from HCN (Villanueva et al. 2013) does not seem efficient enough to explain the observed HNC/HCN ratios.
The HNC/HCN ratio in ISON is 0.18 at rh = 0.61 au, while in Lovejoy this ratio is significantly lower, 0.05 at rh = 1.06 au (see Fig. 3). These values agree with those found in most previous comets and are consistent with a higher HNC/HCN ratio at shorter heliocentric distances. Moreover, the values derived in ISON and Lovejoy match quite well the empirical linear relation found by Lis et al. (2008) between the HNC/HCN ratio and rh, which strengthens the idea that in most comets the HNC/HCN ratio is mainly controlled by the heliocentric distance and not by intrinsic properties of the comet.
4.3. PH3 upper limits
Phosphine is most likely one of the major carriers of phosphorus in comets, although detecting it remains challenging. The search for it in the very active comet Hale-Bopp while it was at 3.6 au from the Sun yielded an upper limit to Q(PH3) of 3.2 × 1026 molecule s-1 (Crovisier et al. 2004), which corresponds to PH3/CO < 3.2 × 10⁻³ at 3.6 au (Biver et al. 1997) and translates into PH3/H2O < 7.4 × 10⁻⁴ at 1 au (Bockelée-Morvan et al. 2000), that is, somewhat above the solar P/O elemental ratio of 5.2 × 10⁻⁴ (Asplund et al. 2009).
Our search for PH3 in comets ISON and Lovejoy results in PH3/HCN ratios <2.4 and <1, respectively (see Table 2). Water production rates for these two comets during the relevant dates are not yet accurately known, but based on preliminary estimates (Bonev et al. 2013; Combi et al. 2013) Q(H2O) ~1–3 × 1029 molecule s-1 for ISON on Nov. 15.4 UT, which implies an HCN/H2O ratio in the range 0.12–0.36%. Adopting a mean HCN/H2O ratio of 0.2% for ISON and Lovejoy, the resulting PH3/H2O ratios are <5 × 10⁻³ and <2 × 10⁻³, respectively. These values are 10 and 4 times higher than the solar P/O elemental ratio and thus do not allow us to conclude whether or not PH3 is the main phosphorus species in these comets.
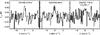 |
Fig. 4 Unidentified lines in comet Lovejoy at rh = 1.06 au. |
4.4. Unidentified lines and tentative assignment
In addition to the lines of HCN, HNC, and CH3OH observed in comet Lovejoy, a few weak lines with no obvious assignment were also observed in the spectral range covered (see Table 4 and Fig. 4). One of these lines coincides in frequency with the rotational transition 72,3–71,2 of methylamine (CH3NH2), an organic molecule that is a plausible cometary constituent. In fact, this species has been detected in samples of comet Wild 2 returned by the mission Stardust (Glavin et al. 2008). Accurate rotational spectroscopic data for this molecule was available just recently (Ilyushin et al. 2005), preventing a search for it in previous comets such as Hale-Bopp (Crovisier et al. 2004). The inferred production rate of CH3NH2 in Lovejoy is 3–4 × 1026 molecule s-1, that is, well above that of HCN. We note, however, that detailed LTE excitation calculations of CH3NH2 in the coma of Lovejoy predict that within the spectral range covered there should be a line at 255 997.8 MHz with a similar intensity to the tentatively identified one at 264 752.7 MHz. This line is lacking in our observed spectra although it might be within the noise. The low S/N of the observed line at 264 752.7 MHz and the lack of the line at 255 997.8 MHz in our data make us to be cautious about the tentative identification of CH3NH2 in Lovejoy.
5. Summary
We have carried out IRAM 30m observations of the comets C/2012 S1 (ISON) and C/2013 R1 (Lovejoy) at heliocentric
distances of ~0.6 and ~1 au, respectively. We detected HCN, HNC, and CH3OH in both comets, plus the ion HCO+ in ISON and a few weak unidentified lines in Lovejoy, one of which might be assigned to CH3NH2. A tenfold enhancement of the HCN J = 3–2 line was observed in comet ISON within less than 24 h on Nov. 14, indicating an outburst of activity whose origin could be related to nucleus splitting. The large number of CH3OH lines observed was used to derive kinetic temperatures in the coma of 90 and 60 K in ISON and Lovejoy, respectively. The HNC/HCN ratios derived, 0.18 in ISON and 0.05 in Lovejoy, are similar to those found in most previous comets and are consistent with an enhancement of HNC as the comet approaches the Sun. PH3 was also searched for unsuccessfully in both comets so that only upper limits to the PH3/H2O ratio 4–10 times above the solar P/O elemental ratio were derived.
Online material
Observed lines of CH3OH in comets ISON at rh = 0.61 au and Lovejoy at rh = 1.06 au.
Unidentified lines in comet Lovejoy at rh = 1.06 au
Acknowledgments
We thank the IRAM 30 m staff for their help during the observations and the anonymous referee for a quick and constructive report. P. S.-S. acknowledges financial support by Spanish grant AYA2011-30106-C02-01.
References
- Altenhoff, W. J., Kreysa, E., Menten, K. M., et al. 2009, A&A, 495, 975 [NASA ADS] [CrossRef] [EDP Sciences] [Google Scholar]
- Asplund, M., Grevesse, N., Sauval, A. J., & Scott, P. 2009, ARA&A, 47, 481 [NASA ADS] [CrossRef] [Google Scholar]
- Biver, N., Bockelée-Morvan, D., Colom, P., et al. 1997, Science, 275, 1915 [NASA ADS] [CrossRef] [Google Scholar]
- Biver, N., Bockelée-Morvan, D., Crovisier, J., et al. 2006, A&A, 449, 1255 [NASA ADS] [CrossRef] [EDP Sciences] [Google Scholar]
- Biver, N., Crovisier, J., Bockelée-Morvan, D., et al. 2012, A&A, 539, A68 [NASA ADS] [CrossRef] [EDP Sciences] [Google Scholar]
- Biver, N., Agúndez, M., Santos-Sanz, P., et al. 2013, Central Bureau Electronic Telegrams, 3711, 2 [NASA ADS] [Google Scholar]
- Bockelée-Morvan, D. 2011, IAU Symp., 280, 261 [NASA ADS] [CrossRef] [Google Scholar]
- Bockelée-Morvan, D., Lis, D. C., Wink, J. E., et al. 2000, A&A, 353, 1101 [NASA ADS] [Google Scholar]
- Bockelée-Morvan, D., & Crovisier, J. 2002, Earth Moon Planets, 89, 53 [Google Scholar]
- Boehnhardt, H., Tubiana, C., Oklay, N., et al. 2013, Central Bureau Electronic Telegrams, 3715, 1 [Google Scholar]
- Bonev, B. P., DiSanti, M. A., Gibb, E. L., et al. 2013, Central Bureau Electronic Telegrams, 3720, 2 [NASA ADS] [Google Scholar]
- Budzien, S. A., Festou, M. C., & Feldman, P. D. 1994, Icarus, 107, 164 [NASA ADS] [CrossRef] [Google Scholar]
- Carter, M., Lazareff, B., Maier, D., et al. 2012, A&A, 538, A89 [NASA ADS] [CrossRef] [EDP Sciences] [Google Scholar]
- Combi, M. R., Bertaux, J.-L., Quemerais, E., et al. 2013, IAU Circ., 9266, 1 [NASA ADS] [Google Scholar]
- Crovisier, J., Bockelée-Morvan, D., Colom, P., et al. 2004, A&A, 418, 1141 [NASA ADS] [CrossRef] [EDP Sciences] [Google Scholar]
- Crovisier, J., Biver, N., Bockelée-Morvan, D., et al. 2009, Earth Moon Planets, 105, 267 [NASA ADS] [CrossRef] [Google Scholar]
- Crovisier, J., Colom, P., Biver, N., & Bockelée-Morvan, D. 2013, Central Bureau Electronic Telegrams, 3711, 1 [NASA ADS] [Google Scholar]
- Glavin, D. P., Dworkin, J. P., & Sanford, S. A. 2008, Meteor. Planet. Sci., 43, 399 [Google Scholar]
- Guido, E., Howes, N., Sato, H., et al. 2013, Central Bureau Electronic Telegrams, 3649, 1 [NASA ADS] [Google Scholar]
- Ilyushin, V. V., Alekseev, E. A., Dyubko, S. F., et al. 2005, J. Mol. Spec., 229, 170 [NASA ADS] [CrossRef] [Google Scholar]
- Irvine, W. M., Bockelée-Morvan, D., Lis, D. C., et al. 1996, Nature, 383, 418 [NASA ADS] [CrossRef] [Google Scholar]
- Irvine, W. M., Bergin, E. A., Dickens, J. E., et al. 1998, Nature, 393, 547 [NASA ADS] [CrossRef] [Google Scholar]
- Klein, B., Hochgürtel, S., Krämer, I., et al. 2012, A&A, 542, L3 [NASA ADS] [CrossRef] [EDP Sciences] [Google Scholar]
- Knight, M. M., & Battams, K. 2014, ApJ, 782, L37 [NASA ADS] [CrossRef] [Google Scholar]
- Kramer, C. 1997, Calibration of spectral line data at the IRAM 30 m radio telescope, IRAM Internal Report [Google Scholar]
- Li, J.-Y., Kelley, M. S. P., Knight, M. M. et al. 2013, ApJ, 779, L3 [NASA ADS] [CrossRef] [Google Scholar]
- Lis, D. C., Bockelée-Morvan, D., Boissier, J., et al. 2008, ApJ, 675, 931 [NASA ADS] [CrossRef] [Google Scholar]
- Lovell, A. J., Schloerb, P., Dickens, J. E., et al. 1998, ApJ, 497, L117 [NASA ADS] [CrossRef] [Google Scholar]
- Milam, S. N., Savage, C., Ziurys, L. M., & Wyckoff, S. 2004, ApJ, 615, 1054 [NASA ADS] [CrossRef] [Google Scholar]
- Nevski, V., Novichonok, A., Burhonov, O., et al. 2012, Central Bureau Electronic Telegrams, 3238, 1 [NASA ADS] [Google Scholar]
- Opitom, C., Jehin, E., Manfroid, J., & Gillon, M. 2013a, Central Bureau Electronic Telegrams, 3711, 3 [NASA ADS] [Google Scholar]
- Opitom, C., Jehin, E., Manfroid, J., & Gillon, M. 2013b, Central Bureau Electronic Telegrams, 3719, 2 [NASA ADS] [Google Scholar]
- O’Rourke, L., Bockelée-Morvan, D., Biver, N., et al. 2013, A&A, 560, A101 [NASA ADS] [CrossRef] [EDP Sciences] [Google Scholar]
- Rodgers, S. D., & Charnley, S. B. 2001, MNRAS, 323, 84 [NASA ADS] [CrossRef] [Google Scholar]
- Villanueva, G. L., Magee-Sauer, K., & Mumma, M. J. 2013, J. Quant. Spectr. Rad. Transf., 129, 158 [NASA ADS] [CrossRef] [Google Scholar]
All Tables
Observed lines and inferred molecular production rates in comets ISON at rh = 0.61 au and Lovejoy at rh = 1.06 au.
Observed lines of CH3OH in comets ISON at rh = 0.61 au and Lovejoy at rh = 1.06 au.
All Figures
|
Fig. 1 Monitoring of the HCN J = 3–2 line on ISON and Lovejoy during Nov. 13.4–16.4 UT. Lines are shifted in velocity by multiple integers of 10 km s-1 and in Tmb by 2 K for a better visualization. The line intensity shows strong time variations in ISON but remains nearly constant from Nov. 13.4 to 16.4 UT in Lovejoy. |
| In the text | |
|
Fig. 2 Molecular lines observed in comet ISON on Nov. 15.4 UT (left panels) and in comet Lovejoy on Nov. 16.4 UT (right panels). The HCN J = 3–2 and HNC J = 3–2 lines are clearly detected in both comets, the HCO+J = 3–2 line only in comet ISON, and the PH3 10–00 line is not detected in either of the comets. |
| In the text | |
|
Fig. 3 HNC/HCN ratios observed in comets as a function of heliocentric distance. Values derived in comets ISON and Lovejoy are indicated as red squares. We also show the values (empty circles) and upper limits (empty triangles) derived in the sample of 14 moderately active comets compiled by Lis et al. (2008). The empirical relation found by these authors is shown as a dashed line. Values derived at various heliocentric distances before perihelion in comet Hale-Bopp (Biver et al. 1997; Irvine et al. 1998) are also shown as blue crosses. |
| In the text | |
|
Fig. 4 Unidentified lines in comet Lovejoy at rh = 1.06 au. |
| In the text | |
Current usage metrics show cumulative count of Article Views (full-text article views including HTML views, PDF and ePub downloads, according to the available data) and Abstracts Views on Vision4Press platform.
Data correspond to usage on the plateform after 2015. The current usage metrics is available 48-96 hours after online publication and is updated daily on week days.
Initial download of the metrics may take a while.