Fig. 1
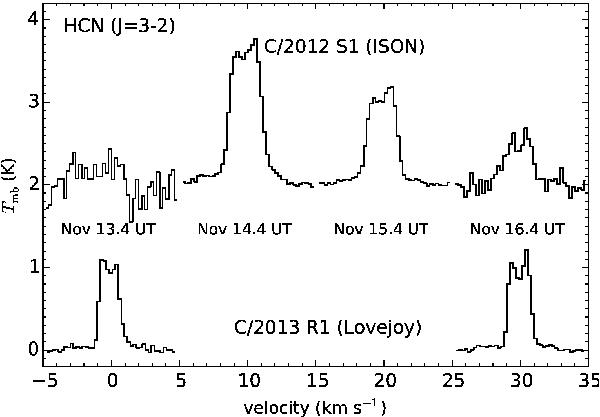
Monitoring of the HCN J = 3–2 line on ISON and Lovejoy during Nov. 13.4–16.4 UT. Lines are shifted in velocity by multiple integers of 10 km s-1 and in Tmb by 2 K for a better visualization. The line intensity shows strong time variations in ISON but remains nearly constant from Nov. 13.4 to 16.4 UT in Lovejoy.
Current usage metrics show cumulative count of Article Views (full-text article views including HTML views, PDF and ePub downloads, according to the available data) and Abstracts Views on Vision4Press platform.
Data correspond to usage on the plateform after 2015. The current usage metrics is available 48-96 hours after online publication and is updated daily on week days.
Initial download of the metrics may take a while.