| Issue |
A&A
Volume 563, March 2014
|
|
|---|---|---|
| Article Number | A27 | |
| Number of page(s) | 17 | |
| Section | Extragalactic astronomy | |
| DOI | https://doi.org/10.1051/0004-6361/201322658 | |
| Published online | 27 February 2014 | |
Evolution of dwarf galaxies: a dynamical perspective⋆
1 Kapteyn Astronomical Institute, University of Groningen, Postbus 800, 9700 AV, Groningen, The Netherlands
e-mail: This email address is being protected from spambots. You need JavaScript enabled to view it.
2 Department of Physics and Astronomy, University of Bologna, via Berti Pichat 6/2, 40127 Bologna, Italy
Received: 12 September 2013
Accepted: 15 November 2013
Abstract
For a rotating galaxy, the inner circular-velocity gradient dRV(0) provides a direct estimate of the central dynamical mass density, including gas, stars, and dark matter. We consider 60 low-mass galaxies with high-quality H I and/or stellar rotation curves (including starbursting dwarfs, irregulars, and spheroidals), and estimate dRV(0) as VRd/Rd, where Rd is the galaxy scale length. For gas-rich dwarfs, we find that VRd/Rd correlates with the central surface brightness μ0, the mean atomic gas surface density Σgas, and the star formation rate surface density ΣSFR. Starbursting galaxies, such as blue compact dwarfs (BCDs), generally have higher values of VRd/Rd than dwarf irregulars, suggesting that the starburst is closely related to the inner shape of the potential well. There are, however, some “compact” irregulars with values of VRd/Rd similar to BCDs. Unless a redistribution of mass takes place, BCDs must evolve into compact irregulars. Rotating spheroidals in the Virgo cluster follow the same correlation between VRd/Rd and μ0 as gas-rich dwarfs. They have values of VRd/Rd comparable to those of BCDs and compact irregulars, pointing to evolutionary links between these types of dwarfs. Finally, we find that, as for spiral galaxies and massive starbursts, the star-formation activity in dwarfs can be parametrized as ΣSFR = ϵ Σgas/τorb, where τorb is the orbital time and ϵ ≃ 0.02.
Key words: galaxies: dwarf / galaxies: starburst / galaxies: irregular / galaxies: evolution / galaxies: star formation / galaxies: kinematics and dynamics
Appendices are available in electronic form at http://www.aanda.org
© ESO, 2014
1. Introduction
Low-luminosity, dwarf galaxies are the most common types of galaxies in the Universe (e.g., Ferguson & Binggeli 1994). Despite numerous observational and theoretical studies, their formation and evolution is still not fully understood (e.g., Tolstoy et al. 2009; Mayer 2011; Kormendy & Bender 2012). Three main types of dwarfs exist in the nearby Universe: i) gas-poor dwarfs that are not currently forming stars, which are usually called spheroidals (Sphs) or dwarf ellipticals (dEs), hereafter we refer to them as Sphs; ii) gas-rich dwarfs that are forming stars at a relatively low rate, named irregulars (Irrs); and iii) starbursting dwarfs that are forming stars at an unusually high rate. The last objects are often classified as amorphous dwarfs (based on optical morphology, e.g., Gallagher & Hunter 1987; Marlowe et al. 1999), H II-galaxies (based on emission-line spectroscopy, e.g., Terlevich et al. 1991), and/or blue compact dwarfs (BCDs, based on colors and surface brightness measurements, e.g., Gil de Paz et al. 2003). Hereafter, we refer to any starbursting dwarf as a BCD. As we show in Sect. 4.1, the term “BCD” captures a fundamental observational fact: the starburst activity (the blue color) occurs mainly in galaxies with a steep gravitational potential (i.e., a compact mass distribution towards the galaxy center), providing that they also have a strong concentration of gas.
It is known that Sphs, Irrs, and BCDs follow the same correlations between the effective surface brightness μeff, the effective radius Reff, and the total magnitude M, pointing at evolutionary links between them (e.g., Kormendy 1985; Binggeli 1994; Tolstoy et al. 2009). In this respect, BCDs are particularly interesting as the burst durations are typically of a few 100 Myr (McQuinn et al. 2010a), thus they must evolve into another type of dwarf as the starburst fades. The possibility of morphological transformations between low-mass galaxies is also suggested by the existence of “transition type” dwarfs, which have intermediate properties between Sphs and Irrs/BCDs (e.g., Sandage & Hoffman 1991; Mateo 1998; Dellenbusch et al. 2007, 2008).
Several photometric studies have shown that the underlying, old stellar component of BCDs typically has a smaller scale length and a higher central surface brightness than Irrs and Sphs of the same luminosity, suggesting that the evolutionary links between BCDs and Irrs/Sphs are not straightforward (e.g., Papaderos et al. 1996; Gil de Paz & Madore 2005; Herrmann et al. 2013). However, it is generally difficult to obtain accurate structural parameters for starbursting dwarfs, since the galaxy morphology is extremely irregular and young stars may dominate the integrated light over much of the stellar body. Recently, Micheva et al. (2013) have obtained deep optical and near-infrared photometry and challenged the previous results, arguing that the structural parameters of the old stellar component of BCDs are consistent with those of Irrs and Sphs.
A different approach is to consider dynamical information that directly traces the distribution of mass, such as H I rotation curves (e.g., Lelli et al. 2012a,b). Using qualitative estimates of the rotation velocities, van Zee et al. (2001) suggested that BCDs have steeper rotation curves than low surface brightness galaxies of similar luminosity (see also Meurer et al. 1998). In Lelli et al. (2012b), we considered a small sample of BCDs and Irrs with high-quality H I rotation curves and measured the circular-velocity gradient VRd/Rd, where Rd is the exponential scale length of the stellar body. We found that BCDs generally have higher values of VRd/Rd than typical Irrs, implying that they have a higher central dynamical mass density (including gas, stars, and dark matter). BCDs also have higher central H I surface densities than Irrs (e.g., van Zee et al. 1998, 2001; Simpson & Gottesman 2000). This suggests that the starburst is closely related to the inner shape of the gravitational potential and to the central concentration of gas. This connection must be the key to understanding the mechanisms that trigger and drive the starburst in BCDs.
In this paper, we confirm the results of Lelli et al. (2012b) for a larger sample of BCDs and Irrs, and include star formation rate (SFR) indicators in the analysis. We also consider a sample of rotating Sphs. We use the dynamical information provided by VRd/Rd to constrain the possible evolutionary links between dwarf galaxies.
2. The sample
We define a dwarf galaxy, in a dynamical sense, as an object with Vflat ≤ 100 km s-1, where Vflat is the asymptotic velocity along the flat part of the rotation curve. For a pressure-supported system, Vflat can be estimated as  (McGaugh & Wolf 2010), where σobs is the observed velocity dispersion along the line of sight. According to the Tully-Fisher (TF) relation, Vflat ≃ 100 km s-1 occurs at MB ≃ −16.5 mag (cf. Verheijen 2001), thus our definition of a dwarf galaxy qualitatively agrees with the standard one given by Tammann (1994), which is based on total luminosity and size. However, contrary to Tammann’s criteria, our definition is directly related to the potential well of the galaxy and is less affected by the effects of recent star formation, which can be serious for BCDs where the light is dominated by young stellar populations. The choice of 100 km s-1 is not arbitrary: in galaxies with Vflat ≤ 100 km s-1 bulges tend to disappear (e.g., Kormendy & Bender 2012) and some cosmological models predict that mass loss from supernova feedback may start to affect the baryonic content (e.g., Dekel & Silk 1986). Using the baryonic TF relation (e.g., McGaugh 2012), we estimate that galaxies with Vflat ≤ 100 km s-1 have a baryonic mass (stars and atomic gas) Mbar ≲ 5 × 10⁹M⊙.
We built a sample of dwarf galaxies with high-quality rotation curves, retrieving optical and H I data from various sources. We included in our selection also galaxies with rotation curves that do not reach the flat part but have Vlast < 100 km s-1, where Vlast is the circular velocity at the last measured point. The dynamical masses of these objects are uncertain, as their rotation curves may continue to rise, but their total magnitudes are ≲−18 R mag (≲−17 B mag), indicating that these galaxies are actual dwarfs. In the following, we describe our sub-samples of starbursting dwarfs (BCDs), typical star-forming dwarfs (Irrs), and gas-poor dwarfs (Sphs). We also clarify the nomenclature used throughout this paper.
2.1. Starbursting dwarfs
In Lelli et al. (2014), we built a sample of 18 starbursting dwarfs by considering objects that satisfy two criteria: i) they have been resolved into single stars by the Hubble Space Telescope (HST); and ii) their star formation histories (SFHs), as derived by modeling color−magnitude diagrams (e.g., McQuinn et al. 2010a), show an increase in the recent SFR (≲1 Gyr) by a factor ≳3 with respect to the average, past SFR. We consider here a sub-sample of 8 objects, for which H I rotation curves could be derived (see Lelli et al. 2014). For another object (SBS 1415+437), we could derive a rotation curve but this is quite uncertain and may not be a reliable tracer of the gravitational potential, as the galaxy strongly deviates from the baryonic TF relation (see Fig. 8 in Lelli et al. 2014), thus we exclude this object here. As we stressed in Sect. 1, we refer to any starbursting dwarf as a BCD.
We also added the well-studied BCD NGC 2915, which has been resolved into single stars by HST (Karachentsev et al. 2003), but its SFH has not yet been derived. NGC 2915 has a regularly-rotating H I disk (Elson et al. 2010), but the inner parts of the rotation curve are uncertain because of the presence of strong non-circular motions (Elson et al. 2011), thus we assigned a conservative error of 15 km s-1 to the inner points of the rotation curve, which have rotation velocities between ~30 and ~60 km s-1.
The properties of our sample of 9 BCDs are given in Tables B.1 and B.2. For all these objects, the HST studies provide accurate distances using the tip of the red giant branch (TRGB) method. For NGC 2366, we used the distance derived by Tolstoy et al. (1995) from Cepheids observations, which is consistent within the uncertainties with that obtained from the TRGB.
2.2. Irregulars
We selected 37 Irrs from the sample of Swaters et al. (2009). We required that the galaxies have high-quality rotation curves (quality-flag q ≤ 2, see Swaters et al. 2009 for details) and inclinations between 30° and 80°, thus the rotation velocities and the central surface brightnesses can be measured with small uncertainties. The rotation curves of these galaxies have been derived by Swaters et al. (2009) taking beam-smearing effects into account. We also added another 6 objects that meet our quality-criteria: UGC 6955 (DDO 105) and UGC 8320 (DDO 168) from Broeils (1992), UGC 6399 and UGC 6446 from Verheijen & Sancisi (2001), and the Local Group dwarfs WLM (Jackson et al. 2004) and NGC 6822 (Weldrake et al. 2003). These 43 galaxies are classified as Irr, Im, Sm, or Sd (de Vaucouleurs et al. 1991); for simplicity we refer to all of them as Irr.
It is possible that some of these Irrs may harbor a starburst and, thus, should be considered as BCDs. For example, the sample of Swaters et al. (2009) contains NGC 4214 (IBm), NGC 2366 (IBm), and NGC 4068 (Im), which are part of our sample of starbursting dwarfs. Moreover, McQuinn et al. (2010a) studied the SFH of NGC 6822, a prototype Irr in the Local Group, and found that it may have experienced a recent starburst. However, since the HST field-of-view covers only ~10% of the stellar body of NGC 6822 (McQuinn et al. 2012), the SFH is representative of a small fraction of the galaxy, thus we prefer to consider NGC 6822 as a typical Irr (see also Mateo 1998; Tolstoy et al. 2009). The sample of Swaters et al. (2009) also contains Holmberg II (UGC 4305), which is a well-studied starbursting dwarf (Weisz et al. 2008; McQuinn et al. 2010b). For this galaxy, the value of the inclination i is uncertain: Swaters et al. (2009) assumed i = 40°, Oh et al. (2011) derived i = 49° from a tilted-ring fit to the velocity field and i = 25° from the baryonic TF relation, whereas Gentile et al. (2012) constrained the outer value of i between 20° and 35° by building 3-dimensional disk models. Given these uncertainties, we chose to exclude Holmberg II.
Tables B.3 and B.4 provide the properties of our sample of 43 Irrs. Galaxy distances have been taken from the literature adopting the following distance indicators (in order of decreasing priority): Cepheids, TRGB, and TF relation.
2.3. Rotating spheroidals
The sample of gas-poor dwarfs is drawn from van Zee et al. (2004a,b), who used long-slit optical spectroscopy to derive stellar rotation curves and velocity dispersion profiles of 16 low-luminosity galaxies in the Virgo cluster. We selected only 8 objects that show a clear rotation-velocity gradient for R ≲ Rd. These galaxies have been classified as dEs by Binggeli et al. (1985). Following Kormendy et al. (2009), we refer to them as Sphs, since they are intrinsically different from bright elliptical galaxies and follow different scaling relations. We assume that the Virgo cluster is at a distance of 16.1 ± 1.2 Mpc (Kelson et al. 2000).
Van Zee et al. (2004b) provide the rotation velocities projected along the line of sight. To trace the gravitational potential of the galaxy, these velocities must be corrected for inclination and pressure-support. To correct for inclination, we modeled the Sphs as thick disks (see Sect. 3.2). To correct for pressure-support, we calculated the asymmetric-drift correction (see Appendix A). These 8 objects have Vlast ≤ 100 km s-1 after applying the inclination and asymmetric-drift corrections, thus they fulfill our definition of a dwarf galaxy. The properties of our sample of rotating Sphs are given in Table B.5.
3. Data Analysis
In Sect. 4, we present several diagrams that compare the dynamical, structural, and star-formation properties of dwarf galaxies. Here we describe the quantities that enter in those diagrams and provide details about the error budget.
3.1. The circular-velocity gradient
The key quantity here is the inner circular-velocity gradient  (1)where Vcirc(R) is the circular velocity of a test particle orbiting at the galactocentric radius R (see Lelli et al. 2013). For a spherical distribution of mass,
  where G is Newton’s constant and ρ0 is the central dynamical mass density (including gas, stars, and dark matter). Thus, for a given dynamical mass, dRV(0) provides, to a first approximation, a direct measure of the inner steepness of the potential well of a galaxy. The rotation curves of dwarf galaxies are typically described by a nearly solid-body part for R ≲ 2Rd (where Rd is the exponential scale length) and an outer flat part for R ≳ 2Rd (e.g., Swaters et al. 2009). Thus, we can estimate dRV(0) on the solid-body portion of the rotation curve as VRd/Rd, where VRd = Vcirc(Rd). If high-resolution rotation curves are available, it is possible to quantify dRV(0) using more sophisticated techniques, such as a polynomial fit that takes the possible concave-down shape of the inner rotation curve into account (see Lelli et al. 2013). For bulgeless galaxies with a nearly-exponential luminosity profile, this would result in differences in dRV(0) within a factor of ~2. For the purposes of this paper, a simple estimate of dRV(0) as VRd/Rd is sufficiently accurate. We also note that, since we are considering the solid-body portion of the rotation curve, the exact value of Rd does not strongly affect the value of dRV(0) ≃ VRd/Rd. The rotation curves used here were derived taking the possible effects of beam-smearing and non-circular motions into account (see Swaters et al. 2009; Lelli et al. 2012a,b, 2014).
For gas-rich galaxies (BCDs and Irrs), Vcirc(R) is directly provided by the H I rotation curve vrot(R), as the asymmetric-drift correction to account for the pressure support is typically negligible in the inner galaxy regions (e.g., Swaters et al. 2009; Lelli et al. 2012b). For gas-poor galaxies (Sphs), instead, the stellar rotation curves must be corrected for pressure support. The asymmetric-drift correction is described in Appendix A.
To estimate the error δV/R on VRd/Rd, we consider the following equation:  (2)where vl.o.s is the circular-velocity projected along the line of sight, i is the inclination, α is the angular scale length (in radians), and D is the galaxy distance. The propagation of the errors gives
 ![Mathematical equation: \begin{equation} \label{eq:errGrad} \delta_{V{/}R}^{2} = \bigg\{ \bigg[ \dfrac{\delta_{v_{\rm l.o.s}}}{R \sin(i)}\bigg]^{2} + \bigg[ \dfrac{V_{\rm{circ}}}{R} \dfrac{\delta_{i}}{\tan(i)}\bigg]^{2} + \bigg[ \dfrac{V_{\rm{circ}}}{R} \dfrac{\delta_{D}}{D}\bigg]^{2}\bigg\}_{R\,=\,R_{\rm d}}, \end{equation}](/articles/aa/full_html/2014/03/aa22658-13/aa22658-13-eq63.png) (3)where the error on α has been neglected. For δvl.o.s/sin(i) we used the error on the rotation velocities given in the original papers; this includes the formal error given by a χ2-minimization and an additional uncertainty due to the asymmetries between the approaching and the receding sides of the galaxy (see e.g., Swaters et al. 2009). For δi we assumed a typical error of 3°, as δi is not provided in the original papers (except in a few cases, see Tables B.1 and B.3). Typically, δD gives a negligible contribution for galaxies with Cepheids and TRGB distances, whereas it dominates the error budget for galaxies with TF distances.
(3)where the error on α has been neglected. For δvl.o.s/sin(i) we used the error on the rotation velocities given in the original papers; this includes the formal error given by a χ2-minimization and an additional uncertainty due to the asymmetries between the approaching and the receding sides of the galaxy (see e.g., Swaters et al. 2009). For δi we assumed a typical error of 3°, as δi is not provided in the original papers (except in a few cases, see Tables B.1 and B.3). Typically, δD gives a negligible contribution for galaxies with Cepheids and TRGB distances, whereas it dominates the error budget for galaxies with TF distances.
3.2. Structural parameters
We collected R-band apparent magnitudes mR, central surface brightnesses μ0, and scale lengths Rd from various sources. For the BCDs, we refer to Lelli et al. (2014). For the Irrs, the sources are Swaters & Balcells (2002; 40 galaxies), Tully et al. (1996; UGC 6399 and UGC 6446), and Hunter & Elmegreen (2006; WLM and NGC 6822, their V-band values have been converted to R-band assuming V − R = 0.5, cf. with e.g., Micheva et al. 2013). For the Sphs, the source is van Zee et al. (2004a). These authors derived the structural parameters μ0 and Rd by fitting an exponential function to the outer parts of the surface brightness profiles. For BCDs, the resulting values of μ0 and Rd are thought to be representative of the underlaying, old stellar component (e.g., Papaderos et al. 1996; Gil de Paz & Madore 2005).
We calculated absolute magnitudes MR using our adopted distances, and estimated the errors considering the distance uncertainties only, hence δM = 5 log (e)δD/D. We corrected μ0 for inclination i using the following equation: ![Mathematical equation: \begin{equation} \mu^{i}_{0} = \mu_{0} - 2.5 C \log[\cos(i)], \end{equation}](/articles/aa/full_html/2014/03/aa22658-13/aa22658-13-eq73.png) (4)where C is a constant related to the internal extinction. Since dwarf galaxies typically have low metallicities (see Tables B.2 and B.4), the dust content is likely low. Hence, we assumed that they are optically thin (C = 1). The error
(4)where C is a constant related to the internal extinction. Since dwarf galaxies typically have low metallicities (see Tables B.2 and B.4), the dust content is likely low. Hence, we assumed that they are optically thin (C = 1). The error  on
on  is given by:
 ![Mathematical equation: \begin{equation} \delta_{\mu_{0}^{i}}^{2} = \delta_{\mu_{0}}^{2} + [ 2.5 \log(e) \tan(i) \delta_{i} ]^{2}. \end{equation}](/articles/aa/full_html/2014/03/aa22658-13/aa22658-13-eq78.png) (5)Since δμ0 is usually not provided in the original papers, we assumed that δμ0 = 0.1 mag. This conservative choice accounts for the uncertainties on the photometric calibration, on the exponential fits, and on the fact that the surface brightness profiles of dwarf galaxies may have inner cores or cusps (see e.g., Swaters & Balcells 2002).
(5)Since δμ0 is usually not provided in the original papers, we assumed that δμ0 = 0.1 mag. This conservative choice accounts for the uncertainties on the photometric calibration, on the exponential fits, and on the fact that the surface brightness profiles of dwarf galaxies may have inner cores or cusps (see e.g., Swaters & Balcells 2002).
For BCDs and Irrs, the inclination was derived by fitting a tilted-ring model to the H I velocity field and/or by building model-cubes (see Lelli et al. 2014; and Swaters et al. 2009, for details). For Sphs, we estimated i from the observed ellipticities ε using the formula  (6)where q0 is a constant that depends on the oblateness of the stellar distribution. We assumed q0 = 0.35, as indicated by statistical studies of the observed ellipticities of dwarf galaxies (Lisker et al. 2007; Sánchez-Janssen et al. 2010). If one assumes that q0 = 0.2, a typical value for the stellar disks of spiral galaxies (e.g., Holmberg 1950), the difference in i would be ≲3° for ε ≤ 0.35 (within our assumed error δi) and ≲6° for 0.35 < ε < 0.55 (within 2δi). In our sample of Sphs, there are no objects with ε > 0.55. Our results are listed in Tables B.1, B.3, and B.5.
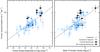 |
Fig. 1 Left: circular-velocity gradient VRd/Rd versus R-band central surface brightness (inclination corrected). Right: VRd/Rd versus the mean H I surface density within Ropt. The black dots and squares show, respectively, BCDs with a diffuse/off-centered starburst and BCDs with a centrally-concentrated starburst. The blue dots and squares show, respectively, typical Irrs and compact Irrs (see Sect. 4.1 for details). The dashed lines show a linear-fit to the data. |
3.3. Gas and star formation properties
We collected information about the H I content, ionized-gas metallicity, and star formation for all the BCDs and Irrs in our sample. These are briefly described in the following.
We calculated H I masses using the standard formula ![Mathematical equation: \begin{equation} M_{\hi}[M_{\odot}] = 236 \times D \, [{\rm Mpc}]^{2} \times S_{\hi} [\rm{mJy \, km \, s^{-1}}], \end{equation}](/articles/aa/full_html/2014/03/aa22658-13/aa22658-13-eq92.png) (7)where SH I is the observed H I flux from interferometric 21 cm line observations. The error δMH I on MH I is given by:
(7)where SH I is the observed H I flux from interferometric 21 cm line observations. The error δMH I on MH I is given by:  (8)Since the error on SH I is usually not given in the original papers, we assumed δSH I = 0.1 SH I (the typical calibration error of standard H I observations).
Following Swaters et al. (2002), we define the optical radius Ropt = 3.2Rd. Ropt is not an isophotal radius and, thus, allows us to compare the sizes of galaxies with different central surface brightnesses. For a HSB exponential disk with μ0(B) = 21.65 mag (Freeman 1970), Ropt = 3.2 Rd is equivalent to the usual isophotal radius R25. We define  as the mean H I surface density within Ropt. is derived from the observed H I map using an elliptical aperture, and is corrected for i by multiplying the mean H I column density
  by cos(i). We calculated for our sample of BCDs, while Swaters et al. (2002) provide for 38 Irrs. We point out that is distance-independent and nearly unaffected by the linear resolution (in kpc) of the H I observations, as the galaxies in our sample are resolved within Ropt. The error
  on is given by
 ![Mathematical equation: \begin{equation} \delta_{\avghi}^{2} = [\cos(i)\delta_{\overline{N}_{\hi}}]^{2} + [\overline{N}_{\hi}\sin(i)\delta_{i}]^{2}, \end{equation}](/articles/aa/full_html/2014/03/aa22658-13/aa22658-13-eq106.png) (9)where
(9)where  is assumed to be 10% of .
We calculated SFRs using the Hα luminosities LHα from Kennicutt et al. (2008), scaled to our assumed distances, and the standard calibration from Kennicutt (1998a). This calibration assumes a Salpeter initial mass function (IMF) from 0.1 to 100 M⊙ and solar metallicity. The latter assumption is clearly not valid for dwarf galaxies, which generally have sub-solar metallicities (see Tables B.1 and B.4). According to Lee et al. (2009a), the ratio SFR/LHα for a galaxy with Z ≃ Z⊙/5 is a factor of ~0.7 lower with respect to a galaxy with Z = Z⊙, thus our SFRs may be slightly overestimated. Other common calibrations, which assume a Kroupa IMF and different stellar evolutionary models, would give SFRs that are lower by a factor of ~0.68 (see Kennicutt & Evans 2012). Kennicutt et al. (2008) provides LHα for 8 BCDs and 29 Irrs present in our sample. For the remaining BCD (I Zw 18), we used the Hα luminosity from Gil de Paz et al. (2003). For another 8 Irrs, we used the Hα SFRs calculated by James et al. (2004) (scaled to our assumed distances and uncorrected for internal extinction), who also used the Kennicutt (1998a) calibration. Besides the uncertainties on the absolute SFR calibration, the errors on the SFRs are of the order of 2δD/D.
We then calculated the SFR surface density 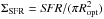 and the ratio SFR/Mbar, which is a baryonic version of the specific SFR (sSFR = SFR/M∗). The baryonic mass (stars and atomic gas) was estimated from the baryonic TF relation, calibrated by McGaugh (2012) as
 ![Mathematical equation: \hbox{$M_{\rm bar} [M_{\odot}] = 47 \times V_{\rm circ}^{4} [\rm{km\,s^{-1}}]$}](/articles/aa/full_html/2014/03/aa22658-13/aa22658-13-eq116.png) with an accuracy of ~10%. For the 16 Irrs and 2 BCDs that do not reach the flat part of the rotation curve, this baryonic mass may be slightly underestimated. We also calculated two types of gas-depletion times: i) τglobal = 1.33 MH I/SFR, which considers the total atomic gas mass; and ii)
with an accuracy of ~10%. For the 16 Irrs and 2 BCDs that do not reach the flat part of the rotation curve, this baryonic mass may be slightly underestimated. We also calculated two types of gas-depletion times: i) τglobal = 1.33 MH I/SFR, which considers the total atomic gas mass; and ii) 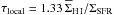 , which considers only the atomic gas mass inside Ropt. The factor 1.33 takes the contribution of helium into account (e.g., de Blok et al. 2008). Note that ΣSFR, τglobal, and τlocal are distance independent; the errors depend on the accuracy of the H I and Hα flux calibrations (typically ~10%) and on the SFR calibration. Since the SFRs may be overestimated up to a factor of ~2 due to the assumptions on the IMF and metallicity, the gas depletion times may be slightly underestimated. Finally, we compiled Hα + [N II]equivalent widths (EW) and ionized-gas metallicities 12 + log (O/H) from the literature. Our results are listed in Tables B.2 and B.4.
4. Results
4.1. Gas-rich dwarf galaxies
We start by comparing the dynamical properties of gas-rich, star-forming dwarfs (BCDs and Irrs). As discussed in Sect. 3.1, for a bulgeless galaxy with a nearly exponential luminosity profile, VRd/Rd is a good proxy for the circular-velocity gradient  , where ρ0 is the central dynamical mass density (including gas, stars, and dark matter). In Fig. 1, VRd/Rd is plotted versus the central surface brightness
  (left) and the mean H I surface density (right). VRd/Rd correlates with both and (see also Lelli et al. 2012b, 2013). Gas-rich dwarfs with a high central dynamical mass density (high VRd/Rd) have also a high central surface brightness and a high H I surface density within the stellar body. To quantify the statistical significance of these relations, we calculated the Pearson’s correlation coefficient ρcc, where ρcc = ± 1 for an ideal linear correlation/anticorrelation while ρcc = 0 if no correlation is present. We found that both correlations are highly significant: the
  diagram has ρcc ≃ − 0.8, whereas the
  diagram has ρcc ≃ 0.7. A linear, error-weighted fit to the data returns
  (10)and
  (11)The left panel of Fig. 1 is nearly equivalent to the lower part of the scaling relation described in Lelli et al. (2013), which holds for both irregular and spiral galaxies and extends for 2 orders of magnitude in dRV(0) and 4 orders of magnitude in surface brightness. The values of the slope and intersect in Eq. (10) are in close agreement with those found in Lelli et al. (2013) (−0.22 ± 0.02 and 6.3 ± 0.4, respectively).
The previous correlations are completely driven by the local, inner properties of the galaxies ( and ) and not by global properties, such as the total baryonic mass or the total dynamical mass. This is illustrated in Fig. 2 (left), where VRd/Rd is plotted versus the circular velocity at the last measured point Vlast. Clearly, there is no correlation (ρcc ≃ 0.01). Similarly, we found no correlation with the absolute magnitude MR and with the dynamical mass (calculated at the last measured point). At every value of Vlast (or MR), one can find both high-surface-brightness (HSB) dwarfs with a steeply-rising rotation curve and low-surface-brightness (LSB) dwarfs with a slowly-rising rotation curve (cf. with Fig. 1, left). In particular, for a given Vlast, BCDs typically have higher values of VRd/Rd than the bulk of Irrs.
Figure 1 clearly shows that most BCDs are in the top-right part of the  and
and  diagrams. This suggests that the starburst activity is closely linked to the inner shape of the potential well and to the central gas surface density. We can distinguish, however, between two types of BCDs: i) centrally-concentrated starbursts (NGC 1705, NGC 2915, NGC 4214, NGC 6789, and I Zw 18); and ii) diffuse and/or off-centered starbursts (NGC 2366, NGC 4068, UGC 4483, and I Zw 36). The former (black squares) have the highest values of VRd/Rd and , whereas the latter (black dots) show moderate values of VRd/Rd and . In particular, NGC 2366 and UGC 4483 are prototype “cometary” BCDs (e.g., Noeske et al. 2000), as the starburst region is located at the edge of an elongated LSB stellar body (see the Atlas in Lelli et al. 2014). I Zw 36 has an off-centered starburst region superimposed on an elliptical stellar body, and may be a “cometary-like” BCD observed close to face-on. Finally, NGC 4068 has several small star-forming regions spread over the entire stellar body. It is possible that BCDs with a diffuse/off-centered starburst are different from BCDs with a centrally-concentrated starburst in terms of their structure and dynamics. This may be related to different evolutionary histories and/or triggering mechanisms.
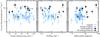 |
Fig. 2 Left: VRd/Rd versus circular velocity at the last measured point Vlast. Middle: VRd/Rd versus SFR/Mbar, where Mbar is estimated using the baryonic TF relation. Right: VRd/Rd versus the Hα+[N II]equivalent width. Symbols are the same as in Fig. 1, except for the left and middle panels, where open symbols indicate galaxies with rotation curves that keep rising at Vlast, thus their value of SFR/Mbar may be overestimated. |
Several Irrs have circular-velocity gradients comparable to those of BCDs (≳45 km s-1 kpc-1). These objects, shown by blue squares in Figs. 1 and 2, are the following (the classification from de Vaucouleurs et al. 1991 is given): UGC 3711 (IBm), UGC 3966 (Im), UGC 5721 (SBd?), UGC 7232 (Im pec), UGC 7261 (SBdm), UGC 7690 (Im), and UGC 8490 (Sm). These galaxies have structural and dynamical properties more similar to BCDs than to typical Irrs. In particular, they have HSB exponential profiles with relatively-small scale lengths (≲1 kpc, see the right panel of Fig. 5) and strong concentrations of gas near the galaxy center (cf. Swaters & Balcells 2002). This suggests that either they are also starbursting dwarfs (and may be considered as BCDs) or they are progenitors/descendants of BCDs. Except for the barred galaxies UGC 3711 and UGC 7261, the surface brightness profiles of these Irrs do not show the central “light excess” that is typically observed in BCDs (cf. Swaters et al. 2002), thus it is likely that they are not experiencing a starburst at the present epoch. We refer to them as compact Irrs. The study of the SFHs of these compact Irrs may be crucial to address their relation to BCDs.
4.2. Gravitational potential and starburst indicators
To clarify the relation between the gravitational potential and the star formation, we plotted VRd/Rd against several starburst indicators: the ratio SFR/Mbar (similar to the sSFR = SFR/M∗), the equivalent width EW(Hα + [N II]), the SFR surface density ΣSFR, and the gas depletion times tlocal and tglobal (see Sect. 3.3 for details). In the literature, there is no general agreement about which of these indicators best identifies a starburst galaxy.
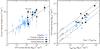 |
Fig. 3 Left: VRd/Rd versus SFR surface density ΣSFR. The dashed line shows a linear-fit to the data. The position of the post-starburst dwarf galaxy NGC 6789 is indicated. Right: ΣSFR versus Σgas/τorb, where Σgas considers the atomic gas only and τorb is the orbital time on the solid-body portion of the rotation curve. The dashed lines show a linear relation for different values of ϵ. Symbols are the same as in Fig. 1. |
The ratio SFR/Mbar quantifies the star-formation activity of a galaxy with respect to its baryonic mass (stars and atomic gas). This is comparable to SFR/M∗, which is often used for massive galaxies. We prefer to use SFR/Mbar for two reasons: i) we do not have a direct estimate of M∗ for the Irrs, whereas we can estimate Mbar using the baryonic TF relation (see Sect. 3.3 for details); and ii) in some dwarf galaxies the atomic gas mass can be as high as the stellar mass, thus a LSB Irr that has been inefficiently forming stars during the Hubble time might have a relatively high SFR/M∗ ratio but a low SFR/Mbar ratio. The differences between SFR/Mbar and SFR/M∗, however, are typically within a factor of ~2. Figure 2 (middle) shows that there is no correlation between VRd/Rd and SFR/Mbar (ρcc ≃ − 0.1). Moreover, BCDs and Irrs can have similar values of SFR/Mbar, suggesting that this is not a good starburst indicator.
The EW(Hα) is thought to trace the stellar birthrate parameter b, defined as the ratio of the current SFR to the past, average SFR over the galaxy lifetime (e.g., Kennicutt 1998a). Lee et al. (2009b) argued that an EW(Hα)  corresponds to b ≳ 2.5 and, thus, identifies a starburst. Figure 2 (right) shows that there is no strong correlation between EW(Hα + [N II]) and VRd/Rd (ρcc ≃ 0.3). Most BCDs, as expected, have very high values of EW(Hα + [N II]), although some of them have EW(Hα+[N II]) < 100
  . As pointed out by McQuinn et al. (2010a), starbursts are events lasting for a few 100 Myr, whereas the Hα emission probes the star-formation activity over shorter timescales (≲10 Myr), thus fluctuations in the SFH over a few Myr may explain why a EW(Hα) threshold misidentifies some BCDs.
The ΣSFR normalizes the SFR by the area of the stellar body. Figure 3 (left) shows that VRd/Rd correlates with ΣSFR (ρcc ≃ 0.8). This suggests that there is a close link between the star-formation activity and the inner steepness of the potential well. A linear, error-weighted fit to the data returns  (12)This correlation is expected from Fig. 1 (right) and the Kennicutt-Schmidt (KS) law (e.g., Kennicutt 1998b). By combining Eqs. (11) and (12), indeed, one can obtain a KS type of relation, that considers the atomic gas only and has a slope of ~3. This is in line with the results of Roychowdhury et al. (2009), who investigated the KS law in 23 extremly-faint dwarf galaxies (MB ≃ −13 mag) and found a slope of ~2.5 by considering atomic gas only and UV-based SFRs. As expected, most starbursting dwarfs are in the top-right part of the VRd/Rd − ΣSFR diagram. In BCDs, the starburst typically increases the SFR by a factor of ~5 to ~10 (e.g., McQuinn et al. 2010a). NGC 6789, which is the only known post-starburst galaxy in our sample (see McQuinn et al. 2010a and Sect. 5.2), shows a large horizontal deviation with respect to the main relation (≳1 dex). Intriguingly, compact Irrs also have high values of ΣSFR, but they systematically lie on the left side of the linear-fit by ~0.5 to ~1 dex, thus they are consistent with being progenitors/descendants of BCDs. However, the overall, large scatter on the VRd/Rd − ΣSFR relation prevents us from reaching any firm conclusion about the nature of compact Irrs and their link with BCDs.
We point out that VRd/Rd = 2π/τorb, where τorb is the orbital time on the solid-body portion of the rotation curve. Kennicutt (1998b) found that, for spiral galaxies and massive starbursts, ΣSFR also correlates with Σgas/τorb, where τorb was calculated at the outer edge of the optical disk (presumably along the flat part of the rotation curve) and Σgas includes both atomic and molecular gas. This correlation may be interpreted as the effect of spiral arms triggering the star formation (e.g., Kennicutt 1998b). Fig. 3 (right) shows that a similar correlation (with ρcc ≃ 0.9) also holds for gas-rich dwarfs, in which the effect of density waves clearly cannot be important. Here τorb is calculated on the solid-body portion of the rotation curve, while Σgas includes the atomic gas component only, since the molecular content of low-metallicity, dwarf galaxies is very uncertain (e.g., Taylor et al. 1998; Leroy et al. 2008). As discussed by Kennicutt (1998b), one might expect a linear relation of the form: 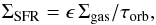 (13)where ϵ is the fraction of gas that is converted into stars during every orbit. For spiral galaxies and massive starbursts, Kennicutt (1998b) found that ~10% of the available gas (atomic plus molecular) is converted into stars during every orbit. The dashed lines in Fig. 3 (right) show fractions ϵ = 0.01, 0.03, and 0.10. Most dwarf galaxies have 0.01 ≲ ϵ ≲ 0.03, but several BCDs seem to have ≳0.03, suggesting that they might be converting gas into stars more efficiently than other gas-rich dwarfs. However, metallicity and/or internal extinction may affect the relative values of ΣSFR in different galaxies, thus it is unclear whether the differences in ϵ are real or due to the use of the same SFR calibration for all the galaxies, without considering the possible effects of internal extinction and metallicity.
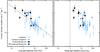 |
Fig. 4 Left:VRd/Rd versus local gas-depletion time, that considers the atomic gas mass within Ropt. The dashed line shows a linear fit to the data. Right: VRd/Rd versus the total gas-depletion time, that considers the total atomic gas mass. The dashed line shows the maximum duration of a typical starburst (~1 Gyr). Symbols are the same as in Fig. 1. |
Finally, τlocal and τglobal estimate the time that a galaxy will take to consume its gas reservoir, if it keeps forming stars at the current rate. τlocal considers only the atomic gas within the stellar component, while τglobal considers the total atomic gas. Since our SFRs may be slightly overestimated, the values of τlocal and τglobal may be underestimated by a factor of ~2 (see Sect. 3.3). Several studies (e.g., van Zee 2001; Hunter & Elmegreen 2004) have shown that gas-rich dwarfs have long gas-depletion times (>10 Gyr) and, thus, could keep forming stars for several Hubble times. In Fig. 4 (left), we show that VRd/Rd correlates with τlocal (ρcc ≃ − 0.8), as expected from Figs. 1 (right) and 3 (left). BCDs and compact Irrs typically have τlocal ≲ 5 Gyr. A linear, error-weighted fit to the data yields  (14)Figure 4 (right), instead, shows that the relation between VRd/Rd and τglobal is less well defined (ρcc ≃ − 0.6). It also shows that τglobal is significantly larger than τlocal, implying that Irrs and BCDs have massive gas reservoirs outside the stellar component. For most BCDs, both τlocal and τglobal are larger than the typical durations of the burst (few 100 Myr), implying that they do not consume their entire gas reservoir during the current event of intense star formation. Burst durations can be estimated using the SFHs derived by fitting the color−magnitude diagrams of the resolved stellar populations (e.g., McQuinn et al. 2010a). In particular, the sample of McQuinn et al. (2010a) includes five “fossil” starbursting dwarfs, that allow us to estimate the total duration of the burst. If one defines the burst duration as the period when the birthrate parameter b > 2, Fig. 2 of McQuinn et al. (2010b) shows that the longest burst duration is ~850 Myr in UGC 9128. McQuinn et al. (2010b) report slightly higher values as they use a less conservative definition of “burst duration”. We assume a fiducial value of 1 Gyr as the maximum duration of a starburst; this is indicated in Fig. 4 by a verical dashed line. All the BCDs in our sample have τglobal > 1 Gyr, and most of them also have τlocal > 1 Gyr.
4.3. Gas-poor dwarf galaxies
We now compare the structural and dynamical properties of gas-rich dwarfs with those of rotating Sphs in the Virgo cluster (van Zee et al. 2004a,b). These gas-poor dwarfs are at higher distances than most gas-rich dwarfs in our sample; beam-smearing effects, however, are not a serious issue in the derivation of the stellar rotation curves, given that the long-slit optical observations have significantly higher angular resolution (~2′′) than the H I observations (~10′′ to 30′′). The stellar rotation velocities have been corrected for pressure-support as described in Appendix A.
Figure 5 (left) shows that rotating Sphs follow the same correlation between VRd/Rd and defined by Irrs and BCDs. Moreover, these rotating Sphs have values of VRd/Rd and comparable with those of BCDs and compact Irrs. In Fig. 5 (right), we plot Rd against ; the dashed lines correspond to exponential profiles with a fixed total magnitude. The rotating Sphs have total R-band magnitudes in the range − 16 ≲ MR ≲ − 18, comparable to the Irrs considered here. In general, for a given MR, the values of and Rd of rotating Sphs are, respectively, higher and smaller than those of typical Irrs, but comparable with those of some BCDs and compact Irrs. Therefore, the structural and dynamical properties of rotating Sphs in the Virgo cluster appear similar to those of BCDs and compact Irrs in the field and nearby groups.
Since our sample of gas-poor dwarfs is relatively small, it is unclear whether rotating Sphs are necessarily more compact than typical Irrs, or whether this is the result of selection effects. It is clear, however, that a close link between the central dynamical mass density (VRd/Rd) and the stellar surface density () is present in any kind of rotating galaxy (see also Lelli et al. 2013).
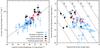 |
Fig. 5 Left:VRd/Rd versus |
5. Discussion
5.1. The relation between gravitational potential, gas surface density, and starburst activity
In Sect. 3.1 we estimated the circular-velocity gradient dRV(0) ≃ VRd/Rd for a sample of 60 dwarf galaxies, including BCDs, Irrs, and Sphs. VRd/Rd is a direct measure of the central dynamical mass density in a galaxy (including gas, stars, and dark matter). In Sect. 4.1 we showed that, for gas-rich dwarfs, VRd/Rd correlates with i) the central surface brightness; ii) the mean H I surface density over the stellar body; and iii) the SFR surface density. Starbursting dwarfs are in the upper parts of these relations, as they have high H I surface densities, high central surface brightnesses, and high circular-velocity gradients, indicating that they have a high central dynamical mass density. This implies that the starburst activity is closely related to the inner steepness of the potential well and the gas surface density. The nature of this connection is unclear. There are, however, two likely possibilities: i) the progenitors of BCDs are unusually compact Irrs with a steep potential well; or ii) there is a mechanism that concentrates the mass (gas, stars, and dark matter) in typical Irrs, eventually causing a starburst. These possibilities are discussed in the following.
If the progenitors of BCDs are compact Irrs, the high circular-velocity gradient would imply high values of the critical surface-density threshold for gravitational instabilities Σcrit (Toomre 1964; Kennicutt 1989) and make the gaseous disk relatively stable against large-scale perturbations. For a self-gravitating gaseous disk, Σcrit is given by  (15)where α is a dimensionless parameter (near unity) that accounts for the finite thickness of the disk (e.g., Martin & Kennicutt 2001), σgas is the gas velocity dispersion, and κ is the epicyclic frequency given by
  (16)The possible role of Σcrit in BCDs has been discussed by Meurer et al. (1998) and van Zee et al. (2001), who argued that, in these compact galaxies, the gas could pile up in the center and reach high surface densities, while the star formation would be delayed until the critical surface-density treshold is reached, leading to a starburst. We note that this should strictly apply only to the inner regions of the galaxy (R ≲ 2Rd), where the shape of the rotation curve is close to a solid body and, thus, Σcrit ∝ VRd/Rd (assuming that σgas and α are nearly constant with radius). In the outer regions (R ≳ 2Rd), instead, the rotation curve becomes flat and Σcrit ∝ 1/R, hence the gaseous disk might be less stable. Thus, this picture does not require a “bursty” SFH for the whole galaxy, i.e. strong bursts separated by quiescent periods, as the star formation may continue in the outer parts of the galaxy. Star formation at large radii is actually observed in several Irrs and BCDs (e.g., Hunter & Elmegreen 2004).
Toomre’s model for gravitational instabilities may also provide a simple explanation for the correlation between VRd/Rd and (Fig. 1, right). If Σgas ≃ Σcrit ∝ VRd/Rd and the product α × σgas is approximately the same in every dwarf galaxy, we would expect the following relation:  (17)Remarkably, the observed slope of the
  relation is consistent with 1 within the uncertainties (see Eq. (11)). Moreover, the value of the intersect (corrected for the presence of helium) imply α × σgas = 3.6 km s-1, in close agreement with the value of ~4 km s-1 found by Kennicutt (1989) and Martin & Kennicutt (2001) in the outer regions of spiral galaxies. Note that Eqs. (15) and (17) are valid in the case of a self-graviting gaseous disk. If one considers also the gravitational effect of stars, the condition for the stability of the two-components disk is more complex (e.g., Rafikov 2001), and it is unclear whether the linear relation in Fig. 1 (right) may be simply explained.
There are several mechanisms that can cause a concentration of mass in a galaxy, both internal (bar-like torques) and/or external (interactions/mergers). First, we discuss internal mechanisms. BCDs and compact Irrs are not necessarily barred, thus a bar-driven inflow seems an unlikely general mechanisms. However, Hunter & Elmegreen (2004) speculated that dwarf galaxies may have bars made of dark matter, while Bekki & Freeman (2002) argued that rotating, triaxial dark-matter haloes can exert large-scale torques and lead to mass inflow. Elmegreen et al. (2012) proposed that massive clumps of gas and young stars can exchange angular momentum with halo stars and dark matter particles and, thus, may spiral inward to the galaxy center, leading to a central starburst. This scenario would imply an evolutionary trend from BCDs with an off-centered starbursts (e.g., NGC 2366 and I Zw 36) to BCDs with a centrally-concentrated starburst (e.g., NGC 1705 and NGC 4214). Simulations of high-redshift galaxies suggest that the clump-instability creates a central mass concentration similar to a bulge, that is photometrically distinct from the underlying exponential disk (e.g., Immeli et al. 2004; Bournaud et al. 2007). The compact Irrs identified in Sect. 4.1, instead, have surface brightness profiles described by a single HSB exponential (with the exception of the barred galaxies UGC 3711 and UGC 7261; cf. Swaters & Balcells 2002). BCDs often show surface brightness profiles with an inner light excess, but these light enhancements typically have very blue colors and do not appear to trace the stellar mass (e.g., Papaderos et al. 1996).
Regarding external mechanims, it is well established that galaxy interactions and mergers can cause gas inflow and lead to a central starburst (e.g., Barnes & Hernquist 1996; Bekki 2008). Moreover, dwarf galaxies are thought to be relatively fragile systems and external perturbations may significantly change their mass distribution, possibly leading to an overall contraction of the stellar and gaseous disks (e.g., Hunter & Elmegreen 2004). About half of the BCDs in our sample have disturbed and asymmetric H I morphologies in their outer parts, suggesting either a recent interaction/merger between gas-rich dwarfs (see e.g., I Zw 18 in Lelli et al. 2012a) or gas accretion from the environment (e.g., Kereš et al. 2005; Dekel & Birnboim 2006). Disturbed H I morphologies have also been found in other studies of BCDs (e.g., López-Sánchez et al. 2010; Ashley et al. 2013) and several interacting BCDs are known (e.g., Cox et al. 2001; Ekta et al. 2006, 2009). Thus, the hypothesis that interactions/mergers cause the central concentration of mass (gas, stars, and/or dark matter) and trigger the starburst is in overall agreement with the observations.
5.2. BCDs and the evolution of dwarf galaxies
In the following, we discuss the possible evolutionary links between BCDs, Irrs, and Sphs. The emerging picture is that a BCD in isolation most likely evolves into a compact Irr, but environmental processes (such as ram-pressure stripping) may transform compact Irrs and BCDs into rotating Sphs.
5.2.1. The link between BCDs and compact Irrs
In Sect. 4.1 we pointed out that the global gas-depletion times of BCDs are much larger than the typical durations of a starburst (<1 Gyr). This implies that BCDs generally do not consume their entire gas reservoir. Moreover, both optical and X-rays observations suggest that BCDs do not expell a large quantity of gas out of their potential well (see also Lelli et al. 2014). Observations of the Na D absorption doublet have shown that outflows are common in starbursting dwarfs, but the velocities of the outflowing gas do not clearly exceed the galaxy escape velocity (Schwartz & Martin 2004). Similarly, studies of the Hα kinematics have found that the warm gas is usually gravitationally-bound to the galaxy (e.g., Martin 1996, 1998; van Eymeren et al. 2009a,b, 2010). X-ray studies have revealed that some BCDs have diffuse coronae of hot gas at T ≃ 106 K (Ott et al. 2005a,b), which are presumably associated with outflows but have very low masses, only ~1% of the H I masses. Thus, a BCD in isolation most likely evolves into another gas-rich dwarf as the starburst fades.
In Sect. 4.1 we also identified several compact Irrs that have structural and dynamical properties similar to BCDs. It is clear that, unless a redistribution of mass takes place, the descendants of BCDs must be compact Irrs. A strong redistribution of mass seems unlikely for two reasons: i) in dwarf galaxies there are no known internal mechanisms that are able to redistribute stars and dark matter, such as radial migrations due to bars and density waves (e.g., Minchev et al. 2011); and ii) stellar feedback seems unable to expel a large quantity of gas from the potential well and, thus, cause a significant expansion of the stellar and dark matter components. In particular, Papaderos et al. (1996) and Gil de Paz & Madore (2005) showed that the scale lengths of the old stellar component of BCDs should, on average, increase by a factor of ~2 to be consistent with those of typical Irrs and Sphs. Papaderos et al. (1996) proposed a simple, spherically-symmetric model to quantify the effect of outflows on the evolution of the stellar body of an isolated BCD; their Eqs. (12) and (13) can be written as  (18)where
  and
and  are, respectively, the scale lengths in the initial (starburst) and final (post-starburst) stages of the system, Mout is the gas mass that is ejected,
  is the baryonic mass in the initial stage, and
  is the initial baryonic fraction within the stellar body. In Lelli et al. (2014), we showed that BCDs have, on average, fbar ≃ 0.3 to 0.5, depending on the assumptions on the IMF and on the molecular gas content. In order to have
  , one would need unphysical values of
  to 1.7, that would leave no baryons in the potential well. Thus, even if outflows would expell a significant quantity of gas, they could not easily explain the differences in the scale lengths of BCDs and typical Irrs/Sphs.
In this evolutionary context, the BCD NGC 6789 deserves special attention. NGC 6789 resides in the Local Void and is extremely isolated, as the nearest massive galaxy (NGC 6946) is at a projected distance of 2.5 Mpc (Drozdovsky et al. 2001). The SFHs from McQuinn et al. (2010a) and García-Benito & Pérez-Montero (2012) show that the starburst ended about ~500 Myr ago and the galaxy is now forming stars at a lower rate. Thus, NGC 6789 is a post-starburst dwarf galaxy. The system still has a considerable gas reservoir (~2 × 10⁷ M⊙) and the gas depletion time is long (~6 Gyr). The rotation curve rises steeply in the inner parts, indicating that there is a strong central concentration of mass. Thus, NGC 6789 did not consume its entire gas reservoir during the starburst and did not experience a strong redistribution of mass in the last ~500 Myr, in agreement with our previous reasoning.
5.2.2. The link between BCDs and rotating Sphs
In Sect. 4.3 we showed that rotating Sphs in the Virgo cluster have central dynamical mass densities similar to those of BCDs and compact Irrs. It is likely, therefore, that rotating Sphs are the descendants of BCDs and compact Irrs, providing that some mechanism removes the gas from the galaxy. As we already pointed out, supernova feedback seems unable to entirely expell the ISM of a BCD, thus the best candidate is ram-pressure stripping due to either the hot intra-cluster medium (e.g., Kormendy & Bender 2012) or the hot coronae that are thought to surround massive galaxies (e.g., Gatto et al. 2013). The rotating Sphs in our sample, however, are still pressure-supported in the inner regions (with vrot/σ between ~0.3 to ~1), whereas the gaseous disks of BCDs and Irrs are rotation-supported (with vrot/σ > 1). In particular, one may expect that the newly-formed stars retain the angular momentum of the H I disk, which is the site of the recent star formation. Thus, an additional mechanism that heats the stellar disk of a BCD/compact Irr may be required for a morphological transformation into a rotating Sph. Possible mechanisms are galaxy harassment by a galaxy cluster (e.g., Moore et al. 1998) or tidal stirring by a nearby massive companion (e.g., Mayer et al. 2006). We warn, however, that the comparison between different kinematical tracers (as stars and H I) may be misleading. Leaman et al. (2012) studied the stellar kinematics of the Local Group irregular WLM and found that its stellar disk has vrot/σ ~ 1, whereas the H I disk has vrot/σ ~ 7. Thus, the stellar and H I kinematics in a dwarf galaxy may be remarkably different, and the stellar component of an Irr may be very similar to that of a Sph. In this case, the evolution from a BCD/compact Irr to a rotating Sph would just require gas removal, given that the current starburst typically creates only a small fraction of the total stellar mass (~10%, e.g., McQuinn et al. 2010b) and, thus, the newly-formed stars cannot strongly affect the overall stellar kinematics.
The evolutionary sequence BCDs → compact Irrs → rotating Sphs may solve some long-standing issues about the direct transformation of Irrs into bright Sphs: i) Irrs are expected to fade after the cessation of the star formation and this would result in central surface brightnesses that are significantly lower than those of the brightest Sphs in galaxy clusters (Bothun et al. 1986; Davies & Phillipps 1988); and ii) most bright Sphs show central nuclei whereas Irrs do not (e.g., Côté et al. 2006; Lisker et al. 2007). In fact, regardless of the details of the triggering mechanism, the occurrence of a starburst in an Irr should necessarily i) create a central concentration of mass and increase the central surface brightness; and might possibly ii) form a central nucleus by the inspiralling and merging of star clusters (Gnedin et al. 2013), which are often found in BCDs (e.g., Annibali et al. 2009, 2011). In particular, the nuclei of Sphs are generally bluer than the overall stellar body (e.g., Lotz et al. 2004), suggesting that they contain younger stellar populations than the rest of the galaxy. Moreover, several Sphs in the Virgo cluster show central star formation and/or disk features (e.g., Lisker et al. 2006, 2007), further hinting at a possible link with BCDs and compact Irrs.
Finally, we point out that the rotating Sphs considered here have relatively high luminosities (− 16 ≲ MR ≲ −18 mag) and, thus, are at the top end of the M − μ0 relation (e.g., Kormendy et al. 2009). It is unclear whether Sphs with lower luminosities and surface brightnesses, as those in the Local Group, also show some ordered rotation (see e.g., Tolstoy et al. 2009) and what their location is in the VRd/Rd − μ0 diagram. Thus, the evolutionary scenario outlined above refers only to the brightest Sphs found in galaxy clusters. Typical LSB Irrs might evolve into LSB Sphs without going through a starbursting phase (e.g., Weisz et al. 2011).
6. Conclusions
We studied the structure and evolution of dwarf galaxies using a new dynamical quantity: the circular-velocity gradient dRV(0). This provides a direct measure of the inner steepness of the potential well of a galaxy and, thus, of its central dynamical mass density (including gas, stars, and dark matter). For bulgeless, low-mass galaxies, dRV(0) can be simply estimated as VRd/Rd, where Rd is the exponential scale length of the stellar body. We constructed a sample of 60 low-mass galaxies (including starbursting dwarfs, irregulars, and spheroidals), considering objects with high-quality H I and stellar rotation curves from the literature. Our results can be summarized as follows.
-
1.
For gas-rich dwarfs (Irrs and BCDs),VRd/Rd correlates with i) the central surface brightness
; ii) the mean H I surface density over the stellar body; and iii) the SFR surface density. -
2.
Starbursting dwarfs (BCDs) are different from typical Irrs. BCDs have high central surface brightnesses, high H I surface densities, and high circular-velocity gradients, implying that they have a strong central concentration of dynamical mass (luminous and/or dark). This suggests that the starburst is closely linked to the inner shape of the gravitational potential and the gas density.
-
3.
We identified several compact Irrs that have values of
, Rd, and VRd/Rd similar to those of BCDs. Compact Irrs are the best candidates to be the progenitors/descendants of BCDs. -
4.
Rotating Sphs in the Virgo cluster follow the same correlation between VRd/Rd and
determined by Irrs and BCDs. The Sphs in our sample have values of VRd/Rd similar to those of BCDs and compact Irrs. This suggests that BCDs and compact Irrs may evolve into rotating Sphs, provided that some external mechanism removes the entire ISM. -
5.
Similarly to spiral galaxies, the star-formation activity in dwarfs can be described by a law of the form ΣSFR = ϵ Σgas/τorb, where Σgas considers the atomic gas only, τorb is the orbital time on the solid-body portion of the rotation curve, and the fraction ϵ of atomic gas converted into stars during every orbit is ~2%.
Online material
Appendix A: asymmetric-drift correction
To calculate the asymmetric-drift correction, we start from Eq. (4-33) of Binney & Tremaine (1987), which describes a stationary, axisymmetric stellar system embedded in a gravitational potential Φ(R,z): ![Mathematical equation: \appendix \setcounter{section}{1} \begin{equation} \label{eq:asymDrift} V_{\rm{circ}}^{2} = \overline{v_{\phi}}^{2} - \sigma_{{R}}^{2} \left[ \dfrac{\partial \ln \rho}{\partial \ln R} + \dfrac{\partial \ln \sigma_{{R}}^{2}}{\partial \ln R} + 1 - \dfrac{\sigma_{\phi}^{2}}{\sigma_{{R}}^{2}} +\dfrac{R}{\sigma_{{R}}^{2}} \dfrac{\partial(\overline{v_{{R}}v_{z}})}{\partial z}\right], \end{equation}](/articles/aa/full_html/2014/03/aa22658-13/aa22658-13-eq212.png) (A.1)where vR, vz, and vφ are the components (in cylindrical coordinates) of the velocity of a star, ρ is the stellar density,
(A.1)where vR, vz, and vφ are the components (in cylindrical coordinates) of the velocity of a star, ρ is the stellar density,  ,
,  ,
,  , and
, and  . The observed stellar rotation curve vrot provides
  . Note that Eq. (A.1) does not require that the velocity dispersion is smaller than the rotation velocity. Following Weijmans et al. (2008), we write
  (A.2)where κ = 0 and κ = 1 correspond, respectively, to the extreme cases of a velocity ellipsoid aligned with the cylindrical (R, z, φ) and spherical (r, θ, φ) coordinate systems. Using higher-order velocity-moments of the collisionless Boltzmann equation, Weijmans et al. (2008) obtained the following expressions (see their Appendix A):
 ![Mathematical equation: \appendix \setcounter{section}{1} \begin{equation} \label{eq:sigF/sigR} \dfrac{\sigma_{\phi}^{2}}{\sigma_{{R}}^{2}} = \dfrac{1}{2} \left[ 1 + \alpha_{{R}} + \kappa \dfrac{1 - \sigma_{z}^{2}/\sigma_{{R}}^{2}}{1 - (z/R)^{2}} \alpha_{z} - \dfrac{\overline{(v_{\phi} - \overline{v_{\phi}})^{3}}}{\sigma_{{R}}^{2}\overline{v_{\phi}}} \right] \end{equation}](/articles/aa/full_html/2014/03/aa22658-13/aa22658-13-eq230.png) (A.3)and
(A.3)and  (A.4)where
  (A.5)The last term of Eq. (A.3) vanishes if the velocity ellipsoid is symmetric around . Since we want to estimate Vcirc at R ≃ Rd, this higher-order term can be safely ignored, as
  in the inner galaxy regions.
We now assume that the galaxy is in cylindrical rotation, i.e.  . Observationally, it is difficult to obtain information on the rotation velocities above the galaxy plane. A negative velocity gradient in the vertical direction, however, would produce an observable feature: asymmetric line profiles with a tail toward the systemic velocity. This means that a Gauss-Hermite polynomial-fit to the line profiles should give high values of the h3 term. This effect is observed, for example, in the lagging H I haloes of spiral galaxies (e.g., Fraternali et al. 2002). The stellar, absorption-line profiles of gas-poor dwarfs, instead, are quite symmetric and have | h3 | ≲ 0.1 (Halliday et al. 2001; Spolaor et al. 2010; Howley et al. 2013), implying that any vertical velocity gradient is relatively small. It is reasonable, therefore, to assume cylindrical rotation such that αz = 0. Thus, Eq. (A.4) gives σφ = σz.
Since we are interested in the inner circular-velocity gradient, we also assume that the galaxy is in solid-body rotation, i.e.  . All the Sphs in our sample, indeed, show nearly solid-body rotation curves out to the last measured point (cf. van Zee et al. 2004b) and thus αR = 1. Consequently, Eq. (A.3) gives σφ = σR (neglecting the higher-order term). Therefore, using observationally-motivated assumptions, we find that the Sphs in our sample can be approximated as isotropic rotators with σR = σz = σφ = σobs.
Finally, we assume that the scale height of the galaxy is constant with radius. Thus, we have ∂lnρ/∂lnR = ∂lnΣ/∂lnR, where Σ is the surface density profile (traced by the surface brightness profile). Assuming a Sérsic profile (Sérsic 1963), the asymmetric-drift-corrected circular velocity is given by ![Mathematical equation: \appendix \setcounter{section}{1} \begin{equation} \label{eq:asymFin} V_{\rm{circ}}^{2} = v_{\rm{rot}}^{2} + \sigma_{\rm{obs}}^{2} \left[ \dfrac{b_{n}}{n} \left( \dfrac{R}{R_{\rm{eff}}} \right)^{1/n} - 2 \dfrac{\partial \ln \sigma_{\rm{obs}}}{\partial \ln R} \right], \end{equation}](/articles/aa/full_html/2014/03/aa22658-13/aa22658-13-eq247.png) (A.6)where Reff is the effective radius, n is the Sérsic index, and bn is a constant that depends on n (see Ciotti 1991; Ciotti & Bertin 1999).
(A.6)where Reff is the effective radius, n is the Sérsic index, and bn is a constant that depends on n (see Ciotti 1991; Ciotti & Bertin 1999).
For rotating Sphs, the surface brightness profile can be fitted by an exponential law, thus n = 1 and b1 = 1.678. We also assume that σobs is constant with radius, as the observations generally provide only the mean value  . Therefore, Eq. (A.6) simplifies to
  , where Rd = 1.678Reff is the exponential scale length. In this case, the error δV/R on Vcirc/R is given by
 ![Mathematical equation: \appendix \setcounter{section}{1} \begin{eqnarray} \delta_{V{/}R}^{2} &= & \left[ \dfrac{v_{\rm{rot}}}{V_{\rm{circ}}} \dfrac{\delta_{v_{\rm{l.o.s.}}}}{R \sin(i)} \right]^{2} +\left[ \dfrac{v_{\rm{rot}}^{2}}{V_{\rm{circ}}R} \dfrac{\delta_{i}}{\tan(i)} \right]^{2}\nonumber \\ &&~~+ \left[ \dfrac{\overline{\sigma}_{\rm{obs}}}{V_{\rm{circ}}}\dfrac{\delta_{\overline{\sigma}_{\rm{obs}}}}{R_{\rm{d}}} \right]^{2} +\left[ \dfrac{V_{\rm{circ}}}{R} \dfrac{\delta_{D}}{D} \right]^{2}, \end{eqnarray}](/articles/aa/full_html/2014/03/aa22658-13/aa22658-13-eq258.png) (A.7)where D and i are, respectively, the galaxy distance and inclination (cf. with Eq. (3)).
(A.7)where D and i are, respectively, the galaxy distance and inclination (cf. with Eq. (3)).
Appendix B: tables
Appendix B.1: Tables B1 and B3: structural and dynamical properties of gas-rich dwarfs (BCDs and Irrs)
Column (1) gives the galaxy name. Columns (2)−(4) give the assumed distance, the distance indicator, and the corresponding reference. Columns (5)−(8) give the R-band absolute magnitude MR, the central R-band surface brightness (corrected for inclination), the scale length Rd, and the reference for the surface photometry. The structural parameters were derived from an exponential fit to the outer parts of the surface brightness profiles. All the quantities have been corrected for Galactic extinction, but not for internal extinction. Column (9) gives the galaxy inclination, derived by fitting a tilted-ring model to the H I velocity field and/or by building 3D model-cubes. Columns (10)−(13) give the circular velocity VRd at Rd, the circular velocity Vlast at the last measured point, the radius at Vlast, and the reference for the H I rotation curves. Values of Vlast in italics indicate rotation curves that do not reach the flat part. Column (14) gives the circular-velocity gradient VRd/Rd.
Sample of starbursting dwarfs: structural and dynamical properties.
Sample of starbursting dwarfs: gas and star-formation properties.
Appendix B.2: Tables B2 and B4: gas and star formation properties of gas-rich dwarfs (BCDs and Irrs)
Column (1) gives the galaxy name. Columns (2) and (3) give the gas metallicity and the respective reference. Values in italics indicate abundances derived using “strong-line” calibrations; we assigned to them a conservative error of 0.2 (cf. Berg et al. 2012). All the other abundances have been derived using the Te-method. Columns (4)−(6) give the H I mass, the mean H I surface density within Ropt = 3.2Rd (corrected for inclination), and the reference for the H I observations. Columns (7)−(9) give the Hα+[N II]equivalent width, the Hα star formation rate (SFR), and the reference for the Hα observations. SFRs have been calculated using the Kennicutt (1998a) calibration and have not been corrected for internal extinction. Columns (10) and (11) give the ratio SFR/Mbar and the SFR surface density ( ). Mbar has been estimated using the baryonic Tully-Fisher relation as calibrated by McGaugh (2012) with an accuracy of ~10%. Values of SFR/Mbar in italics indicate galaxies with rotation curves that do not reach the flat part, thus they may be slightly underestimated. Columns (12) and (13) give the global and local gas depletion times τglobal and τlocal. τglobal considers the total atomic gas mass of the galaxy, whereas τlocal considers the atomic gas mass within Ropt.
Appendix B.3: Table B5: structural and dynamical properties of gas-poor dwarfs (Sphs)
Column (1) gives the galaxy name. Columns (2)−(6) give the R-band absolute magnitude, the inclination i, the central surface brightness (corrected for i), the scale length, and the reference for the surface photometry. The inclination was estimated from the observed ellipticities using Eq. (6) with q0 = 0.35. The structural parameters were derived from an exponential fit to the outer parts of the surface brightness profiles. All the quantities have been corrected for Galactic extinction, but not for internal extinction. Columns (7)−(11) give the rotation velocity at Rd, the rotation velocity vlast at the last measured point, the radius at vlast, the mean velocity dispersion, and the reference for the stellar spectroscopy. All rotation velocities have been corrected for inclination. Columns (12)−(14) give the circular velocity at Rd, the circular velocity at Rlast, and the circular-velocity gradient. All the circular velocities have been corrected for asymmetric-drift (see Appendix A).
Sample of irregulars: structural and dynamical properties.
Sample of irregulars: gas and star-formation properties.
Sample of rotating spheroidals in the Virgo cluster.
Acknowledgments
We are grateful to Renzo Sancisi for sharing insights and ideas that fueled this investigation. We also thank Eline Tolstoy for stimulating discussions. F.L. acknowledges the Ubbo Emmius bursary program of the University of Groningen and the Leids Kerkhoven-Bosscha Fund. F.F. acknowledges financial support from PRIN MIUR 2010-2011, project “The Chemical and Dynamical Evolution of the Milky Way and Local Group Galaxies”, prot. 2010LY5N2T.
References
- Aloisi, A., van der Marel, R. P., Mack, J., et al. 2005, ApJ, 631, L45 [NASA ADS] [CrossRef] [Google Scholar]
- Aloisi, A., Clementini, G., Tosi, M., et al. 2007, ApJ, 667, L151 [NASA ADS] [CrossRef] [Google Scholar]
- Annibali, F., Tosi, M., Monelli, M., et al. 2009, AJ, 138, 169 [NASA ADS] [CrossRef] [Google Scholar]
- Annibali, F., Tosi, M., Aloisi, A., & van der Marel, R. P. 2011, AJ, 142, 129 [NASA ADS] [CrossRef] [Google Scholar]
- Ashley, T., Simpson, C. E., & Elmegreen, B. G. 2013, AJ, 146, 42 [NASA ADS] [CrossRef] [Google Scholar]
- Barnes, J. E., & Hernquist, L. 1996, ApJ, 471, 115 [NASA ADS] [CrossRef] [Google Scholar]
- Bekki, K. 2008, MNRAS, 388, L10 [Google Scholar]
- Bekki, K., & Freeman, K. C. 2002, ApJ, 574, L21 [NASA ADS] [CrossRef] [Google Scholar]
- Berg, D. A., Skillman, E. D., Marble, A. R., et al. 2012, ApJ, 754, 98 [NASA ADS] [CrossRef] [Google Scholar]
- Binggeli, B. 1994, in European Southern Observatory Conference and Workshop Proc., eds. G. Meylan, & P. Prugniel, 49, 13 [Google Scholar]
- Binggeli, B., Sandage, A., & Tammann, G. A. 1985, AJ, 90, 1681 [NASA ADS] [CrossRef] [Google Scholar]
- Binney, J., & Tremaine, S. 1987, Nature, 326, 219 [NASA ADS] [Google Scholar]
- Bono, G., Caputo, F., Marconi, M., & Musella, I. 2010, ApJ, 715, 277 [NASA ADS] [CrossRef] [Google Scholar]
- Bothun, G. D., Mould, J. R., Caldwell, N., & MacGillivray, H. T. 1986, AJ, 92, 1007 [NASA ADS] [CrossRef] [Google Scholar]
- Bournaud, F., Elmegreen, B. G., & Elmegreen, D. M. 2007, ApJ, 670, 237 [Google Scholar]
- Broeils, A. H. 1992, Dark and visible matter in spiral galaxies (Groningen: Rijksuniversiteit) [Google Scholar]
- Ciotti, L. 1991, A&A, 249, 99 [NASA ADS] [Google Scholar]
- Ciotti, L., & Bertin, G. 1999, A&A, 352, 447 [NASA ADS] [Google Scholar]
- Côté, P., Piatek, S., Ferrarese, L., et al. 2006, ApJS, 165, 57 [NASA ADS] [CrossRef] [MathSciNet] [Google Scholar]
- Cox, A. L., Sparke, L. S., Watson, A. M., & van Moorsel, G. 2001, AJ, 121, 692 [NASA ADS] [CrossRef] [Google Scholar]
- Croxall, K. V., van Zee, L., Lee, H., et al. 2009, ApJ, 705, 723 [NASA ADS] [CrossRef] [Google Scholar]
- Davies, J. I., & Phillipps, S. 1988, MNRAS, 233, 553 [NASA ADS] [CrossRef] [Google Scholar]
- de Blok, W. J. G., Walter, F., Brinks, E., et al. 2008, AJ, 136, 2648 [NASA ADS] [CrossRef] [Google Scholar]
- de Vaucouleurs, G., de Vaucouleurs, A., Corwin, Jr., H. G., et al. 1991, Third Reference Catalogue of Bright Galaxies, Volume I: Explanations and references. Volume II: Data for galaxies between 0 and 12, Volume III: Data for galaxies between 12 and 24 (New York: Springer) [Google Scholar]
- Dekel, A., & Birnboim, Y. 2006, MNRAS, 368, 2 [NASA ADS] [CrossRef] [Google Scholar]
- Dekel, A., & Silk, J. 1986, ApJ, 303, 39 [NASA ADS] [CrossRef] [Google Scholar]
- Dellenbusch, K. E., Gallagher, III, J. S., & Knezek, P. M. 2007, ApJ, 655, L29 [NASA ADS] [CrossRef] [Google Scholar]
- Dellenbusch, K. E., Gallagher, III, J. S., Knezek, P. M., & Noble, A. G. 2008, AJ, 135, 326 [NASA ADS] [CrossRef] [Google Scholar]
- Drozdovsky, I. O., & Karachentsev, I. D. 2000, A&AS, 142, 425 [NASA ADS] [CrossRef] [EDP Sciences] [Google Scholar]
- Drozdovsky, I. O., Schulte-Ladbeck, R. E., Hopp, U., Crone, M. M., & Greggio, L. 2001, ApJ, 551, L135 [NASA ADS] [CrossRef] [Google Scholar]
- Ekta, Chengalur, J. N., & Pustilnik, S. A. 2006, MNRAS, 372, 853 [NASA ADS] [CrossRef] [Google Scholar]
- Ekta, B., Pustilnik, S. A., & Chengalur, J. N. 2009, MNRAS, 397, 963 [NASA ADS] [CrossRef] [Google Scholar]
- Elmegreen, B. G., Zhang, H.-X., & Hunter, D. A. 2012, ApJ, 747, 105 [NASA ADS] [CrossRef] [Google Scholar]
- Elson, E. C., de Blok, W. J. G., & Kraan-Korteweg, R. C. 2010, MNRAS, 404, 2061 [NASA ADS] [Google Scholar]
- Elson, E. C., de Blok, W. J. G., & Kraan-Korteweg, R. C. 2011, MNRAS, 415, 323 [NASA ADS] [CrossRef] [Google Scholar]
- Esteban, C., Bresolin, F., Peimbert, M., et al. 2009, ApJ, 700, 654 [NASA ADS] [CrossRef] [Google Scholar]
- Ferguson, H. C., & Binggeli, B. 1994, A&ARv, 6, 67 [NASA ADS] [CrossRef] [Google Scholar]
- Fraternali, F., van Moorsel, G., Sancisi, R., & Oosterloo, T. 2002, AJ, 123, 3124 [NASA ADS] [CrossRef] [Google Scholar]
- Freeman, K. C. 1970, ApJ, 160, 811 [NASA ADS] [CrossRef] [Google Scholar]
- Gallagher, III, J. S., & Hunter, D. A. 1987, AJ, 94, 43 [NASA ADS] [CrossRef] [Google Scholar]
- García-Benito, R., & Pérez-Montero, E. 2012, MNRAS, 423, 406 [NASA ADS] [CrossRef] [Google Scholar]
- Gatto, A., Fraternali, F., Read, J. I., et al. 2013, MNRAS, 433, 2749 [NASA ADS] [CrossRef] [Google Scholar]
- Gentile, G., Angus, G. W., Famaey, B., Oh, S.-H., & de Blok, W. J. G. 2012, A&A, 543, A47 [NASA ADS] [CrossRef] [EDP Sciences] [Google Scholar]
- Gil de Paz, A., & Madore, B. F. 2005, ApJS, 156, 345 [NASA ADS] [CrossRef] [EDP Sciences] [Google Scholar]
- Gil de Paz, A., Madore, B. F., & Pevunova, O. 2003, ApJS, 147, 29 [NASA ADS] [CrossRef] [Google Scholar]
- Gnedin, O. Y., Ostriker, J. P., & Tremaine, S. 2013, ApJ, submitted [arXiv:1308.0021] [Google Scholar]
- Halliday, C., Davies, R. L., Kuntschner, H., et al. 2001, MNRAS, 326, 473 [NASA ADS] [CrossRef] [Google Scholar]
- Herrmann, K. A., Hunter, D. A., & Elmegreen, B. G. 2013, AJ, 146, 104 [NASA ADS] [CrossRef] [Google Scholar]
- Hoessel, J. G., Saha, A., & Danielson, G. E. 1998, AJ, 115, 573 [NASA ADS] [CrossRef] [Google Scholar]
- Holmberg, E. 1950, Meddelanden fran Lunds Astronomiska Observatorium Serie II, 128, 1 [NASA ADS] [Google Scholar]
- Howley, K. M., Guhathakurta, P., van der Marel, R., et al. 2013, ApJ, 765, 65 [NASA ADS] [CrossRef] [Google Scholar]
- Hunter, D. A., & Elmegreen, B. G. 2004, AJ, 128, 2170 [NASA ADS] [CrossRef] [Google Scholar]
- Hunter, D. A., & Elmegreen, B. G. 2006, ApJS, 162, 49 [NASA ADS] [CrossRef] [Google Scholar]
- Hunter, D. A., & Hoffman, L. 1999, AJ, 117, 2789 [NASA ADS] [CrossRef] [Google Scholar]
- Immeli, A., Samland, M., Gerhard, O., & Westera, P. 2004, A&A, 413, 547 [NASA ADS] [CrossRef] [EDP Sciences] [Google Scholar]
- Izotov, Y. I., & Thuan, T. X. 1999, ApJ, 511, 639 [NASA ADS] [CrossRef] [Google Scholar]
- Izotov, Y. I., & Thuan, T. X. 2002, ApJ, 567, 875 [Google Scholar]
- Jackson, D. C., Skillman, E. D., Cannon, J. M., & Côté, S. 2004, AJ, 128, 1219 [NASA ADS] [CrossRef] [Google Scholar]
- Jacobs, B. A., Rizzi, L., Tully, R. B., et al. 2009, AJ, 138, 332 [NASA ADS] [CrossRef] [MathSciNet] [Google Scholar]
- James, P. A., Shane, N. S., Beckman, J. E., et al. 2004, A&A, 414, 23 [NASA ADS] [CrossRef] [EDP Sciences] [Google Scholar]
- Karachentsev, I. D., Makarov, D. I., Sharina, M. E., et al. 2003, A&A, 398, 479 [NASA ADS] [CrossRef] [EDP Sciences] [Google Scholar]
- Kelson, D. D., Illingworth, G. D., Tonry, J. L., et al. 2000, ApJ, 529, 768 [NASA ADS] [CrossRef] [Google Scholar]
- Kennicutt, Jr., R. C. 1989, ApJ, 344, 685 [NASA ADS] [CrossRef] [Google Scholar]
- Kennicutt, Jr., R. C. 1998a, ARA&A, 36, 189 [Google Scholar]
- Kennicutt, Jr., R. C. 1998b, ApJ, 498, 541 [NASA ADS] [CrossRef] [Google Scholar]
- Kennicutt, R. C., & Evans, N. J. 2012, ARA&A, 50, 531 [NASA ADS] [CrossRef] [Google Scholar]
- Kennicutt, Jr., R. C., Lee, J. C., Funes, S. J., et al. 2008, ApJS, 178, 247 [NASA ADS] [CrossRef] [Google Scholar]
- Kepley, A. A., Wilcots, E. M., Hunter, D. A., & Nordgren, T. 2007, AJ, 133, 2242 [NASA ADS] [CrossRef] [Google Scholar]
- Kereš, D., Katz, N., Weinberg, D. H., & Davé, R. 2005, MNRAS, 363, 2 [NASA ADS] [CrossRef] [Google Scholar]
- Koribalski, B. S., Staveley-Smith, L., Kilborn, V. A., et al. 2004, AJ, 128, 16 [NASA ADS] [CrossRef] [Google Scholar]
- Kormendy, J. 1985, ApJ, 295, 73 [NASA ADS] [CrossRef] [Google Scholar]
- Kormendy, J., & Bender, R. 2012, ApJS, 198, 2 [NASA ADS] [CrossRef] [Google Scholar]
- Kormendy, J., Fisher, D. B., Cornell, M. E., & Bender, R. 2009, ApJS, 182, 216 [NASA ADS] [CrossRef] [Google Scholar]
- Leaman, R., Venn, K. A., Brooks, A. M., et al. 2012, ApJ, 750, 33 [NASA ADS] [CrossRef] [Google Scholar]
- Lee, H., Skillman, E. D., & Venn, K. A. 2005, ApJ, 620, 223 [NASA ADS] [CrossRef] [Google Scholar]
- Lee, J. C., Gil de Paz, A., Tremonti, C., et al. 2009a, ApJ, 706, 599 [NASA ADS] [CrossRef] [Google Scholar]
- Lee, J. C., Kennicutt, Jr., R. C.,Funes, S. J. J. G., Sakai, S., & Akiyama, S. 2009b, ApJ, 692, 1305 [NASA ADS] [CrossRef] [Google Scholar]
- Lelli, F., Verheijen, M., Fraternali, F., & Sancisi, R. 2012a, A&A, 537, A72 [NASA ADS] [CrossRef] [EDP Sciences] [Google Scholar]
- Lelli, F., Verheijen, M., Fraternali, F., & Sancisi, R. 2012b, A&A, 544, A145 [NASA ADS] [CrossRef] [EDP Sciences] [Google Scholar]
- Lelli, F., Fraternali, F., & Verheijen, M. 2013, MNRAS, 433, L30 [NASA ADS] [CrossRef] [Google Scholar]
- Lelli, F., Verheijen, M., & Fraternali, F. 2014, A&A, submitted [Google Scholar]
- Leroy, A. K., Walter, F., Brinks, E., et al. 2008, AJ, 136, 2782 [NASA ADS] [CrossRef] [Google Scholar]
- Lisker, T., Glatt, K., Westera, P., & Grebel, E. K. 2006, AJ, 132, 2432 [NASA ADS] [CrossRef] [Google Scholar]
- Lisker, T., Grebel, E. K., Binggeli, B., & Glatt, K. 2007, ApJ, 660, 1186 [NASA ADS] [CrossRef] [Google Scholar]
- López-Sánchez, A. R., Koribalski, B., van Eymeren, J., et al. 2010, in Galaxies in Isolation: Exploring Nature Versus Nurture, eds. L. Verdes-Montenegro, A. Del Olmo, & J. Sulentic, ASP Conf. Ser., 421, 65 [Google Scholar]
- Lotz, J. M., Miller, B. W., & Ferguson, H. C. 2004, ApJ, 613, 262 [NASA ADS] [CrossRef] [MathSciNet] [Google Scholar]
- Marlowe, A. T., Meurer, G. R., & Heckman, T. M. 1999, ApJ, 522, 183 [NASA ADS] [CrossRef] [Google Scholar]
- Martin, C. L. 1996, ApJ, 465, 680 [NASA ADS] [CrossRef] [Google Scholar]
- Martin, C. L. 1998, ApJ, 506, 222 [NASA ADS] [CrossRef] [Google Scholar]
- Martin, C. L., & Kennicutt, Jr., R. C. 2001, ApJ, 555, 301 [NASA ADS] [CrossRef] [Google Scholar]
- Mateo, M. L. 1998, ARA&A, 36, 435 [NASA ADS] [CrossRef] [Google Scholar]
- Mayer, L. 2011, in EAS Publ. Ser. 48, eds. M. Koleva, P. Prugniel, & I. Vauglin, 369 [Google Scholar]
- Mayer, L., Mastropietro, C., Wadsley, J., Stadel, J., & Moore, B. 2006, MNRAS, 369, 1021 [NASA ADS] [CrossRef] [Google Scholar]
- McGaugh, S. S. 2012, AJ, 143, 40 [NASA ADS] [CrossRef] [Google Scholar]
- McGaugh, S. S., & Wolf, J. 2010, ApJ, 722, 248 [NASA ADS] [CrossRef] [Google Scholar]
- McQuinn, K. B. W., Skillman, E. D., Cannon, J. M., et al. 2010a, ApJ, 721, 297 [NASA ADS] [CrossRef] [Google Scholar]
- McQuinn, K. B. W., Skillman, E. D., Cannon, J. M., et al. 2010b, ApJ, 724, 49 [NASA ADS] [CrossRef] [Google Scholar]
- McQuinn, K. B. W., Skillman, E. D., Dalcanton, J. J., et al. 2012, ApJ, 759, 77 [NASA ADS] [CrossRef] [Google Scholar]
- Meurer, G. R., Mackie, G., & Carignan, C. 1994, AJ, 107, 2021 [NASA ADS] [CrossRef] [Google Scholar]
- Meurer, G. R., Staveley-Smith, L., & Killeen, N. E. B. 1998, MNRAS, 300, 705 [NASA ADS] [CrossRef] [Google Scholar]
- Micheva, G., Östlin, G., Bergvall, N., et al. 2013, MNRAS, 431, 102 [NASA ADS] [CrossRef] [Google Scholar]
- Minchev, I., Famaey, B., Combes, F., et al. 2011, A&A, 527, A147 [NASA ADS] [CrossRef] [EDP Sciences] [Google Scholar]
- Moore, B., Lake, G., & Katz, N. 1998, ApJ, 495, 139 [NASA ADS] [CrossRef] [Google Scholar]
- Noeske, K. G., Guseva, N. G., Fricke, K. J., et al. 2000, A&A, 361, 33 [NASA ADS] [Google Scholar]
- Oh, S.-H., de Blok, W. J. G., Brinks, E., Walter, F., & Kennicutt, Jr., R. C. 2011, AJ, 141, 193 [NASA ADS] [CrossRef] [Google Scholar]
- Ott, J., Walter, F., & Brinks, E. 2005a, MNRAS, 358, 1423 [NASA ADS] [CrossRef] [Google Scholar]
- Ott, J., Walter, F., & Brinks, E. 2005b, MNRAS, 358, 1453 [NASA ADS] [CrossRef] [Google Scholar]
- Papaderos, P., Loose, H.-H., Fricke, K. J., & Thuan, T. X. 1996, A&A, 314, 59 [NASA ADS] [Google Scholar]
- Papaderos, P., Izotov, Y. I., Thuan, T. X., et al. 2002, A&A, 393, 461 [NASA ADS] [CrossRef] [EDP Sciences] [Google Scholar]
- Rafikov, R. R. 2001, MNRAS, 323, 445 [NASA ADS] [CrossRef] [Google Scholar]
- Roychowdhury, S., Chengalur, J. N., Begum, A., & Karachentsev, I. D. 2009, MNRAS, 397, 1435 [NASA ADS] [CrossRef] [Google Scholar]
- Sánchez-Janssen, R., Méndez-Abreu, J., & Aguerri, J. A. L. 2010, MNRAS, 406, L65 [NASA ADS] [Google Scholar]
- Sandage, A., & Hoffman, G. L. 1991, ApJ, 379, L45 [NASA ADS] [CrossRef] [Google Scholar]
- Schulte-Ladbeck, R. E., Hopp, U., Greggio, L., Crone, M. M., & Drozdovsky, I. O. 2001, AJ, 121, 3007 [NASA ADS] [CrossRef] [Google Scholar]
- Schwartz, C. M., & Martin, C. L. 2004, ApJ, 610, 201 [NASA ADS] [CrossRef] [Google Scholar]
- Sérsic, J. L. 1963, Boletín de la Asociación Argentina de Astronomía, 6, 41 [Google Scholar]
- Simpson, C. E., & Gottesman, S. T. 2000, AJ, 120, 2975 [NASA ADS] [CrossRef] [Google Scholar]
- Spolaor, M., Hau, G. K. T., Forbes, D. A., & Couch, W. J. 2010, MNRAS, 408, 254 [NASA ADS] [CrossRef] [Google Scholar]
- Swaters, R. A., & Balcells, M. 2002, A&A, 390, 863 [NASA ADS] [CrossRef] [EDP Sciences] [Google Scholar]
- Swaters, R. A., van Albada, T. S., van der Hulst, J. M., & Sancisi, R. 2002, A&A, 390, 829 [NASA ADS] [CrossRef] [EDP Sciences] [Google Scholar]
- Swaters, R. A., Sancisi, R., van Albada, T. S., & van der Hulst, J. M. 2009, A&A, 493, 871 [NASA ADS] [CrossRef] [EDP Sciences] [Google Scholar]
- Tammann, G. A. 1994, in European Southern Observatory Conf. Workshop Proc., eds. G. Meylan, & P. Prugniel, 49, 3 [Google Scholar]
- Taylor, C. L., Kobulnicky, H. A., & Skillman, E. D. 1998, AJ, 116, 2746 [NASA ADS] [CrossRef] [Google Scholar]
- Terlevich, R., Melnick, J., Masegosa, J., Moles, M., & Copetti, M. V. F. 1991, A&AS, 91, 285 [NASA ADS] [Google Scholar]
- Thim, F., Hoessel, J. G., Saha, A., et al. 2004, AJ, 127, 2322 [NASA ADS] [CrossRef] [Google Scholar]
- Tolstoy, E., Saha, A., Hoessel, J. G., & McQuade, K. 1995, AJ, 110, 1640 [NASA ADS] [CrossRef] [Google Scholar]
- Tolstoy, E., Hill, V., & Tosi, M. 2009, ARA&A, 47, 371 [NASA ADS] [CrossRef] [Google Scholar]
- Toomre, A. 1964, ApJ, 139, 1217 [NASA ADS] [CrossRef] [Google Scholar]
- Tosi, M., Sabbi, E., Bellazzini, M., et al. 2001, AJ, 122, 1271 [NASA ADS] [CrossRef] [Google Scholar]
- Tully, R. B. 1988, Nearby galaxies catalog, VizieR On-line Data Catalog: VII/145 [Google Scholar]
- Tully, R. B., Verheijen, M. A. W., Pierce, M. J., Huang, J.-S., & Wainscoat, R. J. 1996, AJ, 112, 2471 [NASA ADS] [CrossRef] [Google Scholar]
- Tully, R. B., Rizzi, L., Shaya, E. J., et al. 2009, AJ, 138, 323 [NASA ADS] [CrossRef] [Google Scholar]
- van Eymeren, J., Marcelin, M., Koribalski, B., et al. 2009a, A&A, 493, 511 [NASA ADS] [CrossRef] [EDP Sciences] [Google Scholar]
- van Eymeren, J., Marcelin, M., Koribalski, B. S., et al. 2009b, A&A, 505, 105 [NASA ADS] [CrossRef] [EDP Sciences] [Google Scholar]
- van Eymeren, J., Koribalski, B. S., López-Sánchez, Á. R., Dettmar, R.-J., & Bomans, D. J. 2010, MNRAS, 407, 113 [NASA ADS] [CrossRef] [Google Scholar]
- van Zee, L. 2001, AJ, 121, 2003 [NASA ADS] [CrossRef] [Google Scholar]
- van Zee, L., & Haynes, M. P. 2006, ApJ, 636, 214 [NASA ADS] [CrossRef] [Google Scholar]
- van Zee, L., Skillman, E. D., & Salzer, J. J. 1998, AJ, 116, 1186 [NASA ADS] [CrossRef] [Google Scholar]
- van Zee, L., Salzer, J. J., & Skillman, E. D. 2001, AJ, 122, 121 [NASA ADS] [CrossRef] [Google Scholar]
- van Zee, L., Barton, E. J., & Skillman, E. D. 2004a, AJ, 128, 2797 [NASA ADS] [CrossRef] [Google Scholar]
- van Zee, L., Skillman, E. D., & Haynes, M. P. 2004b, AJ, 128, 121 [NASA ADS] [CrossRef] [Google Scholar]
- Verheijen, M. A. W. 2001, ApJ, 563, 694 [NASA ADS] [CrossRef] [Google Scholar]
- Verheijen, M. A. W., & Sancisi, R. 2001, A&A, 370, 765 [NASA ADS] [CrossRef] [EDP Sciences] [Google Scholar]
- Weijmans, A.-M., Krajnović, D., van de Ven, G., et al. 2008, MNRAS, 383, 1343 [NASA ADS] [CrossRef] [Google Scholar]
- Weisz, D. R., Skillman, E. D., Cannon, J. M., et al. 2008, ApJ, 689, 160 [NASA ADS] [CrossRef] [Google Scholar]
- Weisz, D. R., Dalcanton, J. J., Williams, B. F., et al. 2011, ApJ, 739, 5 [NASA ADS] [CrossRef] [Google Scholar]
- Weldrake, D. T. F., de Blok, W. J. G., & Walter, F. 2003, MNRAS, 340, 12 [NASA ADS] [CrossRef] [Google Scholar]
All Tables
All Figures
|
Fig. 1 Left: circular-velocity gradient VRd/Rd versus R-band central surface brightness (inclination corrected). Right: VRd/Rd versus the mean H I surface density within Ropt. The black dots and squares show, respectively, BCDs with a diffuse/off-centered starburst and BCDs with a centrally-concentrated starburst. The blue dots and squares show, respectively, typical Irrs and compact Irrs (see Sect. 4.1 for details). The dashed lines show a linear-fit to the data. |
| In the text | |
|
Fig. 2 Left: VRd/Rd versus circular velocity at the last measured point Vlast. Middle: VRd/Rd versus SFR/Mbar, where Mbar is estimated using the baryonic TF relation. Right: VRd/Rd versus the Hα+[N II]equivalent width. Symbols are the same as in Fig. 1, except for the left and middle panels, where open symbols indicate galaxies with rotation curves that keep rising at Vlast, thus their value of SFR/Mbar may be overestimated. |
| In the text | |
|
Fig. 3 Left: VRd/Rd versus SFR surface density ΣSFR. The dashed line shows a linear-fit to the data. The position of the post-starburst dwarf galaxy NGC 6789 is indicated. Right: ΣSFR versus Σgas/τorb, where Σgas considers the atomic gas only and τorb is the orbital time on the solid-body portion of the rotation curve. The dashed lines show a linear relation for different values of ϵ. Symbols are the same as in Fig. 1. |
| In the text | |
|
Fig. 4 Left:VRd/Rd versus local gas-depletion time, that considers the atomic gas mass within Ropt. The dashed line shows a linear fit to the data. Right: VRd/Rd versus the total gas-depletion time, that considers the total atomic gas mass. The dashed line shows the maximum duration of a typical starburst (~1 Gyr). Symbols are the same as in Fig. 1. |
| In the text | |
|
Fig. 5 Left:VRd/Rd versus |
| In the text | |
Current usage metrics show cumulative count of Article Views (full-text article views including HTML views, PDF and ePub downloads, according to the available data) and Abstracts Views on Vision4Press platform.
Data correspond to usage on the plateform after 2015. The current usage metrics is available 48-96 hours after online publication and is updated daily on week days.
Initial download of the metrics may take a while.