Fig. 3
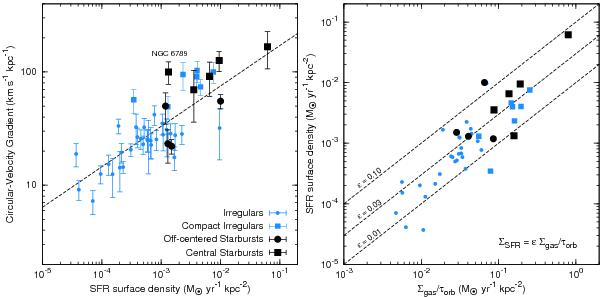
Left: VRd/Rd versus SFR surface density ΣSFR. The dashed line shows a linear-fit to the data. The position of the post-starburst dwarf galaxy NGC 6789 is indicated. Right: ΣSFR versus Σgas/τorb, where Σgas considers the atomic gas only and τorb is the orbital time on the solid-body portion of the rotation curve. The dashed lines show a linear relation for different values of ϵ. Symbols are the same as in Fig. 1.
Current usage metrics show cumulative count of Article Views (full-text article views including HTML views, PDF and ePub downloads, according to the available data) and Abstracts Views on Vision4Press platform.
Data correspond to usage on the plateform after 2015. The current usage metrics is available 48-96 hours after online publication and is updated daily on week days.
Initial download of the metrics may take a while.