Fig. 4
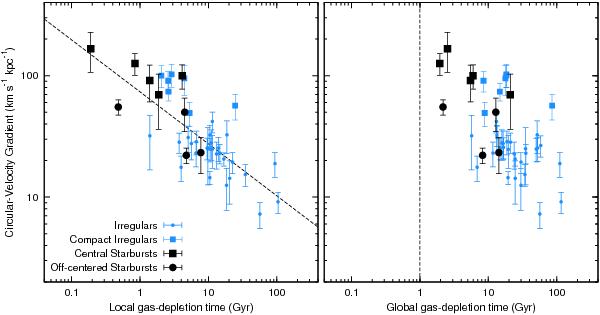
Left:VRd/Rd versus local gas-depletion time, that considers the atomic gas mass within Ropt. The dashed line shows a linear fit to the data. Right: VRd/Rd versus the total gas-depletion time, that considers the total atomic gas mass. The dashed line shows the maximum duration of a typical starburst (~1 Gyr). Symbols are the same as in Fig. 1.
Current usage metrics show cumulative count of Article Views (full-text article views including HTML views, PDF and ePub downloads, according to the available data) and Abstracts Views on Vision4Press platform.
Data correspond to usage on the plateform after 2015. The current usage metrics is available 48-96 hours after online publication and is updated daily on week days.
Initial download of the metrics may take a while.