| Issue |
A&A
Volume 563, March 2014
|
|
|---|---|---|
| Article Number | A6 | |
| Number of page(s) | 4 | |
| Section | Extragalactic astronomy | |
| DOI | https://doi.org/10.1051/0004-6361/201321604 | |
| Published online | 25 February 2014 | |
Research Note
A search for lines in the bright X-ray afterglow of GRB 120711A
INAF, Istituto di Astrofisica Spaziale e Fisica Cosmica Milano, via E.
Bassini 15
20133
Milano
Italy
e-mail:
This email address is being protected from spambots. You need JavaScript enabled to view it.
Received:
30
March
2013
Accepted:
14
July
2013
Abstract
Gamma-ray burst (GRB) 120711A, discovered and rapidly localized by the INTEGRAL satellite, attracted particular interest due to its high γ-ray fluence and very bright X-ray afterglow and due to the detection of a prompt optical transient and long-lasting emission at GeV energies. A follow-up observation carried out with the XMM-Newton satellite has provided an X-ray spectrum in the 0.3−10 keV with unprecedented statistics for a GRB afterglow that is 20 h after the burst. The spectrum is well fit by a power-law with photon index 1.87 ± 0.01, modified by absorption in our Galaxy and at z = 1.4 in the GRB host. A Galactic absorption consistent with that estimated from neutral hydrogen observations is obtained only with a host metallicity lower than 5% of the solar value. We report the results of a sensitive search for emission and absorption lines using the matched filter smoothing method. No statistically significant lines were found. The upper limits on the equivalent width of emission lines, derived through Monte Carlo simulations, are a few tens of eV with a factor ~10 lower than that of the possible lines reported in the literature for other bursts.
Key words: X-rays: bursts
© ESO, 2014
1. Introduction
A few detections of X-ray emission and absorption lines in gamma-ray bursts (GRB) were reported in the first years after the discovery of GRB afterglows (Piro et al. 2000; Yoshida et al. 2001; Watson et al. 2002; Reeves et al. 2003; Butler et al. 2003; Mereghetti et al. 2003b), based on data obtained with the BeppoSAX, ASCA, XMM-Newton, and Chandra satellites. Although the statistical significance of these detections was never higher than 5σ and more typically around 3σ, these results attracted considerable interest in view of the potential diagnostic for the physics of GRBs and the properties of their environments offered by these putative features (Vietri et al. 2001,and references therein).
After the launch of Swift, it has become possible to explore the afterglows at earlier times, but a comprehensive analysis of 40 afterglows observed with the Swift/XRT instrument failed to detect statistically significant lines (Hurkett et al. 2008). A critical assessment of the possible line features in the nine afterglows reported before 2004 was presented in Sako et al. (2005). These authors performed a uniform, systematic analysis of the spectra obtained with the different instruments and estimated the significance of the lines with Monte Carlo simulations. They also properly considered that the line energies, in the absence of a known redshift, should be considered as free parameters. This increases the number of independent searches and the detection significances have to be reduced accordingly. In their analysis, Sako et al. (2005) obtained lower significances for these lines, compared to those claimed in the previous papers. Other effects, such as the different continuum components adopted in the spectral fit, the estimates of the background, and imperfections in the instrumental response matrices, can also lead to discordant results on the line detections significance. For example, the lines from low-Z elements in GRB 011211, according to Butler et al. (2005), are at the ~3σ level only if the interstellar absorption is fixed at the Galactic value, while their significance decreases if the column density is allowed to vary.
Even if the statistical evaluation is done properly and all the technical issues are carefully considered, a great limitation to line searches comes from the small counting statistics of the available spectra. The instrument with the largest collecting area used so far in these studies is the EPIC camera on XMM-Newton, but its observations are generally done when the afterglow flux has significantly decreased, since a few hours are needed to re-point this satellite after a GRB discovery.
We report here on an XMM-Newton observation of the very bright GRB 120711A which offers the possibility of carring out a very sensitive search for spectral features, providing an afterglow spectrum of unprecedented statistics.
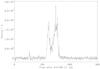 |
Fig. 1 Light curve of GRB 120711A at E > 80 keV in bins of 0.5 s measured with the anti-coincidence system of the SPI instrument. |
2. GRB 120711A
GRB 120711A was discovered with the IBIS instrument (Ubertini et al. 2003) on the INTEGRAL satellite (Gotz et al. 2012). Its light curve, obtained with the anti-coincidence system (ACS) of the INTEGRAL SPI instrument (von Kienlin et al. 2003), is shown in Fig. 1. The INTEGRAL Burst Alert System (IBAS, Mereghetti et al. 2003a) triggered on the precursor peak that occurred at about 02:44:50 UT. The rapid IBAS localization allowed the identification of an optical transient (Lacluyze et al. 2012b), reaching a V band magnitude of ~12 roughly 112 s after the trigger (Lacluyze et al. 2012a), while the hard X-ray prompt emission was still active.
The burst had a fluence of 5 × 10⁵ ACS counts, which corresponds to ~5 × 10⁻⁵ erg cm-2 in the 75 keV−1 MeV energy range1. This agrees with the values of a few 10-4 erg cm-2 (E > 20 keV) as measured by several other instruments (Hanlon et al. 2012; Golenetskii et al. 2012; Gruber & Pelassa 2012).
The Gamma-Ray Burst 120711A is among the bursts with the highest fluence ever detected (see. e.g. Goldstein et al. 2012; Meegan et al. 1996). Its time integrated spectrum is well described by a Band function with typical parameters of hard GRBs, α = −1, β ~ −2.5 and Epeak ~ 1 MeV (Gruber & Pelassa 2012; Golenetskii et al. 2012).
The X-ray afterglow of GRB 120711A was also particularly bright. Immediately after the main
burst, significant emission at energy above ~15 keV was detected for at least 1000 s in IBIS (Bozzo et al. 2012) and for 800 s in the 20−100 keV range with SPI (Hanlon et al. 2012). Swift/XRT started to observe the
GRB position 2.3 h after the prompt emission and detected X-ray emission with a light curve
decaying as a power-law with index  (Beardmore & Evans 2012). The X-ray flux
measured 11 h after the burst was 2.96 × 10⁻¹¹ erg cm-2 s-1. Compared to all the other X-ray
afterglows observed by Swift, this is the third brightest ever, lying at
about 3σ from
the average in the distribution of the afterglow fluxes measured with
Swift/XRT.
(Beardmore & Evans 2012). The X-ray flux
measured 11 h after the burst was 2.96 × 10⁻¹¹ erg cm-2 s-1. Compared to all the other X-ray
afterglows observed by Swift, this is the third brightest ever, lying at
about 3σ from
the average in the distribution of the afterglow fluxes measured with
Swift/XRT.
A suggested photometric redshift of z ~ 3 (Elliott et al. 2012) was not confirmed by optical spectroscopic observations, which showed, instead, absorption lines of MgII and FeII at z = 1.405 (Tanvir et al. 2012). In the following, we assume this value for the redshift of GRB 120711A.
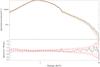 |
Fig. 2 Upper panel: spectrum of the X-ray afterglow of GRB 120711A convolved with a Gaussian as described in the text (black solid line). The best-fit model is shown by the green line. The dashed lines are the percentile curves obtained with the simulations for emission and absorption lines. They correspond to single-trial detection significance of 2, 3, and 4σ. Lower panel: same curves of the upper panel, normalised by dividing by the best-fit model. |
3. Observations and data reduction
The XMM-Newton satellite started to observe the afterglow of GRB 120711A on July 12, 2012 at 00:30 UT. The observation lasted 52 ks. We concentrate here on the data obtained with the EPIC pn instrument, which consists of a CCD camera operating in the 0.2−12 keV energy range with an energy resolution (FWHM) of ~90 eV at 1.5 keV and ~150 eV at 6 keV (Strüder et al. 2001). The instrument was operating in the full frame mode, giving a time resolution of 73 ms, and with the thin optical blocking filter.
We processed the EPIC data with the twelfth version of the XMM-Newton Standard Analysis Software (SAS v12). The data from a few time intervals of enhanced background were discarded, which resulted in a live time exposure of 35.2 ks. For the source spectrum, we used mono- and bi-pixel events (PATTERN ≤ 4) extracted from a circular region with a radius of 40′′ and rebinned to have at least 30 counts for each energy channel. The background spectrum was extracted from a source-free region on the same chip as the target. Spectral fits were done with the XSPEC 12.7.0 package. For the Galactic interstellar absorption we used the phabs model, with abundances from Anders & Grevesse (1989).
4. Spectral analysis
We fit the EPIC/pn spectrum in the 0.3−10 keV energy range with a power law model modified by interstellar
absorption in our Galaxy,  , and in the
GRB host,
, and in the
GRB host,  , with redshift fixed at
z = 1.405.
The best fit obtained using solar abundances in the host absorption resulted in a low
, which is
inconsistent with the value of 7.8 × 1020 cm-2 that is estimated from HI observations in this direction
(Kalberla et al. 2005). Allowing the metallicity in
the host absorption to vary resulted in metals abundances ≲10% solar and
=
(8.5
, with redshift fixed at
z = 1.405.
The best fit obtained using solar abundances in the host absorption resulted in a low
, which is
inconsistent with the value of 7.8 × 1020 cm-2 that is estimated from HI observations in this direction
(Kalberla et al. 2005). Allowing the metallicity in
the host absorption to vary resulted in metals abundances ≲10% solar and
=
(8.5 cm-2, which is fully consistent with
the Galactic value. We therefore fixed
cm-2, which is fully consistent with
the Galactic value. We therefore fixed  cm-2 and obtained the following best
fit parameters: power-law photon index Γ = 1.87 ± 0.01, unabsorbed 0.3−10 keV flux F = (8.7 ± 0.1) × 10-12 erg
cm-2
s-1,
cm-2 and obtained the following best
fit parameters: power-law photon index Γ = 1.87 ± 0.01, unabsorbed 0.3−10 keV flux F = (8.7 ± 0.1) × 10-12 erg
cm-2
s-1,
 =
(5.1
=
(5.1 cm-2, and metallicity <0.05 solar (reduced
χ2 = 1.13 for 154 d.o.f.).
cm-2, and metallicity <0.05 solar (reduced
χ2 = 1.13 for 154 d.o.f.).
Hurkett et al. (2008) compared different approaches commonly used to search for lines in X-ray spectra. They showed that the highest sensitivity is obtained with the analysis based on Bayesian posterior predictive probabilities (Protassov et al. 2002) or with the matched filter smoothing method (Rutledge & Sako 2003). In our analysis of the afterglow spectrum of GRB 120711A, we implemented the matched filter smoothing algorithm as follows.
The background-subtracted counts spectrum was convolved with a Gaussian with energy-dependent width σ(E). To properly consider the instrument energy resolution at the time of our observation, we derived σ(E) by fitting the response matrix produced with the SAS task rmfgen. The resulting values of σ(E) are well approximated by the relation σ(E) = a + bE + cE2 with a = 0.0422, b = 0.0100, c = −0.000535 and the energy E in keV. These values differ from those used in Rutledge & Sako (2003) due to the degradation of the CCD performances with time, which resulted in a ~20% worse energy resolution. The Gaussian-convolved spectrum is shown in Fig. 2.
To establish the threshold values to use in the line search, we simulated 105 spectra with the best fit continuum model described above and convolved them in the same way used for the GRB 120711A data. The distributions of the resulting number of counts in each energy channel were then used to derive the percentile curves shown by the dashed lines in Fig. 2, which correspond to single trial detection significances of 2, 3, and 4σ. The convolved data and threshold levels, divided by the model for a better visualization, are shown in the bottom panel of the figure.
The largest deviations in the observed spectrum, occurring at ~6.80 and ~8.23 keV, reach only the 3σ confidence level. Given that there is no a priori reason to expect a line at any of these energies, we have to consider the number of independent trials, which can be taken as the number of resolution elements, ~120, in the explored energy range, which makes the detection not significant. We repeated the analysis using the model with parameters fixed at the values corresponding to their 2σ error regions. No significant features were found. We therefore conclude that there is no evidence of emission or absorption lines in the EPIC/pn spectrum of the GRB 120711A afterglow.
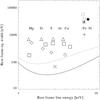 |
Fig. 3 Upper limits on the equivalent width of emission lines in the afterglow of GRB 120711A in the case of narrow (ΔE = 0 eV, solid curve) or wide (ΔE = 200 eV, dotted curve) lines. The curves give the best fit (with a 4th-order logarithmic polynomial) to the values obtained from simulations. For comparison, the rest-frame equivalent widths reported for other GRBs are also plotted: ◯ GRB 970828, ▽ GRB 970508, + GRB 991216, ∗ GRB 000214, △ GRB 001025, squares GRB 010220, filled diamond GRB 011211, × GRB 020813, and ♢ GRB 030227. The energies corresponding to the transition n = 2 → 1 for some H-like ions are also indicated. |
To estimate the upper limits on emission lines, we simulated spectra of GRB 120711A with Gaussian lines of different widths, centroid energy, and intensity that were added to the continuum model. In this way, we determined the line intensities that would exceed our 4σ threshold in more than 90% of the cases. These intensities are plotted in Fig. 3 for the cases of ΔE = 0 (i.e., non-resolved lines) and ΔE = 200 eV and for the best fit model with z = 1.405. The value of ΔE = 200 eV represents lines previously reported in the literature (see Sako et al. 2005). As done for the emission lines, the limits for the lines in absorption were computed assuming Gaussian profiles with widths of 0 eV and 200 eV. These limits are shown in Fig. 4 in terms of optical depth at line center.
Two further XMM-Newton observations of GRB 120711A were performed on 2012 July 28−29 and August 15. Although they provide a lower sensitivity compared to the first observation due to the source’s fainter flux and shorter exposure time, we also analysed these data to search for emission lines, possibly appearing at a late time. None was found with equivalent width upper limits about one order of magnitude higher than those of Fig. 3.
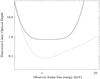 |
Fig. 4 Upper limits on the optical depth at line center of absorption lines in the afterglow of GRB 120711A in the case of narrow (ΔE = 0 eV, solid curve) or wide (ΔE = 200 eV, dotted curve) lines. The curves give the best fit (with a 4th-order logarithmic polynomial) to the values obtained from simulations. |
5. Discussion and conclusions
Thanks to the large number of counts collected in the afterglow spectrum of GRB 120711A with the XMM-Newton EPIC: instrument, we have performed a search for emission and absorption lines with unprecedented sensitivity. The EPIC/pn spectrum that we analyzed contained ~50 000 net counts. For comparison, the afterglow spectrum with the highest statistics previously available was GRB 040106 (~23 000 net counts in the EPIC pn plus MOS cameras, Sako et al. 2005). A few features were found in its spectrum, of which the brightest was an emission line at ~0.66 keV with an equivalent width EW = 39 eV. However, these authors estimated that the significance of these lines was too small to claim a detection.
The equivalent widths of some of the lines reported in the literature for other GRBs are plotted in Fig. 3 for comparison with our upper limits. We only considered the bursts for which lines were claimed with statistical significance greater than 2σ and the measured equivalent width in the rest-frame of the bursts are plotted in the figure. For GRB 970508 (Piro et al. 1999), GRB 970828 (Yoshida et al. 2001), GRB 991216 (Piro et al. 2000), GRB 000214 (Antonelli et al. 2000), and GRB 030227 (Mereghetti et al. 2003b), the reported lines were attributed to highly ionized iron, while lines from H- or He-like ions from lighter elements (Mg to Ca) were claimed in GRB 001025 (Watson et al. 2002), GRB 011211 (Reeves et al. 2003), GRB 020813 (Butler et al. 2003), and GRB 030227 (Watson et al. 2003). A possible line in GRB 010220 was attributed to Ni (Watson et al. 2002).
The equivalent widths reported for these lines are all well above our upper limits and would hence be largely visible in the afterglow spectrum of GRB 120711A. Our results hence indicate that similar lines are at least not common in the spectra of GRBs afterglows.
We also found evidence of a low-metallicity absorbing medium in the GRB host galaxy. This result supports the suggestion that the high absorption in X-ray afterglows might be mainly due to helium in the HII regions in which the GRBs were born (Watson et al. 2013).
The ACS does not provide spectral information; we adopted the average conversion factor derived by Viganò & Mereghetti (2009).
Acknowledgments
This research is based on data of XMM-Newton, an ESA science mission with instruments and contributions directly funded by ESA Member States and NASA. We thank N. Schartel and the staff at the XMM-Newton Science Operation Center for making this target of opportunity observation and A. Tiengo for advice on the data analysis. This work was partially suported by the ASI/INAF agreement I/033/10/0.
References
- Anders, E., & Grevesse, N. 1989, Geochim. Cosmochim. Acta, 53, 197 [Google Scholar]
- Antonelli, L. A., Piro, L., Vietri, M., et al. 2000, ApJ, 545, L39 [NASA ADS] [CrossRef] [Google Scholar]
- Beardmore, A. P., & Evans, P. A. 2012, GRB Coordinates Network, 13442, 1 [Google Scholar]
- Bozzo, E., Gotz, D., Mereghetti, S., et al. 2012, GRB Coordinates Network, 13435, 1 [Google Scholar]
- Butler, N. R., Marshall, H. L., Ricker, G. R., et al. 2003, ApJ, 597, 1010 [NASA ADS] [CrossRef] [Google Scholar]
- Butler, N., Ricker, G., Vanderspek, R., et al. 2005, ApJ, 627, L9 [NASA ADS] [CrossRef] [Google Scholar]
- Elliott, J., Klose, S., & Greiner, J. 2012, GRB Coordinates Network, 13438, 1 [Google Scholar]
- Goldstein, A., Burgess, J. M., Preece, R. D., et al. 2012, ApJS, 199, 19 [NASA ADS] [CrossRef] [Google Scholar]
- Golenetskii, S., Aptekar, R., Frederiks, D., et al. 2012, GRB Coordinates Network, 13446, 1 [Google Scholar]
- Gotz, D., Mereghetti, S., Bozzo, E., et al. 2012, GRB Coordinates Network, 13434, 1 [Google Scholar]
- Gruber, D., & Pelassa, V. 2012, GRB Coordinates Network, 13437, 1 [Google Scholar]
- Hanlon, L., Martin-Carrillo, A., Zhang, X.-L., & von Kienlin, A. 2012, GRB Coordinates Network, 13468, 1 [Google Scholar]
- Hurkett, C. P., Vaughan, S., Osborne, J. P., et al. 2008, ApJ, 679, 587 [NASA ADS] [CrossRef] [Google Scholar]
- Kalberla, P. M. W., Burton, W. B., Hartmann, D., et al. 2005, A&A, 440, 775 [NASA ADS] [CrossRef] [EDP Sciences] [Google Scholar]
- Lacluyze, A., Haislip, J., Ivarsen, K., et al. 2012a, GRB Coordinates Network, 13433, 1 [Google Scholar]
- Lacluyze, A., Haislip, J., Ivarsen, K., et al. 2012b, GRB Coordinates Network, 13430, 1 [Google Scholar]
- Meegan, C. A., Pendleton, G. N., Briggs, M. S., et al. 1996, ApJS, 106, 65 [NASA ADS] [CrossRef] [Google Scholar]
- Mereghetti, S., Götz, D., Borkowski, J., Walter, R., & Pedersen, H. 2003a, A&A, 411, L291 [NASA ADS] [CrossRef] [EDP Sciences] [Google Scholar]
- Mereghetti, S., Götz, D., Tiengo, A., et al. 2003b, ApJ, 590, L73 [NASA ADS] [CrossRef] [Google Scholar]
- Piro, L., Costa, E., Feroci, M., et al. 1999, ApJ, 514, L73 [NASA ADS] [CrossRef] [Google Scholar]
- Piro, L., Garmire, G., Garcia, M., et al. 2000, Science, 290, 955 [NASA ADS] [CrossRef] [PubMed] [Google Scholar]
- Protassov, R., van Dyk, D. A., Connors, A., Kashyap, V. L., & Siemiginowska, A. 2002, ApJ, 571, 545 [NASA ADS] [CrossRef] [Google Scholar]
- Reeves, J. N., Watson, D., Osborne, J. P., Pounds, K. A., & O’Brien, P. T. 2003, A&A, 403, 463 [NASA ADS] [CrossRef] [EDP Sciences] [Google Scholar]
- Rutledge, R. E., & Sako, M. 2003, MNRAS, 339, 600 [NASA ADS] [CrossRef] [Google Scholar]
- Sako, M., Harrison, F. A., & Rutledge, R. E. 2005, ApJ, 623, 973 [NASA ADS] [CrossRef] [Google Scholar]
- Strüder, L., Briel, U., & Dennerl, K., et al. 2001, A&A, 365, L18 [NASA ADS] [CrossRef] [EDP Sciences] [Google Scholar]
- Tanvir, N. R., Wiersema, K., Levan, A. J., et al. 2012, GRB Coordinates Network, 13441, 1 [Google Scholar]
- Ubertini, P., Lebrun, F., Di Cocco, G., et al. 2003, A&A, 411, L131 [NASA ADS] [CrossRef] [EDP Sciences] [Google Scholar]
- Vietri, M., Ghisellini, G., Lazzati, D., Fiore, F., & Stella, L. 2001, ApJ, 550, L43 [NASA ADS] [CrossRef] [Google Scholar]
- Viganò, D., & Mereghetti, S. 2009, PoS extremesky2009:049 [Google Scholar]
- von Kienlin, A., Beckmann, V., Rau, A., et al. 2003, A&A, 411, L299 [NASA ADS] [CrossRef] [EDP Sciences] [Google Scholar]
- Watson, D., Reeves, J. N., Osborne, J., et al. 2002, A&A, 393, L1 [NASA ADS] [CrossRef] [EDP Sciences] [Google Scholar]
- Watson, D., Reeves, J. N., Hjorth, J., Jakobsson, P., & Pedersen, K. 2003, ApJ, 595, L29 [NASA ADS] [CrossRef] [Google Scholar]
- Watson, D., Zafar, T., Andersen, A. C., et al. 2013, ApJ, 768, 23 [NASA ADS] [CrossRef] [Google Scholar]
- Yoshida, A., Namiki, M., Yonetoku, D., et al. 2001, ApJ, 557, L27 [NASA ADS] [CrossRef] [Google Scholar]
All Figures
|
Fig. 1 Light curve of GRB 120711A at E > 80 keV in bins of 0.5 s measured with the anti-coincidence system of the SPI instrument. |
| In the text | |
|
Fig. 2 Upper panel: spectrum of the X-ray afterglow of GRB 120711A convolved with a Gaussian as described in the text (black solid line). The best-fit model is shown by the green line. The dashed lines are the percentile curves obtained with the simulations for emission and absorption lines. They correspond to single-trial detection significance of 2, 3, and 4σ. Lower panel: same curves of the upper panel, normalised by dividing by the best-fit model. |
| In the text | |
|
Fig. 3 Upper limits on the equivalent width of emission lines in the afterglow of GRB 120711A in the case of narrow (ΔE = 0 eV, solid curve) or wide (ΔE = 200 eV, dotted curve) lines. The curves give the best fit (with a 4th-order logarithmic polynomial) to the values obtained from simulations. For comparison, the rest-frame equivalent widths reported for other GRBs are also plotted: ◯ GRB 970828, ▽ GRB 970508, + GRB 991216, ∗ GRB 000214, △ GRB 001025, squares GRB 010220, filled diamond GRB 011211, × GRB 020813, and ♢ GRB 030227. The energies corresponding to the transition n = 2 → 1 for some H-like ions are also indicated. |
| In the text | |
|
Fig. 4 Upper limits on the optical depth at line center of absorption lines in the afterglow of GRB 120711A in the case of narrow (ΔE = 0 eV, solid curve) or wide (ΔE = 200 eV, dotted curve) lines. The curves give the best fit (with a 4th-order logarithmic polynomial) to the values obtained from simulations. |
| In the text | |
Current usage metrics show cumulative count of Article Views (full-text article views including HTML views, PDF and ePub downloads, according to the available data) and Abstracts Views on Vision4Press platform.
Data correspond to usage on the plateform after 2015. The current usage metrics is available 48-96 hours after online publication and is updated daily on week days.
Initial download of the metrics may take a while.