Fig. 2
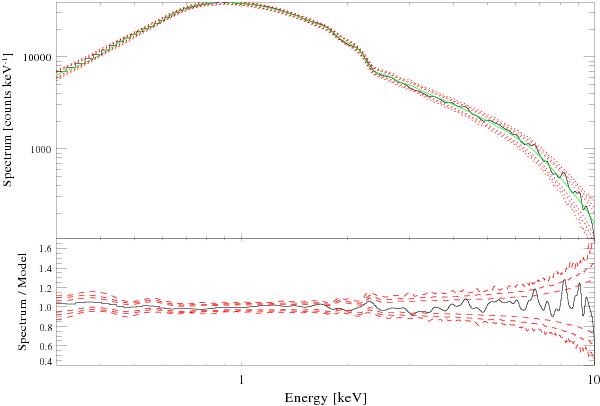
Upper panel: spectrum of the X-ray afterglow of GRB 120711A convolved with a Gaussian as described in the text (black solid line). The best-fit model is shown by the green line. The dashed lines are the percentile curves obtained with the simulations for emission and absorption lines. They correspond to single-trial detection significance of 2, 3, and 4σ. Lower panel: same curves of the upper panel, normalised by dividing by the best-fit model.
Current usage metrics show cumulative count of Article Views (full-text article views including HTML views, PDF and ePub downloads, according to the available data) and Abstracts Views on Vision4Press platform.
Data correspond to usage on the plateform after 2015. The current usage metrics is available 48-96 hours after online publication and is updated daily on week days.
Initial download of the metrics may take a while.