| Issue |
A&A
Volume 562, February 2014
|
|
|---|---|---|
| Article Number | A127 | |
| Number of page(s) | 26 | |
| Section | Catalogs and data | |
| DOI | https://doi.org/10.1051/0004-6361/201118270 | |
| Published online | 19 February 2014 | |
A library of near-infrared integral field spectra of young M–L dwarfs⋆,⋆⋆
1
Max-Planck-Institut für Astronomie
Königstuhl 17
69117
Heidelberg
Germany
e-mail: This email address is being protected from spambots. You need JavaScript enabled to view it.
2
UJF-Grenoble 1/CNRS-INSU, Institut de Planétologie et
d’Astrophysique de Grenoble (IPAG) UMR 5274, Grenoble
38041,
France
3
Departamento de Astronomia, Universidad de Chile,
36-D Casilla, Santiago, Chile
4
CRAL-ENS, 46 allée d’Italie, 69364
Lyon Cedex 7,
France
5
European Southern Observatory, Casilla 19001, 19
Santiago,
Chile
Received:
13
October
2011
Accepted:
13
June
2013
Abstract
Context. At young ages, low surface gravity affects the atmospheric properties of ultracool dwarfs. The impact on medium-resolution near-infrared (NIR) spectra has only been slightly investigated at the M–L transition so far.
Aims. We present a library of NIR (1.1–2.45 μm) medium-resolution (R ~ 1500–2000) integral field spectra of 15 young M6−L0 dwarfs. We aim at deriving updated NIR spectral type, luminosity, and physical parameters (Teff, log g, M, L/L⊙) for each source. This work also aims at testing the latest generation of BT-SETTL atmospheric models.
Methods. We estimated spectral types using spectral indices and the spectra of young objects classified in the optical. We used the 2010 and 2012 releases of the BT-SETTL synthetic spectral grid and cross-checked the results with the DRIFT-PHOENIX models to derive the atmospheric properties of the sources.
Results. We do not find significant differences between the spectra of young companions and those of young isolated brown dwarfs in the same spectral type range. We derive infrared spectral types L0 ± 1, L0 ± 1, M9.5 ± 0.5, M9.5 ± 0.5, M9.25 ± 0.25, M8+0.5-0.75, and M8.5 ± 0.5 for AB Pic b, Cha J110913-773444, USco CTIO 108B, GSC 08047-00232 B, DH Tau B, CT Cha b, and HR7329B, respectively. The BT-SETTL and DRIFT-PHOENIX models yield close Teff and log g estimates for each source. The models seem to show a 600+600-300 K drop in the effective temperature at the M–L transition. Assuming the former temperatures are correct, we then derive new mass estimates that confirm that DH Tau B, USco CTIO 108B, AB Pic b, KPNO Tau 4, OTS 44, and Cha1109 lie inside or at the boundary of the planetary mass range. We combine the empirical luminosities of the M9.5–L0 sources to the Teff to derive semi-empirical radii estimates that do not match “hot-start” evolutionary models predictions at 1–3 Myr. We use complementary data to demonstrate that atmospheric models are able to reproduce the combined optical and infrared spectral energy distribution, together with the NIR spectra of these sources simultaneously. But the models still fail to represent the dominant features in the optical. This issue raises doubts on the ability of these models to predict effective temperatures from NIR spectra alone.
Conclusions. The library provides templates for characterizing other young and late type objects. The study advocates the use of photometric and spectroscopic information over a broad range of wavelengths to study the properties of very low-mass young companions to be detected with the planet imagers (Subaru/SCExAO, LBT/LMIRCam, Gemini/GPI, VLT/SPHERE).
Key words: stars: low-mass / brown dwarfs / planetary systems / techniques: spectroscopic
Based on observations with ESO telescopes at the La Silla Paranal Observatory under programs 076.C-0379, 078.C-0510, 078.C-0800, 080.C-0590, 279.C-5010, and 083.C-0595 collected at the European Organization for Astronomical Research in the Southern Hemisphere, Chile.
The library of spectra can be downloaded at http://ipag.osug.fr/~gchauvin/addmaterial.html and is also available at the CDS via anonymous ftp to cdsarc.u-strasbg.fr (130.79.128.5) or via http://cdsarc.u-strasbg.fr/viz-bin/qcat?J/A+A/562/A127 .
© ESO, 2014
1. Introduction
Since the discovery of the first bound substellar objects GD 165 B (Becklin & Zuckerman 1988) and Gl 229 B (Nakajima et al. 1995), the development of large infrared surveys has led to an explosion of discoveries of very low-mass stars and mature brown dwarfs in the field. Many of these “ultra-cool dwarfs” failed to enter the MK spectroscopic classification scheme and required the creation of two new classes “L” (Kirkpatrick et al. 1999; Martín et al. 1999) and “T” (Geballe et al. 2002; Burgasser et al. 2002). In the NIR, spectra of late-M and L field dwarfs are dominated by a mix of atomic lines and molecular bands (Jones et al. 1994; Ali et al. 1995; Leggett et al. 1996, 2001; Reid et al. 2001). At low resolution, the variations in strengths of these features were followed to define a classification scheme coherent with what is found at optical wavelengths (Reid et al. 2001; Testi et al. 2001; Geballe et al. 2002). More recently, McLean et al. (2003, ML03) and Cushing et al. (2005, C05) have built medium-resolution (R ~ 2000) NIR libraries and quantified the variations of narrow features that can give additional constraints on spectral types. Models aiming at reproducing the emergent flux of ultracool atmospheres showed that these changes are best explained by a decrease in the effective temperature that leads in turn to the formation of a dusty cloud deck below ≲ 2700 K (Tsuji et al. 1996; Allard et al. 2001; Helling et al. 2008a).
Evolutionary models (Chabrier et al. 2000; Burrows et al. 2001) predict that substellar objects form
and contract with age and are hotter, larger, and more luminous at very young
(≲100 Myr) ages. As a
consequence, a population of young very low-mass objects that would be too faint to study
once they have aged were rapidly discovered in young clusters and in young nearby
(<100 pc) associations (see
the review of Torres et al. 2008) during deep
infrared surveys (e.g., Robberto et al. 2010),
observation campaigns with adaptive optics devices (e.g. Chauvin et al. 2003, 2010; Ireland et al. 2011) and with space observatories
(Hubble, Spitzer: e.g Lowrance et al. 1999, 2000, 2005; Luhman et al.
2007; Todorov et al. 2010). Among these
discoveries, planetary mass objects ( 13.6
MJup, see the definition of the
International Astronomical Union) were found to be free-floating (e.g. Oasa et al. 1999; Lucas & Roche
2000; Zapatero Osorio et al. 2000),
orbiting brown dwarfs (2MASSW J1207334-393254, USCO CTIO 108, 2MASS J04414489+2301513; Chauvin et al. 2004; Béjar et al. 2008; Todorov et al. 2010) or
as wide (>5 AU) companions to
stars (AB Pic, DH Tau, CHXR 73, GQ Lup, CT Cha, Fomalhaut, HR8799, β Pictoris, GSC 06214-00210,
1RXS J235133.3+312720, κ Andromedae; Chauvin
et al. 2005b; Itoh et al. 2005; Luhman et al. 2006; Neuhäuser et al. 2005; Schmidt et al.
2008; Kalas et al. 2008; Marois et al. 2008, 2010; Lagrange et al. 2010; Ireland et al. 2011; Bowler et al. 2012;
Carson et al. 2013), or even binaries (SR 12 AB,
2MASS J01033563-5515561 AB; Kuzuhara et al. 2011;
Delorme et al. 2013). This variety of
configurations offers precious benchmarks for planet and brown-dwarf formation models (e.g.
Boley 2009; Kratter
et al. 2010; Mordasini et al. 2012; Lambrechts & Johansen 2012; Bate 2012).
13.6
MJup, see the definition of the
International Astronomical Union) were found to be free-floating (e.g. Oasa et al. 1999; Lucas & Roche
2000; Zapatero Osorio et al. 2000),
orbiting brown dwarfs (2MASSW J1207334-393254, USCO CTIO 108, 2MASS J04414489+2301513; Chauvin et al. 2004; Béjar et al. 2008; Todorov et al. 2010) or
as wide (>5 AU) companions to
stars (AB Pic, DH Tau, CHXR 73, GQ Lup, CT Cha, Fomalhaut, HR8799, β Pictoris, GSC 06214-00210,
1RXS J235133.3+312720, κ Andromedae; Chauvin
et al. 2005b; Itoh et al. 2005; Luhman et al. 2006; Neuhäuser et al. 2005; Schmidt et al.
2008; Kalas et al. 2008; Marois et al. 2008, 2010; Lagrange et al. 2010; Ireland et al. 2011; Bowler et al. 2012;
Carson et al. 2013), or even binaries (SR 12 AB,
2MASS J01033563-5515561 AB; Kuzuhara et al. 2011;
Delorme et al. 2013). This variety of
configurations offers precious benchmarks for planet and brown-dwarf formation models (e.g.
Boley 2009; Kratter
et al. 2010; Mordasini et al. 2012; Lambrechts & Johansen 2012; Bate 2012).
Together with the temperature, the reduced surface gravity of these objects modifies the chemical and physical properties of their atmospheric layers. This translates into peculiar spectroscopic features that have been identified in the optical spectra of late-M dwarfs (Martin et al. 1996; Luhman et al. 1997, 2003a; Luhman & Rieke 1999; Gizis 2002) and early-L (L0–L5) dwarfs (Kirkpatrick et al. 2006; Cruz et al. 2009; Luhman et al. 2009). In the NIR, the most noticeable effects are the triangular shape of the H band (Lucas et al. 2001; McGovern et al. 2004; Kirkpatrick et al. 2006; Allers et al. 2007; Lodieu et al. 2008; Weights et al. 2009; Bonnefoy et al. 2010) and the reduced strength of alkali (Na I, K I) lines (Gorlova et al. 2003; McGovern et al. 2004; Kirkpatrick et al. 2006).
These differences can be used as a precious age proxy (Gorlova et al. 2003; Slesnick et al. 2004; Allers et al. 2007; Bihain et al. 2010) to find cluster candidates and/or to confirm their membership. However, using these changes to accurately access the intrinsic physical parameters of these objects is still limited by the lack of a classification scheme that accounts for surface gravity variations (Kirkpatrick 2005) and associated Teff/spectral type conversion scales for late-type objects. To break the temperature-age-surface gravity degeneracy, grids of synthetic spectra generated for a given set of atmospheric parameters can be compared to empirical spectra (Brott & Hauschildt 2005; Helling et al. 2008b; Fortney et al. 2008; Allard et al. 2013). However, recent studies (Leggett et al. 2001; Lucas et al. 2001; Bonnefoy et al. 2010; Rice et al. 2010) show that models must be used with care. Obtention of high-quality NIR spectral libraries of well-classified objects are then necessary to define anchor spectra for the classification and to constrain the models. Only recently has Lodieu et al. (2008) built a NIR spectral sequence of M8−L2 candidates Upper Sco members (~5 Myr) classified in the NIR. But Herczeg et al. (2009) found that several of the latest sources of their sample are M dwarfs in the optical.
In this paper, we present the results of an observational campaign to build a homogeneous library of NIR (1.1–2.5 μm) integral field spectra of 15 young M and early-L dwarfs at medium resolution (R ~ 1500–2000). In contrast with other studies, our spectra are less sensitive to chromatic slit losses that occur on AO-fed spectrographs with narrow entrance slits (Goto et al. 2002; Chauvin et al. 2005a). Our original source sample (see Table 1) is composed of 15 objects close to the planetary mass range, found isolated (Cha J110913-773444, hereafter Cha 1109; OTS 44; KPNO Tau 4) or as companions to star (AB Pic b, DH Tau B, GSC 08047-00232 B, hereafter GSC08047 B, TWA 5B, Gl 417B, USco CTIO 108B, and HR7329B). We observed in addition 2MASS J03454316+2540233 (2M0345), a member of the Ursa Major moving group (300 to 600 Myr Castellani et al. 2002; King et al. 2003; Bannister & Jameson 2007), to get the reference spectrum of a mature L0 dwarf. Apart from Gl 417 B (80–300 Myr; Kirkpatrick et al. 2000), our young objects are all members of young nearby associations (TW Hydrae, age ~ 8 Myr; Tucana-Horologium, age ~ 30 Myr; Colomba, age ~ 30 Myr; Carina, age ~ 30 Myr) and young clusters/star-forming regions (Chameleon I, age ~ 1–3 Myr; Taurus, age ~ 1 Myr; Upper-Sco, age = 5–11 Myr). We also reduced and re-analyzed spectra of the tight binary TWA 22AB (see Bonnefoy et al. 2009), of the young companion CT Cha b (Schmidt et al. 2008), of the young field dwarf 2MASS J01415823-4633574 (2M0141; Kirkpatrick et al. 2006), and 2MASSW J1207334-393254 A (2M1207 A; Gizis 2002). In Sect. 2, we describe the observations and the associated data reduction. We explain our spectral analysis and derive the physical parameters of each object in Sect. 3. Finally, in Sect. 4, we discuss our results and try to identify and quantify the different biases that could have affected the analysis.
Source properties taken from the literature.
2. Observations and data reduction
2.1. Observations
Targets were observed from October 19, 2006 to May 19, 2009 with the Spectrograph for INtegral Field Observations in the Near-Infrared (SINFONI, see Eisenhauer et al. 2003; Bonnet et al. 2004) mounted at the VLT/UT4. SINFONI provides adaptive-optics-assisted integral-field spectroscopy in the NIR. It is composed of a SPectrograph for Infrared Faint Field Imaging (SPIFFI) fed by a modified version of the Multi-Applications Curvature Adaptive Optics system (MACAO, see Bonnet et al. 2003).
We used the gratings J and H + K to cover the 1.1–1.4 and 1.45–2.45 μm ranges at a spectral resolution of ~2000 and ~1500, respectively (see Table 2). We observed AB Pic b, DH Tau B, GSC08047 B, and TWA 5B in AO-mode, together with the SPIFFI 25 × 12.5 pre-optics to resolve the companions. Primaries provided a reference for the wavefront sensing. They were kept outside the narrow field of view (FoV) of the instrument (0.8′′ × 0.8′′). Each sequence is composed of five to eight acquisitions on the source with small dithering and one acquisition on the sky. A similar strategy was followed for the observations of HR7329 B and USCO CTIO 108B but using the pre-optics to provide spatial pixels of 100 × 50 mas. The instrument was used with the 250 × 125 pre-optics in seeing-limited mode (NOAO) for the isolated targets (2M0141, KPNO Tau 4, 2M0345, Cha1109, OTS 44) and for Gl 417 B. Sequences were composed of 4 to 8 exposures each. Between exposures, small offsets were applied to dither the source over the 8 × 8′′ field of view. Finally, we also observed B and G type stars following a AB pattern right after our science targets to correct our spectra from telluric features.
2.2. Data reduction
We reduced our dataset homogeneously with the ESO data reduction pipeline version 1.9.8 (Abuter et al. 2006). We used in addition custom scripts to suppress several electronic effects (odd even effect affecting slitlet N°25, negative rows) affecting our raw images. The pipeline successfully carried out bad pixel detection, flat fielding, distortion coefficient computation, and wavelength calibration using calibration frames acquired the day following the observations. In NOAO-mode, a synthetic sky frame was built from the median of the input object frames. Individual datacubes were reconstructed from sky-subtracted object frames and merged into a final mozaicked datacube. Datacubes of telluric standard stars (STD) were obtained in a similar way. We noticed that raw science frames with integration time greater than 100s were affected by a fluctuation of the mean flux count level (up to 15% of the maximum flux level of the source) of the SPIFFI detector. This fluctuation also appears in the dark frames taken during daytime. It cannot be removed by the mean of sky or dark subtraction and is amplified when the pipeline corrects the on-off (or sky-object) frames by the detector gain. This effect can severely bias the spectral slope of the spectra, hence the atmospheric parameter estimates of the objects. We then carefully removed this fluctuation in the raw frames by computing the median flux level in six unilluminated columns on the left of the chip before applying any pipeline recipes. The quality of the results was monitored by eye and use of the ESO quality control parameters1. Residual sky-variations were estimated and subtracted across the FoV in the datacubes of GSC08047 B, AB Pic b, and 2M0141. Finally, we corrected all the datacubes obtained in AO-mode from the wavelength-dependent shift of the sources in the FoV induced by the atmospheric refraction.
2.3. Spectral extraction
The J band datacubes of TWA 5B, CT Cha b, and HR7329 B are contaminated by speckles rapidly crossing the FoV overlaid on a smooth flux gradient arising from their host stars. A similar pattern is present in the H + K band datacubes of these sources and in those of DH Tau B and GSC08047B. We then developed and applied a custom spectral extraction algorithm to evaluate the impact of these contributions to the final spectra. This algorithm is close to the one used by Barman et al. (2011) to decontaminate the datacubes of HR8799b. We built and subtracted a model of the companion flux distribution at each wavelength using the telluric standard-star datacube as an input point spread function. The residual datacube was then smoothed using median filtering in the spatial plane to create a model of the smooth gradient (or halo). The model was subtracted from the original datacube. This step was repeated until reaching a suitable fit. We finally applied a modified version of the spectral deconvolution algorithm (Sparks & Ford 2002; Thatte et al. 2007) on the datacubes of DH Tau B, GSC08047B, CT Cha b, and TWA 5B to suppress all the remaining low-frequency chromatic features. The algorithm produces final datacubes cleaned from most of the contamination and shows that the contribution of the speckles to DH Tau B, GSC08047B, and TWA 5B’s final spectra is negligible. We applied the procedure to the J and H + K band datacubes of HR7329 B but noticed a residual flux level likely to be the diffraction spikes of the primary star. Some residual contamination could remain in the spectrum of this object.
We also re-extracted the J and H + K band spectra from the datacubes of the tight binary TWA 22AB obtained by Bonnefoy et al. (2009) on February 2, 2007 using an upgraded version of the CLEAN-based algorithm presented in the aforementioned paper, and recently applied to the datacubes of the Z CMa system (Bonnefoy et al. 2013). The new algorithm now conserves the spatial information during the extraction and reduces differential flux losses that limited the spectral analysis so far. The algorithm converges in less than two iterations. The extraction error is estimated to be less than 5%.
Finally, we integrated the source flux in each final datacube over apertures selected to optimize the signal-to-noise ratio (S/N) without introducing differential flux losses. Some of our spectra were suffering from strong sky-line residuals that were flagged using the spectral atlas of Rousselot et al. (2000) and removed. Spectra of B-type standards star were corrected from their intrinsic features and divided by black bodies at the appropriate temperature (Theodossiou & Danezis 1991). G-type standard star spectra were divided by reference spectra (smoothed at R = 1500 in the H + K band) of G-type stars from the IRTF spectral library2 (Rayner et al. 2009, hereafter R09). The science spectra were then divided by standard star spectra, normalized to the continuum, and averaged to get master spectra. Finally, we connected the J and H + K band spectra of the targets with accurate NIR magnitudes (i.e. 2M0141, 2M0345, 2M1207 A, Cha1109, KPNO Tau 4, OTS44, DH Tau B, USco CTIO 108B, and Gl417B) using appropriate filter pass bands and a model spectrum of Vega (Mountain et al. 1985; Hayes 1985). The 1.1–2.5 μm spectra of 2M0141 and 2M1207 A closely match the low-resolution (R ~ 75–120) JHK band spectra of the SpecXPrism library3, thus validating the scaling procedure. Finally, the good agreement between the pseudo-continuums of the J + H and K band low-resolution (R ~ 300–440) spectra4 of DH Tau B gathered by Itoh et al. (2005) and of the SINFONI spectrum enable to check that the spectral extraction have not altered the spectral slope.
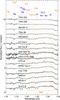 |
Fig. 1 J band spectra (1.1–1.35 μm) of the young M6–L4.5 objects observed with SINFONI. Molecular absorptions are indicated in green and atomic features in blue. |
3. Results
3.1. Empirical analysis
3.1.1. Line identification
The SINFONI spectra of young dwarfs are presented in Figs. 1–3. Apart for GSC08047B, all the spectra have a high enough S/N (30 to 150 from 1.20 to 1.32 μm; 30 to 80 from 1.50 to 1.60 μm) to allow studying weak atomic and molecular features and their subtle variations with the object age and spectral type.
The J band spectra are dominated by two broad molecular absorptions of H2O shortward of 1.17 μm and longward of 1.33 μm (Auman 1967), and by FeH at 1.194 μm and 1.239 μm (Phillips et al. 1987). We have also retrieved several narrow absorptions of FeH in the spectra of TWA 22 AB, TWA 5B, KPNO Tau 4, OTS 44, 2M0141, USco CTIO 108B, CT Cha b, HR7329 B, AB Pic b, and Gl 417 B that were previously identified in the spectra of field M–L dwarfs (Cushing et al. 2003).
The doublets of Na I and K I at 1.138 μm, 1.169 μm, 1.177 μm, 1.243 μm, and 1.253 μm represent the overwhelming atomic features in the J band. The spectra of TWA22 A & B also contain Mg I (1.183 μm), Fe I (1.159, 1.161, 1.164, 1.169, 1.178, 1.189, 1.197 μm), Na I (1.268 μm), Mn I (1.290 μm), and Al I (1.3127 and 1.3154 μm doublet) lines. Al I absorptions are still present in the spectra of 2M1207 A, HR7329 B, CT Cha b, and TWA 5B. They are not found in field dwarf spectra of L dwarfs (see Fig. 1 of ML03) and tend to increase with age in the spectra of M6 dwarfs (e.g. Fig. 3 of Rice et al. 2010). These lines already suggest that these objects are M dwarfs, in agreement with their optical spectral types (see Table 1).
Observing log.
continued.
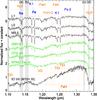 |
Fig. 4 Comparison of the J band SINFONI spectra (red) of 2M0141 (L0), OTS44 (M9.5), and KPNO Tau 4 (M9.5) to R ~ 2000 templates (black) of M9.5–L1 field dwarfs (BRI B0021-0214, C05; 2M0345, ML03; 2MASS J14392836+1929149, C05) classified in the optical, and to the spectrum of a very late type giant (IO Virginis, R09). The flux ratio inside the gray zones (a) and (b) defines the Na index defined by A07 and used in part 3.1.2. The flux ratio of gray zones (c) and (d) defined by G03 measures the depth of the water band longward of 1.3 μm. It can be used to classify young M dwarfs but appears slightly age-dependent at the M–L transition. |
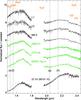 |
Fig. 5 Same as Fig. 4 for the H and K bands. Flux ratio of the (e) and (f) zones, and of the (g) and (h) zones define the spectral indices H2O–1.5 μm and H2O 2 used in Fig. 10. They vary only slightly with age from 1 Myr and can be used to confirm the spectral type of our targets. |
The J band spectra of the M9.5 dwarfs OTS 44, KPNO Tau 4, and of the L0 dwarf 2M0141 look like those obtained by Luhman et al. (2004), McGovern et al. (2004), and K06. They are compared in Fig. 4 to spectra of M9.5–L1 field dwarfs and to the spectrum of a late M giant (IO Virginis, McGovern et al. 2004). The three young dwarfs show features midway between those of the giant and of the dwarfs. KPNO Tau 4 (Taurus, ~1 Myr) displays a marked absorption of TiO at 1.103 μm (0–0 band of Φ (b1Π–d1Σ)), found in the spectra of the giant (R09) and diminished in the spectrum of the ~3 Myr OTS 44 and of 2M0141 (likely to be ~30 Myr old, see the discussion in Fig. 2 of Luhman et al. 2009). The FeH bands at 1.194 μm, 1.222 μm, and 1.239 μm, strong in the spectra of field dwarfs, decrease slightly from 1 Myr to 3 Myr, and are absent in the spectrum of IO Virginis. K06 invoked the broad depression of VO, from 1.17 to 1.20 μm in the giant spectrum, to explain the blue slope that surrounds the K I doublet seen in our young objects spectra.
The K I lines at 1.169, 1.177, and 1.253 μm are significantly stronger in the spectrum of 2M0141 (equivalent widths (EWs) variation greater than 8, 14, and 5σ respectively) than in those of KPNO Tau 4 (and also of OTS 44). The lines at 1.169 μm and 1.253 μm are the most sensitive to age because they appear weaker in the spectrum of the 1 Myr dwarf than at 3 Myr (see also Table 3). Na I (1.138 μm) and K I (1.169/1.177 μm and 1.243/1.253 μm) doublets are weaker in the spectra of these objects than in the spectra of field dwarfs analogues (EWs difference greater than 5σ). Finally, the very red slope of the young object spectra have been interpreted by K06 as a lowering of the collision-induced absorption (CIA) of H2 which usually cover the JHK band (see the left panels of Fig. 5 of Borysow et al. 1997). The J band spectra of Cha1109, USco CTIo 108 B, and AB Pic B have similar features, consistent with being a young object later than or equal to M9.5 dwarfs. Finally, the DH Tau B spectrum has a bluer continuum, weaker H2O and alkali lines than KPNO Tau 4 and OTS44. These differences could be interpreted by an increase in the effective temperature. This put an upper limit of M9.5 on the spectral types of this companion.
Our H + K band spectra exhibit several features characteristic of young objects. The prominent one is the triangular shape of the H band (e.g. Lucas et al. 2001, K06). The FeH absorptions at 1.583–1.591, 1.625 μm (Wallace & Hinkle 2001), and over the 1.588–1.751 range (Cushing et al. 2003) that are clearly seen in the spectra of old field M–L dwarfs are absent here. The water absorptions from 1.48 to 1.51 μm that deeply carve the band appear stronger in the spectra of the young objects classified in the optical when compared to field dwarfs counterparts. The K I line at 1.517 μm, the Ca I absorptions around 1.98 μm, and the Na I doublet at 2.206 and 2.209 μm are the strongest atomic lines in the H + K band spectra of M5–L1 field dwarfs (C05, ML03). Their non-detection in our spectra (apart for TWA 22) suggests that our objects are either later than ~M5 or young.
We analyzed the spectral features of OTS 44, KPNO Tau 4, and 2M0141 in their H and K bands following the same method as for the J band (Fig. 5). We note the progressive reddening of the band, the strengthening of the absorption from 1.3 to 1.6 μm, and the reduction of the negative slope from 2.2 to 2.3 μm, which can all be attributed to cooler line-forming regions and the reduced CIA of H2 (Borysow et al. 1997; Allard et al. 2001, K06). The depth of the water bands from 1.70 to 1.80 μm, and from 1.95 to 2.15 μm is identical in the spectra of young objects (see Fig. 5). These peculiar features are also present in the spectra of Cha 1109, USco CTIO 108B, and AB Pic b, and they confirm their late-type nature, as well as their young age.
To conclude, the spectra of OTS44 and CT Cha b have a noticeable Paschen β emission line. A similar – but weaker – line might also be present in the spectra of 2M1207A and DH Tau B. This line has already been observed in the spectra of GQ Lup b5 (Seifahrt et al. 2007) and GSC 06214-00210 b (Bowler et al. 2011). We study the characteristics and possible origin of this line for OTS 44 in a separate paper (Joergens et al. 2013).
3.1.2. Comparison to spectral templates
Spectral types inferred from comparing our spectra to those of field dwarfs would be systematically too late because of the strengthening of water absorptions and the effect of reduced CIA at young ages (Luhman & Rieke 1999; Luhman et al. 2004). To get accurate spectral types, we then attempted to classify our targets following the approach of Luhman et al. (2004) and based on the comparison to young dwarfs spectra classified at optical wavelengths.
The spectra of DH Tau B and CT Cha b were compared to low-resolution (R ~ 100) templates of young (1–3 Myr), optically classified M5–M9 members of the Taurus and IC348 (Muench et al. 2007) dereddened by their extinction values (Luhman 1999, 2004; Briceño et al. 2002; Guieu et al. 2007). We used in addition medium-resolution (R ~ 2000) spectra of M5−M7 Taurus and ρ Ophiucus objects (Allers et al. 2009; Rice et al. 2010) and low-resolution (R ~ 300–350) J band spectra of 1–3 Myr old objects obtained by Gorlova et al. (2003). Finally, we also used spectra of OTS 44, Cha1109, and KPNO Tau 4 as templates for M9.5 dwarfs. We assume AV = 0 for KPNO Tau 4 and OTS 44 (Briceño et al. 2002; Luhman 2007), and AV = 1.1 for Cha1109 (Luhman et al. 2005a) for the following analysis of the spectra.
We used templates of older objects for the targets AB Pic b, USco CTIO 108B, HR 7329 B, and GSC8047B. We then selected a sample of optically classified spectra from the ~5–11 Myr old (Pecaut et al. 2012) Upper Scorpius (Gorlova et al. 2003; Slesnick et al. 2004; Lodieu et al. 2008; Allers et al. 2009), and the ~8 Myr old TW Hydrae association (Allers et al. 2009; Rice et al. 2010). We used in addition the SINFONI spectra of TWA 5B and 2M1207 A as templates of M8.5–M9 and M8.25 dwarfs respectively.
Finally we used the SINFONI spectrum of the young L0 dwarf 2M0141 (Kirkpatrick et al. 2006) and a SpecX (Rayner et al. 2003) spectrum of the moderately young (20−300 Myr, see Zapatero Osorio et al. 2010) L3 dwarf G196-3 B (McGovern et al. 2004; Cruz et al. 2009) for all our targets. Although these sources could have reduced water absorption bands compared to younger counterparts, they can be used to place upper limits on the spectral types of our objects.
At low resolving powers, the JHK band of DH Tau B is best-fit by M8.5–M9.25 dwarfs with AV ≲ 2. The comparison with J band spectra at R ~ 300 clearly has features halfway between those found in M8.5 and M9.5 spectra. Finally, we noticed that the K I doublets and FeH absorptions are deeper than in the medium-resolution spectrum of the M9 Upper Sco member DENIS161103-242642. These features are known to increase at higher ages. Their strength anticorrelates with the spectral types in M–L field dwarfs spectra. This, along with the red slope, suggests that the companion is later than M9. We then adopted a spectral type M9.25 ± 0.25 for DH Tau B. Using the typical colors of young objects given in Table 13 of Luhman et al. (2010) and the conversion formulae between E(J − Ks) and AV of Schlegel et al. (1998), we find AV = 1.16 ± 1.05 mag. This value is in good agreement within the error bars with the extinction found for the primary star (AV = 0–1.5 mag, see Strom et al. 1989; White & Ghez 2001; Itoh et al. 2005) and used by Luhman et al. (2006) to derive new estimates for the companion mass. We then dereddened our spectrum by this amount for the analysis presented in the next sections.
The NIR spectral slope of CT Cha b is roughly compatible with that of M7.25–M8.5 Taurus
dwarfs and AV ≤ 3.25 mag. The
J band
dereddened by AV ≤ 1 is well fit
by R ~ 300 spectra of M8 dwarfs members of IC 348
(IC 348–363, IC 348–355; see G03). However, the H + K
band seems compatible with AV = 5.2 ± 0.8 as
found by C08. We then preliminary adopt M8 dwarfs and confirm that the NIR spectral
slopes are affected by circum(sub)stellar material.
dwarfs and confirm that the NIR spectral
slopes are affected by circum(sub)stellar material.
As noted by B10, the J and H + K band spectra of AB Pic b are clones of 2M0141. The strength of the 1.3 μm water absorption is comparable to that of field L1 dwarfs and remains lower than that of G196-3 B. This then put an upper limit of L1 on the spectral type of this companion. The spectrum also appears later than an M9 dwarf of Upper Sco. AB Pic b is then confirmed to be a L0 ± 1 dwarf. Since the spectra do not show heavy reddening, we assume in addition AV = 0.27 ± 0.02 mag of the primary star (van Belle & von Braun 2009).
The J band spectra of GSC08047 B and USco CTIO 108B have close shapes (Fig. 6). They fall halfway between the spectrum of 2M0141 and that of an M9 Upper Sco dwarf. We also find a correct match of the GSC08047 B spectrum with that of an L2 field dwarf (2MASS J00154476+3516026, see Kirkpatrick et al. 2000) from the NIRSPEC brown dwarf library6 (see Fig. 6). The H + K band spectra fit perfectly the one of 2M0141. The H band spectrum of GSC08047B is also reproduced well by that of the L2 dwarf (see Fig. 7). Nevertheless, the K band continuum ≥2.15 μm of 2M0141 gives a much better fit than does the L2 field dwarf for this companion. Since the evolution of this feature is closely related to the surface gravity (Allard et al. 2001), we conclude that GSC08047 B is more likely a young M9.5 ± 0.5 dwarf. Our conclusion is consistent with the membership of GSC08047 A to the 30 Myr old Colomba association (Torres et al. 2008). We assigned a similar spectral class to USco CTIO 108B from this comparison. This classification is consistent with the one derived at optical wavelengths (Béjar et al. 2008).
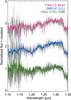 |
Fig. 6 J band spectrum of the companion to GSC 08047-00232 (gray) compared to the spectrum of the young L0 dwarf 2MASS J01415823-4633574 (Kirkpatrick et al. 2006), of the old field L2 dwarf 2MASS J0015448+351603 (Kirkpatrick et al. 2000), and of the young M9.5 companion USco CTIO 108B (Béjar et al. 2008). |
The new J band spectra of TWA 22A & B have water absorptions and spectral slopes similar to those of M5–M7 templates of young and old field dwarfs at R ~ 2000 (see Fig. 8). Strengths of FeH features are midway between those of field dwarfs and young (5–8 Myr) M5−M6 dwarfs spectra. The alkali lines are weaker than those of M6−M7 field dwarfs. They are only slightly weakened compared to a field M5. The water band longward of 1.3 μm and the 1.2 μm FeH absorptions are slightly deeper in the spectrum of TWA 22B. The H + K band spectrum matches those of young objects better (Fig. 9). The H band spectra are more peaky than in the spectrum of the M5.5 ± 1 dwarf (Close et al. 2007) AB Dor C (30–150 Myr; Close et al. 2005; Nielsen et al. 2005; Luhman et al. 2005c; Boccaletti et al. 2008). The age-sensitive K I absorptions at 1.517 μm, the Ca I lines around 1.98 μm, and the Na I doublet at 2.206–2.209 μm lies between those of young and old M6–M7 dwarfs but are similar to those of a field M5. The K band of TWA 22 B is a bit redder than the one of TWA 22 A. This led us to revise the classification to M5 ± 1 for TWA 22A and M5.5 ± 1 for TWA 22B. We conclude that all features can be explained if the binary components are older than 5 Myr but have not reached their final contraction radius yet. This agrees with results of Malo et al. (2013), which confirm that TWA 22 is a high probability member (99% probability) of the β Pictoris moving group. This is also consistent with the conclusions of Weinberger et al. (2013), which further rules out the membership to TW Hydrae originally proposed by Song et al. (2003) based on new parallax measurements for members of this association.
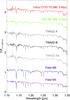 |
Fig. 8 J band spectra of TWA 22A and B, and TWA 22AB compared to young SpecX spectra of young M5−M6 (Allers et al. 2010) and old field M5–M6 dwarfs (Cushing et al. 2005). |
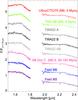 |
Fig. 9 Same as Fig. 8 but for the H + K band. We also add here the spectrum of the M5.5 dwarf AB Dor C Close et al. (2007), which is currently estimated to be 50–150 Myr old (Close et al. 2005; Nielsen et al. 2005; Luhman et al. 2005c; Boccaletti et al. 2008). |
Spectral indices and equivalent widths.
The spectrum of Gl 417 B does not show the triangular H band profile observed in the spectra of the low-gravity L dwarfs G196–3 B and 2MASS 0501–0010 (L4γ, Cruz et al. 2009; Allers et al. 2010). In contrast, it is reproduced well by the spectra of 2MASS J15065441+1321060 (L3, Gizis et al. 2000) and GD 165 B (L4, Kirkpatrick et al. 1999). This is in good agreement with the high surface gravities found from spectral modeling (Testi 2009).
To conclude, we also compared the spectra of 2M1207 A, TWA 5B, OTS 44, KPNO Tau 4, and 2M0141 to templates using the same criteria. We find spectral types that agree (at the 1σ level) with those derived in the optical (see Col. 2 of Table 4). We assigned a spectral type L0 ± 1 for Cha1109 given the good overall fit to 2M0141 and the K I lines at 1.169 and 1.253 μm that appear deeper than in the spectrum of OTS 44.
3.1.3. Indices and equivalent widths
We tested the age dependency of several spectral indices defined in the literature on the set of young optically classified dwarfs used in the previous section and on field dwarf spectra of C05 degraded at R = 300. We finally selected three indices that show a moderate scatter even for very young (1–3 Myr) objects (Fig. 10).
The first two indices, H2O1.33μm and H2O2, defined by Gorlova et al. (2003) and Slesnick
et al. (2004), measure the strengthening of water absorptions at 1.32 and 2.04
μm. The
zones used to compute the indices are indicated in Figs. 4 and 5. Even though these lines deepen
with age, the indices follow linear trends at the M–L transition and can be used to
constrain the spectral type of our objects within two subclasses (see Fig. 10): ![Mathematical equation: \begin{eqnarray} {\it Sp}.\:type &=& -30.63\:(\pm 1.51) \times [{\rm H_{2}O}_{1.33~\mu {\rm m}}] +31.19\:(\pm 1.13) \quad\quad\\ {\it Sp}.\:type &=& -21.50\:(\pm 2.15) \times [{\rm H_{2}O}\:2] +27.86\:(\pm 2.01). \end{eqnarray}](/articles/aa/full_html/2014/02/aa18270-11/aa18270-11-eq95.png) We also computed the H2O index (H2O1.5μm) defined
by (Allers et al. 2007, hereafter A07) slightly
modified (defined as ⟨ Fλ = 1.55−1.56 ⟩/⟨ Fλ = 1.512−1.522 ⟩)
to avoid noisy regions around 1.48 μm and found the following relation:
We also computed the H2O index (H2O1.5μm) defined
by (Allers et al. 2007, hereafter A07) slightly
modified (defined as ⟨ Fλ = 1.55−1.56 ⟩/⟨ Fλ = 1.512−1.522 ⟩)
to avoid noisy regions around 1.48 μm and found the following relation:
![Mathematical equation: \begin{equation} {\it Sp}.\:type = 36.28\:(\pm 2.70) \times [{\rm H_{2}O}_{1.5~\mu{\rm m}}] -30.58\:(\pm 2.91) \end{equation}](/articles/aa/full_html/2014/02/aa18270-11/aa18270-11-eq98.png) (3)where Sp. type values of
0, 10, and 15 correspond to spectral types M0, L0, and L5, respectively.
(3)where Sp. type values of
0, 10, and 15 correspond to spectral types M0, L0, and L5, respectively.
Index values and associated spectral types derived from SINFONI spectra and computed the same way are reported in Table 3. The mean spectral types derived from the indices values and the adopted ones are reported in Table 4. The indices are also derived for the late type dwarfs of L08 and reported in Fig. 10 considering the classification of L08, and the spectral classes we find using the method and the associated optically classified templates of Sect. 3.1.2 (see Appendix B).
We also studied the behavior of the Na I spectral index of A07 (⟨ Fλ = 1.150−1.160 ⟩/⟨ Fλ = 1.134−1.144 ⟩) in the lower right-hand panel of Fig. 10. Interestingly, AB Pic b and 2M0141 fall on the field dwarf sequence (blue dots) along with 2M0345 (~400 Myr, Bannister & Jameson 2007), while KPNO Tau 4 and OTS 44 have lower index values. It confirms that this index, jointly used with water band indices, is a valuable tool for identifying new 1–3 Myr cluster members.
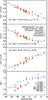 |
Fig. 10 Spectral indices used for the classification and age estimation computed on SINFONI spectra of dwarfs classified in the optical (orange triangles) and in the NIR (filled orange triangles), on medium-resolution spectra of young dwarfs classified in the optical (red filled squares; the references associated to the spectra are given in Sect. 3.1.2), and on field dwarfs spectra from the IRTF library (filled blue dots; Cushing et al. 2005; Rayner et al. 2009). We also overlaid the indices’ values for the young late dwarfs found and classified by Lodieu et al. (2008) (violet stars) and our proposed alternative classification using the method described in Sect. 3.1.2 (filled green inverted triangles; see Appendix B). |
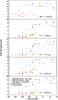 |
Fig. 11 Equivalent widths of gravity sensitive lines of Na I (1.138 μm) and K I (1.169 μm, 1.177 μm, 1.243 μm, 1.253 μm) computed on the SINFONI spectra and on reference spectra (see Fig. 10 for details). Spectra of objects not reported in this plot suffered from a S/N that is too low or from artefacts that prevented the EW from being computed. |
Finally, we used our spectra smoothed at R ~ 1700 to derive the EWs with associated errors of Na I and K I lines in the J band (see Appendix A for more details). As expected, the young objects have lower EW than in field dwarfs (Fig. 11). The EW computed for 2M0345 and Gl 417B and for field dwarfs analogues are similar. This means that the K I and Na I lines of L0 and L4.5 dwarfs can be used to set upper limits of ~600 and ~300 Myr on the age of the sources.
3.2. Comparison to synthetic spectra
3.2.1. The libraries
We compared our spectra to synthetic spectra corresponding to the 2010 and 2012 releases of the BT-SETTL models7 (Allard et al. 2011, 2012) for 1000 K ≤ Teff ≤ 4000 K, 3.5 dex ≤ log g ≤ 5.5 dex with 100 K and 0.5 dex increments respectively. Results were checked using the DRIFT-PHOENIX models (Woitke & Helling 2003, 2004; Helling & Woitke 2006; Helling et al. 2008b). The libraries and related grids of synthetic spectra are described in details in Bonnefoy et al. (2013). The DRIFT-PHOENIX models used the referenced solar abundances of Grevesse et al. (1993), the BT-SETTL10 use the ones of Asplund et al. (2009), while the BT-SETTL12 use the abundances of Caffau et al. (2011). We made the assumption that the objects have solar abundances. This is likely the case given the recent metallicity measurements in Chameleon I (James et al. 2006; Santos et al. 2008), Taurus (Santos et al. 2008), Ursa Major group (Ammler-von Eiff & Guenther 2009; Biazzo et al. 2012), and young associations (Viana Almeida et al. 2009; Biazzo et al. 2012; Barenfeld et al. 2013). We also analyzed the TWA 22 A and B spectra using the BT-SETTL grids and the GAIA-COND library (Brott & Hauschildt 2005).
Near-infrared spectral types.
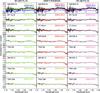 |
Fig. 12 Best matched synthetic spectra from the BT-SETTL10 (green line), the DRIFT-PHOENIX (red line), and the BT-SETTL12 (pink line) libraries to J band spectra of the SINFONI spectral library (black line). The spectrum of DH Tau B was dereddened by AV = 1.16 mag. The corresponding atmospheric parameters are reported in each panel. 2900/4.5/0.0 corresponds to Teff = 2900 K, log g = 4.5 dex, and M/H = 0.0 dex. |
3.2.2. Fitting results
We applied the weighted least square method described in Mohanty et al. (2007) for each empirical deredenned spectrum to find the best matching synthetic spectrum over the J, H + K, and JHK bands. Fits were checked visually. The best Teff and log g values are reported in Table 5, and in Table 6 for TWA 22. The corresponding fits are plotted in Figs. 12–15. Below 2000 K, the least squares solution does not reflect the true best BT-SETTL10 fitting spectrum. This is due to lines found over the whole spectral interval of the fit that appear only in these models. These lines originate in forests of narrow molecular absorptions that usually make the pseudo-continuum (McLean et al. 2007; Rice et al. 2010) and that are not Niquist-sampled by the models. This issue disappears in 2012 of the BT-SETTL grid that benefits from finer wavelength sampling.
BT-SETTL10 and DRIFT-PHOENIX models show several major improvements over the previous generation of models (AMES-DUSTY00, BT-SETTL08), which we used for a preliminar analysis of the AB Pic b spectra (Bonnefoy et al. 2010). The slope of the pseudo-continuum in the J band is now self-consistently reproduced with the depth of the water absorption at 1.32 μm, the K I doublets at 1.169/1.177 μm and 1.243/ 1.253 μm. The triangular H band shape typical of young objects is also better matched with the K band water absorptions and the CO overtones longward of 2.3 μm. The temperatures inferred from the J and H + K band fit are not necessarily the same. But the differences do not exceed 200 K.
Moreover, the 1.1–2.5 μm spectra of Cha 1109, OTS 44, USCO CTIO 108B, GSC8047 B, and KPNO Tau 4 are reproduced very well by a single model. We found several alternative best-fitting solutions for the J and HK band spectra of AB Pic b, 2M0141, Gl 417 B, and 2M1207 A, and USCO CTIO 108B. But the corresponding spectra have too many blue slopes when considering the 1.1–2.5 μm (JHK) interval as a whole (for 2M0141), their H band shape is too sharp between 1.55 and 1.70 μm (for AB Pic b, 2M0141, Gl 417 B), or the depth of their gravity-sensitive features at J band (Na I, K I) do not match (for 2M1207A).
Atmospheric parameters derived from the fit of our empirical spectra by synthetic spectra of the BT-SETTL10, BT-SETTL12, and DRIFT-PHOENIX libraries in the J, H + K, and JHK bands.
Atmospheric parameters derived from the fit of the TWA 22A & B spectra by synthetic spectra of the GAIA-COND and BT-SETTL libraries in the J, H + K, and JHK bands.
The Teff = 1600–1900 K derived for AB Pic b now agrees with what is derived from the Lyon’s group evolutionary models and from the JHK color fit of Mohanty et al. (2007). The Teff estimates for TWA 5B and 2M1207 A are inbetween the values found by Rice et al. (2010) fitting medium and high-resolution J band spectra of these sources.
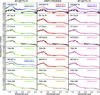 |
Fig. 13 Same as Fig. 12 but for the H + K band. Alternative fitting solutions are overlaid in blue and are shifted for clarity (+0.5 in normalized flux unit). |
The detailed structure and depth of the H2O band from 1.32 to 1.35 μm are reproduced better by the BT-SETTL models than by the DRIFT-PHOENIX models. These differences are related to the revised oxygen abundances (50%; Asplund et al. 2009; Caffau et al. 2011) and molecular broadening damping constants in the BT-SETTL models and to differences in the greenhouse effects predicted by the two different cloud model approaches. Finally, both models still lack FeH bands around 1.2 μm (Leggett et al. 2001; Rice et al. 2010). Missing FeH absorptions could also be – at least partially – responsible for the unreproducibility of the H band shape of mature objects such as 2M0345 and Gl 417 B. The atmospheric parameters derived for these later objects are then still uncertain. We compared our Teff estimates to those derived using spectral type/Teff relationships valid for young M and L0 dwarfs in Sect. 4.3.
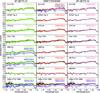 |
Fig. 14 Same as Fig. 12 but for cooler objects. The spectrum of Cha1109 was dereddened by AV = 1.1 mag. Alternative fitting solutions are overlaid in blue (shifted for clarity by −0.3 to −0.4 in normalized flux unit). |
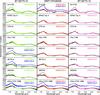 |
Fig. 15 Same as Fig. 13 but for cooler objects. Alternative fitting solutions are overlaid in blue and are shifted for clarity (+0.5 to +0.7 in normalized flux unit). |
GAIA and BT-SETTL10 models fit the spectra of TWA22 A and B for Teff compatible with their spectral types (Teff ~ 3120 and 3060 K for A and B, respectively, using the conversion scale of Luhman et al. 2003b). The mean surface gravity appears slightly higher than expected for 12 Myr objects. Both the pseudo-continuum and the individual features are well fit by the models, further confirming the spectral extraction.
3.3. Masses, luminosities, and radii
Together with the age, the atmospheric parameters derived in part 3.2.2 enable to estimate new masses and radii for each of our targets using evolutionary models predictions of Baraffe et al. (1998) and Chabrier et al. (2000). When the target age was unknown, we only relied on the atmospheric parameters. We note that these values do not depend on the predicted absolute fluxes for given passbands that rely on outdated atmospheric models (NEXTGEN, AMES-DUSTY00).
We considered here a conservative age range of 1–10 Myr for Taurus members given the age spread measurements of Kenyon & Hartmann (1995), Hartmann (2001), and Luhman et al. (2003a). We also chose an age range of 1–6 Myr for Chameleon I targets (Luhman 2007). We adopted an age of 3 to 11 Myr for USco CTIO 108 B (Mace et al. 2012; Pecaut et al. 2012). Finally, the age of 2M0345 is inferred from the age estimation of Ursa Major (Castellani et al. 2002; King et al. 2003, 300 to 600 Myr). The results are reported in Table 8.
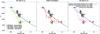 |
Fig. 16 Spectroscopic effective temperatures of field objects (squares) and young objects (dots) compared to those derived from Teff vs spectral type conversion scales valid for old field dwarfs (Stephens et al. 2009, black line) and young objects (dashed and/or dotted lines; Luhman et al. 2003b; Briceño et al. 2002; Luhman et al. 2004, 2008). The spectroscopic temperatures were found comparing the NIR spectra (IRTF, NIRSPEC, SINFONI) to synthetic spectra of the DRIFT-PHOENIX and BT-SETTL libraries (filled symbols), or fitting spectral energy distributions built from the typical colors of young objects (open circles; Luhman et al. 2010) or from the photometry of field dwarfs (open triangles; Patten et al. 2006). |
Following this method, OTS 44, KPNO Tau 4, and Cha 1109 have masses in the planetary-mass range; DH Tau B, 2M0141, USco CTIO 108 B, and AB Pic b have masses at the deuterium-burning mass limit; 2M1207A, TWA 5B, GSC8047B, HR7329 B, CT Cha b, and Gl 417 B are brown dwarfs; and TWA 22A and B have masses close to the substellar boundary. The age estimate derived for 2M0141 is still compatible with this source being a member of young nearby associations. This object lies at the deuterium-burning boundary in the case where it is a true 30 Myr old Tucana-Horologium member. The new masses of OTS 44 and KPNO Tau 4 are lower than previously estimated (~15 MJup) by Luhman et al. (2004) and Briceño et al. (2002), respectively. The mass of KPNO Tau 4 does however agree with 10 MJup reported in (Kraus et al. 2006). Masses of 2M1207 A, TWA 5B, DH Tau B, GSC8047 B, 2M0141, Cha1109, AB Pic b, and Gl 417 B agree with values found in past studies (reported in Table 1).
The predicted total mass of TWA 22 AB considering the spectroscopic temperatures of the components, their surface gravities, and their estimated luminosities now agrees within error bars with the dynamical mass of the system (Bonnefoy et al. 2009) considering a conservative age range of 8–34 Myr for the β Pictoris moving group (Fernández et al. 2008).
We derived the empirical luminosity of USco CTIO 108 B, AB Pic b, 2M0141, Cha1109, KPNO
Tau 4, and OTS 44 using their absolute flux and K band bolometric corrections, as recently
estimated by Todorov et al. (2010) for 2M0141 and
KPNO Tau 4, and assuming Mbol⊙ = 4.75 mag. We used
these luminosities and the spectroscopic Teff (Table 7) to derive semi-empirical radii estimates using the Stephan-Boltzmann
law ( ). The newly estimate radius of AB Pic b
agree with the evolutionary models predictions. In contrast, the semi-empirical radii of
1–3 Myr old objects appear to be 1.4 to 3 times larger than those inferred from the
models.
). The newly estimate radius of AB Pic b
agree with the evolutionary models predictions. In contrast, the semi-empirical radii of
1–3 Myr old objects appear to be 1.4 to 3 times larger than those inferred from the
models.
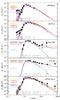 |
Fig. 17 Comparison of the SED (filled circles) of several young M9.5–L0 dwarfs with best-fit DRIFT-PHOENIX (red), BT-SETTL10 (green), and BT-SETTL12 (magenta) spectra. The SED of Cha1109 is de-reddened by AV = 1.1 mag. The typical photometry of M9.5 (for Cha1109, OTS 44, and KPNO Tau 4) and L0 dwarfs (for AB Pic b) is overlaid (triangles) along with the corresponding fitting solution found using the BT-SETTL10 grid (light blue). |
3.4. Conversion scales
The inconsistency on the radii can be explained as an underestimation of the spectroscopic temperatures compared to the predictions of evolutionary models for the observed luminosities. We compared the spectroscopic Teff derived from our sample of SINFONI spectra and from spectra of young M and L members of the Upper Scorpius star-forming region obtained by L08 to the Stephens et al. (2009) conversion scales and to additional scales built for young objects (Fig. 16). The atmospheric parameters associated to each object of L08 are reported in Appendix B. Luhman et al. (2003b) propose a temperature scale halfway between those of field dwarfs and of giant stars for young dwarfs with optical spectral types earlier than M9. The scale was built so that members of Taurus and IC348 fall parallel to the Baraffe et al. (1998) and Chabrier et al. (2000) isochrones in H-R diagrams at the cluster ages. Briceño et al. (2002) and Luhman et al. (2008) later extrapolated the previous scale for M9.5 (Teff = 2300 K) and L0 (Teff = 2200 K) subclasses using the temperature differences predicted for mature M9 and L0 dwarfs.
Adopted atmospheric parameters derived from the fit of our empirical spectra by synthetic spectra and compared to effective temperatures obtained from spectral types (see text).
Predicted temperature/spectral types for young objects earlier than M9 agree with Luhman’s scale (Table 8). Effective temperatures of Gl 417 B and 2M0345 are compatible with the ones predicted using the conversion scale of field dwarfs. However, the effective temperatures of KPNO Tau 4, OTS 44, 2M0141, Cha1109 (classified in the optical), and AB Pic b fall 300-500 K lower than predictions. The objects of L08 confirm the shift. M9.5 dwarfs like GSC8047 B and USCO CTIO 108 B and their younger counterparts OTS 44, KPNO Tau 4, and Cha1109 fall in two distinct temperature ranges. This suggests either a strong change in the effective temperature of young M9.5–L0 dwarfs with the age, or a failure of the atmosheric models to provide realistic effective temperatures. We investigate the latter hypothesis in the following section.
4. Discussion
4.1. Infrared excesses and extinctions
Excesses can affect semi-empical radii estimates reported in Sect. 3.3 because they tend to decrease the luminosity and can affect the JHK spectral slope that is also sensitive to Teff. Excesses and extinctions can be reasonably excluded for AB Pic b (and for 2M0141) given the proximity and the age of this companion. It is, however, a source of concern for the younger and more distant objects KPNO Tau 4, OTS 44, and Cha1109. Briceño et al. (2002) find AV = 0 for KPNO Tau 4 when comparing the optical spectrum of the source to those of unextincted field dwarfs analogs. Luhman et al. (2005b) later conclude that the source does not exhibit excess emission from circumstellar material based on the mid-infrared spectral energy distribution (SED) fitting and given that AV = 0. The analysis also relied on the good agreement between the mid-infrared photometry with that of a blackbody at the temperature of the source found extrapolating the Teff/spectral type conversion scales (Sect. 4.3). The lack of significant disk-contribution was also confirmed by Guieu et al. (2007) from a full-SED analysis but required a higher extinction (AV = 2.45). The extinction was also re-evaluated by Kraus et al. (2006) to AV = 4 based on the fit of the optical+NIR SED with redenned field dwarfs templates. Luhman et al. (2005b) later used the SED of KPNO Tau 4 considering AV = 0, together with a disk model to conclude that OTS 44 was affected by significant mid-IR excess only longward of 3 μm. Luhman et al. (2005a) made a similar analysis for Cha1109 and reached similar conclusions.
We compared the infrared SED of KPNO Tau 4 (see Fig. 17) to the typical SED of a young M9.5 source built taking the average of the typical empirical infrared colors of young M9 and L0 dwarfs reported in Table 13 of Luhman et al. (2010) and normalizing the J band flux to the one of the object. The object SEDs were built from the photometry found in the literature (mostly from HST, 2MASS, and Spitzer8) This comparison excludes reddenings corresponding to AV > 1.8 mag (using the reddening law of Draine 2003a,b,c, with R = 3.1) and confirms that the source does not have significant excess. The procedure was repeated for OTS 44 and Cha 1109. We found that the JHK band photometry of OTS 44 could be affected by a reddening corresponding to AV ~ 2.0 mag. Cha1109 NIR photometry is not affected by significant additional excess once an additional extinction of AV = 1 mag is considered. These conclusions are consistent with the SED classes reported in Luhman et al. (2008, 2010), which were found by computing infrared slope excesses and which rely on the same input standard photometry.
To conclude, we also compared the JHKL′ band photometry of AB Pic b to the standard colors of young L0 dwarfs. The photometry was converted to fluxes using a flux-calibrated spectrum of Vega (Mountain et al. 1985; Hayes 1985) and the NaCo filter passbands. We find that the SED is not reproduced by the typical flux unless it is normalized using the H band flux. AB Pic b looks ~0.5–1.0 mag fainter in the J band. Once calibrated in flux, the JHK band spectrum of the companion displays the same features as 2M0141, while the J band appears shifted to lower fluxes. The origin of the under-luminosity remains unclear. It could be due to a systematic error on the photometry (see Sect. 4.6), to variability (Sect. 4.4), to peculiar atmospheric properties, or to all three.
KPNO Tau 4 and OTS 44 are still fitted by synthetic spectra at Teff = 1800–1900
K and log g = 3.5 dex once the JHK spectra
have been corrected from an extinction of AV = 1.8 mag. The best
fitting solution for Cha1109 changes to Teff = 2200 K and log g = 3.5 dex if we deredden
the spectrum by AV = 1.1 + 1.8 mag.
This temperature agrees more closely with the one expected for a young L0 dwarf (see Sect.
4.3). We estimate log L/L⊙ = −2.40 for KPNO Tau
4, −3.15 for Cha1109, and
−2.82 for OTS 44 considering
the magnitudes corrections ratio of Schlegel et al.
(1998) and these extreme AV. These new
spectroscopic Teff and luminosities brings
semi-empirical radii estimates of Cha1109 to  ) in agreement with the predictions from
evolutionary models (
) in agreement with the predictions from
evolutionary models ( ). This is not the case for KPNO Tau 4 and
OTS 44 (
). This is not the case for KPNO Tau 4 and
OTS 44 ( and
and
 respectively).
We used the radiative transfer code MCFOST (Pinte et al. 2006) based on the Monte-Carlo method to model and fit SEDs of Cha1109 and OTS44 and to further investigate the impact of disk emission on the NIR spectra a posteriori. MCFOST considers disks as axisymmetric flared density structures with scale heights h(r) = h0(r/r0)β. Here, r is the radial coordinate in the equatorial plane, h0 the scale height of the disk at r0 = 100 AU, and β parametrizes the flaring. The disk models have a cylindrical geometry characterized by an inner-edge radius rin. The dust grain distribution follows a power law with a maximum grain size amax. We used two BT-SETTL10 spectra at Teff = 2300 K and log g = 3.5 and at Teff = 1800 K and log g = 3.5, as a guess for the photospheric emission for each of the object. The scaling factor of the synthetic spectra were left as free parameters in the fit. The parameters of the best-fitting models are reported in Table 9, and SED models are overlaid in Fig. 17. Following this approach, the radius of Cha1109 agrees with evolutionary models predictions, while that of OTS 44 still remains too large for the two choices of photospheres. We confirm that excesses do not bias the spectral analysis.
4.2. Classification of late-M and early-L dwarfs
The spectroscopic temperatures of our later type sources also encouraged us to question the validity of the absolute classification of M9.5–L0 dwarfs. The very late M-type Mira used to classify OTS 44, Cha 1109, and KPNO Tau 4 at optical wavelengths (Briceño et al. 2002; Luhman 2007; Luhman et al. 2008, and references therein) are very often variables. This is illustrated well in the NIR for the dust-enshrouded (Cohen & Kuhi 1976; Alvarez et al. 2000) M10+III star IO Virginis, whose optical spectrum was used to classify KPNO Tau 4 (Briceño et al. 2002). We compared the J and H + K band spectra of this star taken from Lançon & Mouhcine (2002), Rayner et al. (2009), and obtained reducing SINFONI data collected on January 25, 2008. The slope and the main spectral features (VO, TiO, H2O) are variable.
The method proposed by Cruz et al. (2009), to classify young L dwarfs, and based on the comparison to field dwarfs templates, is promising. We note, however, that our Teff estimation for 2M0141 (classified as L0γ) is the same as found for G 196-3B (L3β) by (Zapatero Osorio et al. 2010, found by adjusting a black body on the SED.).
4.3. Behavior of atmospheric models at the M–L transition
The spectroscopic temperatures strongly rely on the good representation of the NIR spectral slopes of the atmospheric models. While the NIR spectra of late-M and early-L dwarfs are extremely sensitive to the greenhouse effect related to the formation of clouds of silicates, the narrow spread of effective temperature estimates derived from the still very different cloud model approaches of the DRIFT-PHOENIX and BT-SETTL (2010 and 2012) models seems to show that the understanding of cloud physics converge and that this wavelength range is not very sensitive to differences in cloud modeling as soon as the main ingredients (mixing, condensation, sedimentation, and supersaturation) are accounted for. Nevertheless, DRIFT-PHOENIX models have recently been tested by Witte et al. (2011) on a set of low-resolution (R = 75–200) spectra of young and evolved M and L dwarfs over 0.5–2.5 μm. They fit a low resolution (R ~ 120) spectrum of 2M0141 and find effective temperatures and surface gravities in good agreement with our values. Their fit also pointed out an underprediction of the temperatures at the M–L transition with respect to the scale of Stephens et al. (2009) valid for field dwarfs and built from empirical luminosities and radii predicted by evolutionary models.
Masses and radii predicted by evolutionary models of Baraffe et al. (1998) and Chabrier et al. (2000) for the given age, Teff, and log g estimates of the SINFONI sources.
Parameters of the disk models used to represent the spectral energy distribution model of Cha1109 and OTS 44, and considering two different photospheres for the objects.
We decided to make additional tests to evaluate the robustness of the atmospheric models using complementary material found in the literature, the results presented above, and the three synthetic spectral libraries:
-
1.
We plotted the BT-SETTL10 and BT-SETTL12 spectra over the 1.1–2.5 μm range around Teff = 1600−2000 K and confirmed that the spectral slope vary rapidly with the temperature and the surface gravity between 1600 K and 2000 K. In this wavelength range, the computation of the mean fraction and the size distribution of grains inside the cloud require a large number of iterations. For some of the spectra, the models could have failed to converge (and then to predict the correct dust fraction and size distribution) and could then explain this rapid change. The conclusions derived by Witte et al. (2011) also certainly apply to the BT-SETTL model; e.g., the model underestimates the dust opacity for Teff above ~1900 K, resulting in spectral slopes that are too blue, and underestimated effective temperatures.
-
2.
We built the 0.55–3.8 μm SED of AB Pic b and HR7329 B for the first time from avalaible NIR photometry (Neuhäuser et al. 2011; this work) and archival Hubble data (see Appendix D). We compared these SED and that of KPNO Tau 4 to BT-SETTL and DRIFT-PHOENIX models. The fit enabled us to test the global reproducibility of atmospheric models. The procedure involved finding the scaling factor (R2/d2. R is the object radius and d the distance to the Earth) that made the synthetized photometry (expressed as surfacic flux) match the observed values best (found together with the best Teff and log g). Fitting solutions are shown in Fig. 17. Models successfully reproduce the Spitzer fluxes, the NIR photometry (2MASS), and the optical fluxes of KPNO Tau 4 for Teff = 1700–1800 K and log g = 3.5–4.5 dex. Synthetic SEDs at Teff = 2200–2300 K cannot simultaneously reproduce the Spitzer fluxes and the photometry shortward of 1.5 μm. The best-fit dilution factor at these Teff corresponds to unphysical radii (R < 1 RJup). The photometry of AB Pic b and HR7329 B are matched best for Teff = 1700–2000 K, and log g = 3.5–5.5, Teff = 2200–2500 K and log g = 4.0–5.0, respectively. We find corresponding radii of 7.11 ± 0.03 RJup for KPNO Tau 4, 1.65 ± 0.05 RJup for AB pic b, and 3.05 ± 0.03 RJup for HR7329 B. Temperatures are in good agreement with those reported in Table 5. These radii, of KPNO Tau 4 and AB Pic b, are however systematicaly higher than the mean values reported in Table 8. This can be interpreted as an overestimation of the scaling parameter (due possibly to a slight underestimation of the effective temperature) or of the empirical luminosity.
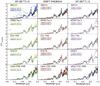
Fig. 18 Normalized optical spectra of 2M0141, KPNO Tau 4, Cha1109, OTS 44, and USCO CTIO 108B compared to the best-fitting BT-SETTL10 (green; left), DRIFT-PHOENIX (red; middle), and BT-SETTL12 (magenta; right) spectra found in the NIR. The spectrum of Cha1109 is de-redenned by AV = 1.1 mag. Synthetic spectra at the temperature predicted by conversion scales are overlaid in blue-green. We also show the alternative fitting solution found for 2M0141 using BT-SETTL10 spectra (blue).
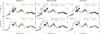
Fig. 19 0.6–2.5 μm spectra of 2M0141, and KPNO Tau 4 normalized over the considered wavelength range and compared to best-fit BT-SETTL10 (green line; shifted by +0.5 normalized flux unit) and DRIFT-PHOENIX (red; shifted by −0.5 normalized flux unit) spectra. A spectrum at Teff corresponding to predictions from conversion scales ang log g = 3.5 dex (gray-blue) is overlaid for comparison.
-
3.
We repeated the procedure on the 2MASS+Spitzer colors of typical young M5–L0 dwarfs reported in Luhman et al. (2010). The fits are visually of good quality but are less constrained for dwarfs earlier than M9. The corresponding temperatures are ploted in Fig. 16. We also find a drop in the effective temperature at the M–L transition, but for earlier spectral types with respect to the drop found from NIR spectra.
-
4.
We fit the normalized optical spectra (see Fig. 18) of 2M0141, Cha1109, OTS44, and KPNO Tau 4, USco CTIO 108B reported in Cruz et al. (2009), Luhman et al. (2008), and Béjar et al. (2008). We found effective temperatures of 1700–1900 K for 2M0141, 2300 K for Cha1109, 2400–2500 K for OTS44, 2200–2400 K for KPNO Tau 4, and 2000–2200 K for USco CTIO 108 B. The new temperatures found for the 1–3 Myr old object agree better with those inferred from the conversion scales. The visual inspection reveals that synthetic spectra at Teff = 2200 and 2400 K and 3.5 ≤ log g ≤ 5.5 provide a good representation of the optical spectra of the objets shortward of 0.8 μm, but fail to represent correctly the spectra from 0.8 to 1 μm (Fig. 18). We also fitted the 0.6–2.5 μm spectra of KPNO Tau 4 and 2M0141 with the three set of models (Fig. 19). Spectra were built scaling the JHK and the optical spectra to the low-resolution SpecXprism spectra of these sources (Kirkpatrick et al. 2006; Muench et al. 2007). The spectrum of 2M0141 is fitted at Teff = 1700–1800 K/log g = 4.5 by the three models. We find alternative solutions at Teff = 1900 K/log g = 3.5 and Teff = 2000 K/log g = 4.5 with BT-SETTL10. They are similar to those found by Kirkpatrick et al. (2006) with older DUSTY-type atmospheric models. But these solutions are not confirmed with DRIFT-PHOENIX. KPNO Tau 4 is well fit by DRIFT-PHONIX and BT-SETTL10 models at Teff = 1700–1800 K/log g = 3.5. BT-SETTL12 models give a poor fit to the spectrum of this source.
-
5.
We compared synthetic spectra to the SED (optical, when available + 2MASS JHK + Spitzer fluxes) of M7–L7 field dwarfs studied in Patten et al. (2006). Best fitting solutions were checked visually and were discarded, if needed. The temperatures of the best fit models are reported in Fig. 16. BT-SETTL spectra provide the best fits. DRIFT-PHOENIX fits the optical and the JHK fluxes well but tends to predict too many high fluxes longward of 3 μm. Both models give Teff estimates compatible with the Stephens et al. (2009) scale for dwarfs later than L2. The temperature of M7–L0 dwarfs fall ~300 K lower than the aforementioned scale. However, our fits are less constrained at these temperatures.
-
6.
We finally fitted the J, H, K, and JHK band spectra of several late-M and early-L dwarfs of the IRTF and NIRSPEC libraries of McLean et al. (2003) and Cushing et al. (2005). The BT-SETTL spectra reproduce the JHK pseudo-continuum slopes, together with the depth of the main (atomic and molecular) absorptions. The H band flux is, however, badly reproduced and lead to inconsistent temperatures if fitted alone (as for 2M0345). The DRIFT-PHOENIX and BT-SETTL12 models predict temperatures that are too low for M9.5–L1 dwarfs. The effective temperatures corresponding to the best-fit spectra do not exceed 200 K for the different models for a given object. Spectroscopic temperatures agree with Teff/spectral type conversion scales of field dwarfs if we decide to fit the K band spectrum alone. This issue in the modeling of the M–L transition of field-dwarfs with the BT-SETTL models will be discussed in a forthcoming paper (Allard et al. 2013, in prep.).
These tests demonstrate the ability of the three atmospheric models to predict effective temperatures from the NIR spectra of young objects consistent with those found when fitting the corresponding SEDs. Nevertheless, local nonreproductibilities in the optical shows that the atmosphere models and the related dust cloud models are not fully valid. Therefore, problems in the modeling of the dust might still affect the temperature predictions derived from fitting NIR spectra alone. For this reason, the analysis demonstrate that the companions that will be discovered by planet imager instruments (VLT/SPHERE, Gemini/GPI, Subaru/SCexAO, LBT/LMIRCam) should be characterized using complementary spectrophotometric observations to complete the wavelength coverage accessible from these instruments.
4.4. Binarity and variability
An overluminosity caused by unresolved binarity or possible variability could explain the inconsistency of evolutionary model predictions for the measured Teff and luminosities of Cha1109, OTS44, and KPNO Tau 4. The multiplicity level of the Taurus and Chameleon targets has not been constrained for the full separation/mass range, or is even unknown. Kraus et al. (2006) put constraints at large separations (≳20 AU) for KPNO Tau 4. As far as we know, the radial velocities of this source has not been monitored over a large temporal baseline to set additional limits at inner separations yet. No multiplicity studies have been conducted for the remaining Chameleon I targets. Then, future radial velocity and AO monitoring are needed.
Carpenter et al. (2002) do not find any significant photometric variability for OTS44. The comparison of the low-resolution spectra of KPNO Tau 4 (Levine et al. 2006; Muench et al. 2007, this work) do not reveal the variability of the spectral lines (once smoothed at a homogeneous spectral resolution of ~75). Howevever, the J band of the Levine et al. (2006) spectrum is shifted to higher fluxes compared to the spectrum of Muench et al. (2007). These two spectra were obtained in the J and H bands simulaneously. Therefore, photometric and/or spectroscopic monitoring is needed to understand whether this shift comes from true variability or rather from the instrument. Variability is also an issue for Cha1109.
4.5. Initial conditions
The “hot-start” evolutionary models of low-mass stars and brown dwarfs used in Sect. 3.3 are known to be affected by several sources of uncertainties at very young ages (Baraffe et al. 2002). Their predictions have only been marginally tested given the difficulties of providing independent measurements of the physical properties of the objets (radii, masses, atmospheric parameters, etc.) at a high level of accuracy (see the review of Mathieu et al. (2007) and Konopacky et al. 2007; Lommen et al. 2008; Bonnefoy et al. 2009). The increase of the deviation of semi-empirical radii with respect to model predictions with age supports the idea of a sensitivity of evolutionary tracks predictions to initial conditions.
2M1207 A, Cha1109, and OTS 44 are known to be surrounded by disks. KPNO Tau 4 has been reported as a possible accretor by Mohanty et al. (2005), although some accretion signatures could be photospheric in origin. Finally, Herczeg et al. (2009) estimated an accretion rates of −11.9 log M⊙ yr-1 for 2M1207 A and suggest that this brown dwarf could experience accretion variability.
The “hot-start” evolutionary models of Chabrier et al. (2000) suppose the object evolution starts from a hot, large, and non-adiabatic sphere. These models do not account for the accretion of disk materials and related effects on the initial energy budget of the object. Baraffe et al. (2009) investigated the effect of accretion on the evolution of brown dwarfs and low-mass stars and demonstrated that radii and luminosities depends on the accretion. The new “warm-start” evolutionary models (Spiegel & Burrows 2012; Marleau & Cumming 2014) are also starting to explore the influence of initial conditions (initial entropy) for planetary-mass objects. We used the “warm-start” models of Spiegel & Burrows (2012) on OTS44, AB Pic b, KPNO Tau 4, and Cha1109 in order to determine which range of initial entropies and masses can reproduce the spectroscopic temperatures and the luminosities of these objects. The radii and Teff for the object ages, masses of 1–15 MJup, and initial entropies ranging from 8 to 13 Boltzmann constant per baryon (kb/baryon) were kindly provided by the authors of the models and combined to derive luminosity predictions. The luminosity and temperature of KPNO Tau 4 fall outside of the bonds of the models. The spectroscopic temperature and luminosity of OTS 44 and Cha1109 cannot be reconciled for the given range of initial entropies and masses covered by the models. Therefore, this reinforces the hypothesis that a bias exists in the temperature or luminosity determination of these objects. The models give a lower limit on the mass of OTS44 and Cha1109 of 8 an 6 MJup using the observed luminosity as input. Conversely, the temperature and luminosity of AB Pic b and USCO CTIO 108B are simultaneously reproduced by the models. The models give a lower limit of 10 and 8.5 MJup on the masses of these two companions.
4.6. Comparison with previous studies
The work presented here extend the analysis made by Gorlova et al. (2003) to spectral types M9.5–L0 and enable the study in more detail of the gravity-indicator in the NIR spectra of young M9.5 and L0 dwarfs initiated by McGovern et al. (2004), Allers et al. (2007), and Kirkpatrick et al. (2006). Our sample does not show any difference between the spectra of young companions and isolated objects (taken from the library, or from the literature). In particular, the NIR spectra of AB Pic b (~30 Myr) and of the isolated 2M0141 are nearly identical in each individual band, and also possibly simultaneous over the 1.1–2.5 μm range (see below). 2M0141 represents the second young field L dwarfs identified in the field (Cruz et al. 2009) known to share similarities with a young planetary mass companion along with 2MASS J035523.37+113343.7 (Faherty et al. 2013).
Patience et al. (2012) have also recently analyzed the SINFONI spectra of DH Tau B, 2M1207A, 2M0141, AB Pic b, GSC0847 B, and TWA 5 B9. In comparison, we obtained the spectra of five more objects here and reduced all the SINFONI data presented in Bonnefoy et al. (2010), Patience et al. (2012), and Schmidt et al. (2008) using the latest data analysis tools in order to make an homogeneous analysis.
Patience et al. (2012) find a spread in effective temperatures from the fit of the J, HK, and JHK spectra of the objects with synthetic spectra of given atmospheric models, and also consider different models. We do not retrieve the spread in effective temperatures derived from the different bands using the same version of the BT-SETTL10 models. To our knowledge, the authors did not account for the fluctuations in the mean flux count level in science frames with long data integration times (see Sect. 2.2). The effective temperature estimates are tied to the conservation of the overall shape of the pseudo-continuum. This bias in the data analysis might then explain why the authors reach such conclusions.
Furthermore, we believe the JHK band spectra of AB Pic b, GSC0847 B, and TWA 5 B can not be built from the individual J and H + K band spectra of these sources because of the lack of accurate NIR photometry. Our new analysis of the NaCo J, H, and K band data of AB Pic b reported in Chauvin et al. (2005b) and used in Patience et al. (2012) lead to different NIR photometry (see Appendix C). We provide in addition a new photometry of AB Pic b from wide-field J and Ks archive data of the system in Appendix C. We find a 0.5 to 1 mag spread in these bands that cannot be explained by the different – but close – associated photometric systems. This spread does not lead to a revision of the mass estimate for the object and does not affect the fit of the SED significantly (Sect. 4.3. The corresponding NIR colors of AB Pic b (H − Ks = 0.64 mag from the H + K SINFONI spectrum) are more compatible with those of other early-L type companions (see Fig. 2 of Bonnefoy et al. 2013). This confirms the results found independently by (Biller et al. 2013) from NICI data. The JHK spectrum of the source built from the new SofI photometry matches perfectly the one of 2M0141. The spread in the photometry alone introduces an uncertainty of 300 K on the fit of the JHK band with the SETTL models. Similarly, the combination of avaliable photometry on GSC8047 B (see Appendix C) introduces an uncertainty of 200 K on the fit of the JHK band.
5. Conclusions
We have obtained high-quality 1.1–2.5 μm medium-resolution spectra of 15 young low-mass objects. We identified several features indicative of surface gravity that are intermediate between those of mature field dwarfs and late-type giants. Spectra were compared to empirical templates of young objects classified at optical wavelengths to re-assigned infrared spectral types in an homogeneous way. We selected and used three spectral indices that are slightly sensitive to age to confirm the classifications. We then estimate that DH Tau B is an M9.25 ± 0.25, GSC8047B is an M9.5 ± 0.5, and AB Pic b is an L0 ± 1.
We used three state-of-the art libraries of synthetic spectra BT-SETTL10, BT-SETTL12, and DRIFT-PHOENIX to derive atmospheric parameters estimates for each of the sources. These libraries were selected because they account for the formation and the gravitational settling of dust grains in the photospheres of the objects. We found that the new atmospheric models represent the infrared spectra of young M–L type dwarfs better than do the previous generation of BT-SETTL models and to AMES-DUSTY models. Models notably reproduce the shape of the pseudo-continuum of the J, H, and K bands for close Teff and log g well, including the strength of water-band absorptions.
We also conducted a similar analysis on the re-extracted 1.1–2.5 μm spectra of the individual components of the tight binary TWA 22 AB. We find that TWA 22 A and TWA 22 B are M5 ± 1 and M5.5 ± 1 dwarfs respectively. Spectra also have features midway between those of 5–8 Myr old M5−M6 dwarfs and those of mature field dwarfs analogs. We used the BT-SETTL10, BT-SETTL12, and GAIA-COND models grids to constrain Teff = 3000 ± 100 K and log g = 4.5 ± 0.5 dex for both components. Assuming the most recent age estimate for the system, the new Teff estimates bring the total system mass predicted by evolutionary models into agreement with the dynamical mass reported in Bonnefoy et al. (2009).
Nevertheless, Teff derived from atmospheric models indicate a quick decrease in the effective temperature at the M–L transition at young ages not observed for field dwarf analogs. We used empirically determined bolometric corrections of young M9.5 and L0 dwarfs to derive new luminosity estimates for objects with known distances. These luminosities were combined to the spectroscopic Teff estimates to compute semi-empirical radii. M9.5 members of 1–3 Myr clusters and star-forming region have radii that are two to three times bigger than those predicted using evolutionary models. This inconsistency is equivalent to overpredicting the temperatures of 300 to 500 K by the models compared to the ones determined spectroscopically. We then ultimately examined the possible biases related to spectral modeling and concluded that:
-
infrared excess and extinction cannot solve the issue for all the late-type objects;
-
bias might still remain in these atmospheric models. The synthetic spectral libraries reproduce the NIR spectra and the SED of the young M9.5–L0 sources simultaneously, for close temperatures. The 0.6–2.5 μm spectral continua can also be reproduced by a single BT-SETTL and DRIFT-PHOENIX synthetic spectrum at similar Teff. However, the main absorptions in the optical are not reproduced coherently. Atmospheric models also fail to reproduce NIR spectra of mature dwarfs with increased surface gravities.
Our library demonstrated the needs for empirical templates of young and late-type dwarfs for the development, on the long term, of a homogeneous classification scheme for young objects that account for surface gravity, cloud properties, temperature, and metallicity. It could already be used to characterize low-mass young companions that will be detected with planet imagers (Subaru/HiCIAO, VLT/SPHERE, and Gemini/GPI). In the latter case, the analysis shows that additional measurements outside the NIR range should be conducted routinely in order to identify excesses and to confirm the analysis derived from atmospheric models.
The ESO quality control parameters are criteria used on data to monitor the instrument status over time and to evaluate the data quality. They can be found at http://www.eso.org/observing/dfo/quality/SINFONI/qc/qc1.html. We used them to check the consistency of the number of non linear pixels found, the distortion solution, the median inter-slitlet distances on the detector, and the dispersion solution for each source and setup.
McElwain et al. (2007) and Lavigne et al. (2009) do not find this line in spectra of this companion taken with two other integral-field spectrographs at different epochs.
http://www.astro.ucla.edu/ ~ mclean/BDSSarchive/
Spitzer magnitudes were converted to flux densities using the Gemini converter: http://www.gemini.edu/?q=node/11119
Similar results can be found in Bonnefoy (2010) and http://tel.archives-ouvertes.fr/docs/00/55/54/96/ANNEX/slides_soutenance_optim.pdf
Acknowledgments
We thank the ESO Paranal staff for performing the service-mode observations and for their support on the data reduction. We acknowledge partial financial support from the Agence Nationale de la Recherche and the Programmes Nationaux de Planétologie et de Physique Stellaire (PNP & PNPS), in France. C. Pinte acknowledges funding from the European Commission’s 7th Framework Program (contract PERG06-GA-2009-256513) and from the Agence Nationale de la Recherche (ANR) of France under contract ANR-2010-JCJC-0504-01. G. Chauvin also acknowledges funding from Agence Nationale de la Recherche (ANR) of France through project grant ANR10-BLANC0504-01. We thank in particular Christiane Helling, Sorren Witte, and Peter Hauschildt for developing and providing the DRIFT-PHOENIX grid. We are grateful to David Spiegel, Adam Burrows, and Gabriel-Dominique Marleau for giving us complementary predictions from the “warm-start” models and/or discussing the validity of the models. We also thank Kevin Luhman, Kelle Cruz, Mark Marley, Beth Biller, and Agnes Lèbre for fruitful discussions about the characterization of young objects, the photometry of AB Pic b, and on the spectroscopic properties of Mira variables. We are grateful to Emily Rice, Nadya Gorlova, Katelyn Allers, Laird Close, Victor Béjar, and August Muench for providing their spectra. We also acknowledge Ian S. McLean, Michael C. Cushing, John T. Rayner, Yoichi Itoh, Nicolas Lodieu, and Kelle Cruz for providing a free online access to their spectral libraries. This research has also benefited from the SpeX Prism Spectral Libraries, maintained by Adam Burgasser at http://pono.ucsd.edu/~adam/browndwarfs/spexprism
References
- Abuter, R., Schreiber, J., Eisenhauer, F., et al. 2006, New Astron. Rev., 50, 398 [NASA ADS] [CrossRef] [Google Scholar]
- Ali, B., Carr, J. S., Depoy, D. L., Frogel, J. A., & Sellgren, K. 1995, AJ, 110, 2415 [NASA ADS] [CrossRef] [Google Scholar]
- Allard, F., Hauschildt, P. H., Alexander, D. R., Tamanai, A., & Schweitzer, A. 2001, ApJ, 556, 357 [NASA ADS] [CrossRef] [Google Scholar]
- Allard, F., Homeier, D., & Freytag, B. 2011, in 16th Cambridge Workshop on Cool Stars, Stellar Systems, and the Sun, eds. C. Johns-Krull, M. K. Browning, & A. A. West, ASP Conf. Ser., 448, 91 [Google Scholar]
- Allard, F., Homeier, D., Freytag, B., & Sharp, C. M. 2012, in EAS Pub. Ser. 57, eds. C. Reylé, C. Charbonnel, & M. Schultheis, 3 [Google Scholar]
- Allard, F., Homeier, D., Freytag, B., Schaffenberger, W., & Rajpurohit, A. S. 2013, Mem. S. A. It. Suppl., 24, 128 [Google Scholar]
- Allers, K. N., Jaffe, D. T., Luhman, K. L., et al. 2007, ApJ, 657, 511 [NASA ADS] [CrossRef] [Google Scholar]
- Allers, K. N., Liu, M. C., Shkolnik, E., et al. 2009, ApJ, 697, 824 [NASA ADS] [CrossRef] [Google Scholar]
- Allers, K. N., Liu, M. C., Dupuy, T. J., & Cushing, M. C. 2010, ApJ, 715, 561 [NASA ADS] [CrossRef] [Google Scholar]
- Alvarez, R., Lançon, A., Plez, B., & Wood, P. R. 2000, A&A, 353, 322 [NASA ADS] [Google Scholar]
- Ammler-von Eiff, M., & Guenther, E. W. 2009, A&A, 508, 677 [NASA ADS] [CrossRef] [EDP Sciences] [Google Scholar]
- Asplund, M., Grevesse, N., Sauval, A. J., & Scott, P. 2009, ARA&A, 47, 481 [NASA ADS] [CrossRef] [Google Scholar]
- Auman, Jr., J. 1967, ApJS, 14, 171 [NASA ADS] [CrossRef] [Google Scholar]
- Bannister, N. P., & Jameson, R. F. 2007, MNRAS, 378, L24 [NASA ADS] [Google Scholar]
- Baraffe, I., Chabrier, G., Allard, F., & Hauschildt, P. H. 1998, A&A, 337, 403 [NASA ADS] [Google Scholar]
- Baraffe, I., Chabrier, G., Allard, F., & Hauschildt, P. H. 2002, A&A, 382, 563 [NASA ADS] [CrossRef] [EDP Sciences] [Google Scholar]
- Baraffe, I., Chabrier, G., & Gallardo, J. 2009, ApJ, 702, L27 [NASA ADS] [CrossRef] [Google Scholar]
- Barenfeld, S. A., Bubar, E. J., Mamajek, E. E., & Young, P. A. 2013, ApJ, 766, 6 [NASA ADS] [CrossRef] [Google Scholar]
- Barman, T. S., Macintosh, B., Konopacky, Q. M., & Marois, C. 2011, ApJ, 733, 65 [NASA ADS] [CrossRef] [Google Scholar]
- Bate, M. R. 2012, MNRAS, 419, 3115 [NASA ADS] [CrossRef] [Google Scholar]
- Becklin, E. E., & Zuckerman, B. 1988, Nature, 336, 656 [NASA ADS] [CrossRef] [Google Scholar]
- Béjar, V. J. S., Zapatero Osorio, M. R., Pérez-Garrido, A., et al. 2008, ApJ, 673, L185 [NASA ADS] [CrossRef] [Google Scholar]
- Biazzo, K., D’Orazi, V., Desidera, S., et al. 2012, MNRAS, 427, 2905 [NASA ADS] [CrossRef] [Google Scholar]
- Bihain, G., Rebolo, R., Zapatero Osorio, M. R., Béjar, V. J. S., & Caballero, J. A. 2010, A&A, 519, A93 [NASA ADS] [CrossRef] [EDP Sciences] [Google Scholar]
- Biller, B. A., Liu, M. C., Wahhaj, Z., et al. 2013, ApJ, 777, 160 [NASA ADS] [CrossRef] [Google Scholar]
- Boccaletti, A., Chauvin, G., Baudoz, P., & Beuzit, J. 2008, A&A, 482, 939 [NASA ADS] [CrossRef] [EDP Sciences] [Google Scholar]
- Boley, A. C. 2009, ApJ, 695, L53 [NASA ADS] [CrossRef] [Google Scholar]
- Bonnefoy, M. 2010, Ph.D. Thesis, Université de Grenoble, France http://tel.archives-ouvertes.fr/docs/00/55/54/96/PDF/THESE_enligne_MickaelBonnefoy.pdf [Google Scholar]
- Bonnefoy, M., Chauvin, G., Dumas, C., et al. 2009, A&A, 506, 799 [NASA ADS] [CrossRef] [EDP Sciences] [Google Scholar]
- Bonnefoy, M., Chauvin, G., Rojo, P., et al. 2010, A&A, 512, A52 [NASA ADS] [CrossRef] [EDP Sciences] [Google Scholar]
- Bonnefoy, M., Boccaletti, A., Lagrange, A.-M., et al. 2013, A&A, 555, A107 [NASA ADS] [CrossRef] [EDP Sciences] [Google Scholar]
- Bonnet, H., Ströbele, S., Biancat-Marchet, F., et al. 2003, in Proc. SPIE 4839, eds. P. L. Wizinowich, & D. Bonaccini, 329 [Google Scholar]
- Bonnet, H., Abuter, R., Baker, A., et al. 2004, The Messenger, 117, 17 [NASA ADS] [Google Scholar]
- Borysow, A., Jorgensen, U. G., & Zheng, C. 1997, A&A, 324, 185 [NASA ADS] [Google Scholar]
- Bouy, H., Brandner, W., Martín, E. L., et al. 2003, AJ, 126, 1526 [NASA ADS] [CrossRef] [Google Scholar]
- Bowler, B. P., Liu, M. C., Kraus, A. L., Mann, A. W., & Ireland, M. J. 2011, ApJ, 743, 148 [NASA ADS] [CrossRef] [Google Scholar]
- Bowler, B. P., Liu, M. C., Shkolnik, E. L., et al. 2012, ApJ, 753, 142 [NASA ADS] [CrossRef] [Google Scholar]
- Briceño, C., Luhman, K. L., Hartmann, L., Stauffer, J. R., & Kirkpatrick, J. D. 2002, ApJ, 580, 317 [NASA ADS] [CrossRef] [Google Scholar]
- Brott, I. & Hauschildt, P. H. 2005, in The Three-Dimensional Universe with Gaia, eds. C. Turon, K. S. O’Flaherty, & M. A. C. Perryman, ESA SP, 576, 565 [Google Scholar]
- Burgasser, A. J., Kirkpatrick, J. D., Brown, M. E., et al. 2002, ApJ, 564, 421 [NASA ADS] [CrossRef] [Google Scholar]
- Burrows, A., Hubbard, W. B., Lunine, J. I., & Liebert, J. 2001, Rev. Mod. Phys., 73, 719 [Google Scholar]
- Caffau, E., Ludwig, H.-G., Steffen, M., Freytag, B., & Bonifacio, P. 2011, Sol. Phys., 268, 255 [NASA ADS] [CrossRef] [Google Scholar]
- Carpenter, J. M., Hillenbrand, L. A., Skrutskie, M. F., & Meyer, M. R. 2002, AJ, 124, 1001 [NASA ADS] [CrossRef] [Google Scholar]
- Carson, J., Thalmann, C., Janson, M., et al. 2013, ApJ, 763, L32 [NASA ADS] [CrossRef] [Google Scholar]
- Castellani, V., Degl’Innocenti, S., Pra da Moroni, P. G., & Tordiglione, V. 2002, MNRAS, 334, 193 [NASA ADS] [CrossRef] [Google Scholar]
- Chabrier, G., Baraffe, I., Allard, F., & Hauschildt, P. 2000, ApJ, 542, 464 [NASA ADS] [CrossRef] [Google Scholar]
- Chauvin, G., Thomson, M., Dumas, C., et al. 2003, A&A, 404, 157 [NASA ADS] [CrossRef] [EDP Sciences] [Google Scholar]
- Chauvin, G., Lagrange, A., Dumas, C., et al. 2004, A&A, 425, L29 [NASA ADS] [CrossRef] [EDP Sciences] [MathSciNet] [Google Scholar]
- Chauvin, G., Lagrange, A., Lacombe, F., et al. 2005a, A&A, 430, 1027 [NASA ADS] [CrossRef] [EDP Sciences] [Google Scholar]
- Chauvin, G., Lagrange, A., Zuckerman, B., et al. 2005b, A&A, 438, L29 [NASA ADS] [CrossRef] [EDP Sciences] [Google Scholar]
- Chauvin, G., Lagrange, A., Bonavita, M., et al. 2010, A&A, 509, A52 [NASA ADS] [CrossRef] [EDP Sciences] [Google Scholar]
- Close, L. M., Lenzen, R., Guirado, J. C., et al. 2005, Nature, 433, 286 [NASA ADS] [CrossRef] [PubMed] [Google Scholar]
- Close, L. M., Thatte, N., Nielsen, E. L., et al. 2007, ApJ, 665, 736 [NASA ADS] [CrossRef] [Google Scholar]
- Cohen, M., & Kuhi, L. V. 1976, PASP, 88, 535 [NASA ADS] [CrossRef] [Google Scholar]
- Cruz, K. L., Kirkpatrick, J. D., & Burgasser, A. J. 2009, AJ, 137, 3345 [NASA ADS] [CrossRef] [Google Scholar]
- Cushing, M. C., Rayner, J. T., Davis, S. P., & Vacca, W. D. 2003, ApJ, 582, 1066 [NASA ADS] [CrossRef] [MathSciNet] [Google Scholar]
- Cushing, M. C., Rayner, J. T., & Vacca, W. D. 2005, ApJ, 623, 1115 [NASA ADS] [CrossRef] [Google Scholar]
- Dahn, C. C., Harris, H. C., Vrba, F. J., et al. 2002, AJ, 124, 1170 [NASA ADS] [CrossRef] [Google Scholar]
- Delorme, P., Gagné, J., Girard, J. H., et al. 2013, A&A, 553, L5 [NASA ADS] [CrossRef] [EDP Sciences] [Google Scholar]
- Devillard, N. 1997, The Messenger, 87, 19 [NASA ADS] [Google Scholar]
- Draine, B. T. 2003a, ARA&A, 41, 241 [NASA ADS] [CrossRef] [Google Scholar]
- Draine, B. T. 2003b, ApJ, 598, 1017 [NASA ADS] [CrossRef] [Google Scholar]
- Draine, B. T. 2003c, ApJ, 598, 1026 [NASA ADS] [CrossRef] [Google Scholar]
- Ducourant, C., Teixeira, R., Chauvin, G., et al. 2008, A&A, 477, L1 [NASA ADS] [CrossRef] [EDP Sciences] [Google Scholar]
- Eisenhauer, F., Abuter, R., Bickert, K., et al. 2003, in Proc. SPIE 4841, eds. M. Iye, & A. F. M. Moorwood, 1548 [Google Scholar]
- Faherty, J. K., Rice, E. L., Cruz, K. L., Mamajek, E. E., & Núñez, A. 2013, AJ, 145, 2 [NASA ADS] [CrossRef] [Google Scholar]
- Fernández, D., Figueras, F., & Torra, J. 2008, A&A, 480, 735 [NASA ADS] [CrossRef] [EDP Sciences] [Google Scholar]
- Fortney, J. J., Marley, M. S., Saumon, D., & Lodders, K. 2008, ApJ, 683, 1104 [NASA ADS] [CrossRef] [Google Scholar]
- Geballe, T. R., Knapp, G. R., Leggett, S. K., et al. 2002, ApJ, 564, 466 [NASA ADS] [CrossRef] [Google Scholar]
- Gizis, J. E. 2002, ApJ, 575, 484 [NASA ADS] [CrossRef] [Google Scholar]
- Gizis, J. E., Monet, D. G., Reid, I. N., et al. 2000, AJ, 120, 1085 [NASA ADS] [CrossRef] [Google Scholar]
- Gorlova, N. I., Meyer, M. R., Rieke, G. H., & Liebert, J. 2003, ApJ, 593, 1074 [NASA ADS] [CrossRef] [Google Scholar]
- Goto, M., Kobayashi, N., Terada, H., et al. 2002, ApJ, 567, L59 [NASA ADS] [CrossRef] [Google Scholar]
- Grevesse, N., Noels, A., & Sauval, A. J. 1993, A&A, 271, 587 [NASA ADS] [Google Scholar]
- Guieu, S., Pinte, C., Monin, J., et al. 2007, A&A, 465, 855 [NASA ADS] [CrossRef] [EDP Sciences] [Google Scholar]
- Hartmann, L. 2001, AJ, 121, 1030 [NASA ADS] [CrossRef] [Google Scholar]
- Hayes, D. S. 1985, in Calibration of Fundamental Stellar Quantities, eds. D. S. Hayes, L. E. Pasinetti, & A. G. D. Philip, IAU Symp., 111, 225 [Google Scholar]
- Helling, C., & Woitke, P. 2006, A&A, 455, 325 [NASA ADS] [CrossRef] [EDP Sciences] [Google Scholar]
- Helling, C., Ackerman, A., Allard, F., et al. 2008a, MNRAS, 391, 1854 [NASA ADS] [CrossRef] [Google Scholar]
- Helling, C., Dehn, M., Woitke, P., & Hauschildt, P. H. 2008b, ApJ, 675, L105 [NASA ADS] [CrossRef] [Google Scholar]
- Herczeg, G. J., Cruz, K. L., & Hillenbrand, L. A. 2009, ApJ, 696, 1589 [Google Scholar]
- Ireland, M. J., Kraus, A., Martinache, F., Law, N., & Hillenbrand, L. A. 2011, ApJ, 726, 113 [NASA ADS] [CrossRef] [Google Scholar]
- Itoh, Y., Hayashi, M., Tamura, M., et al. 2005, ApJ, 620, 984 [NASA ADS] [CrossRef] [Google Scholar]
- James, D. J., Melo, C., Santos, N. C., & Bouvier, J. 2006, A&A, 446, 971 [NASA ADS] [CrossRef] [EDP Sciences] [Google Scholar]
- Joergens, V., Bonnefoy, M., Liu, Y., et al. 2013, A&A, 558, L7 [NASA ADS] [CrossRef] [EDP Sciences] [Google Scholar]
- Jones, H. R. A., Longmore, A. J., Jameson, R. F., & Mountain, C. M. 1994, MNRAS, 267, 413 [NASA ADS] [Google Scholar]
- Kalas, P., Graham, J. R., Chiang, E., et al. 2008, Science, 322, 1345 [NASA ADS] [CrossRef] [PubMed] [Google Scholar]
- Kenyon, S. J., & Hartmann, L. 1995, ApJS, 101, 117 [NASA ADS] [CrossRef] [Google Scholar]
- King, J. R., Villarreal, A. R., Soderblom, D. R., Gulliver, A. F., & Adelman, S. J. 2003, AJ, 125, 1980 [NASA ADS] [CrossRef] [Google Scholar]
- Kirkpatrick, J. D. 2005, ARA&A, 43, 195 [NASA ADS] [CrossRef] [Google Scholar]
- Kirkpatrick, J. D., Beichman, C. A., & Skrutskie, M. F. 1997, ApJ, 476, 311 [NASA ADS] [CrossRef] [Google Scholar]
- Kirkpatrick, J. D., Reid, I. N., Liebert, J., et al. 1999, ApJ, 519, 802 [NASA ADS] [CrossRef] [Google Scholar]
- Kirkpatrick, J. D., Reid, I. N., Liebert, J., et al. 2000, AJ, 120, 447 [NASA ADS] [CrossRef] [Google Scholar]
- Kirkpatrick, J. D., Dahn, C. C., Monet, D. G., et al. 2001, AJ, 121, 3235 [NASA ADS] [CrossRef] [Google Scholar]
- Kirkpatrick, J. D., Barman, T. S., Burgasser, A. J., et al. 2006, ApJ, 639, 1120 [NASA ADS] [CrossRef] [Google Scholar]
- Kirkpatrick, J. D., Cruz, K. L., Barman, T. S., et al. 2008, ApJ, 689, 1295 [NASA ADS] [CrossRef] [Google Scholar]
- Konopacky, Q. M., Ghez, A. M., Duchêne, G., McCabe, C., & Macintosh, B. A. 2007, AJ, 133, 2008 [NASA ADS] [CrossRef] [Google Scholar]
- Kratter, K. M., Murray-Clay, R. A., & Youdin, A. N. 2010, ApJ, 710, 1375 [NASA ADS] [CrossRef] [Google Scholar]
- Kraus, A. L., White, R. J., & Hillenbrand, L. A. 2006, ApJ, 649, 306 [NASA ADS] [CrossRef] [Google Scholar]
- Kuzuhara, M., Tamura, M., Ishii, M., et al. 2011, AJ, 141, 119 [NASA ADS] [CrossRef] [Google Scholar]
- Lagrange, A.-M., Bonnefoy, M., Chauvin, G., et al. 2010, Science, 329, 57 [NASA ADS] [CrossRef] [PubMed] [Google Scholar]
- Lambrechts, M., & Johansen, A. 2012, A&A, 544, A32 [Google Scholar]
- Lançon, A., & Mouhcine, M. 2002, A&A, 393, 167 [NASA ADS] [CrossRef] [EDP Sciences] [Google Scholar]
- Lavigne, J.-F., Doyon, R., Lafrenière, D., Marois, C., & Barman, T. 2009, ApJ, 704, 1098 [NASA ADS] [CrossRef] [Google Scholar]
- Leggett, S. K., Allard, F., Berriman, G., Dahn, C. C., & Hauschildt, P. H. 1996, ApJS, 104, 117 [NASA ADS] [CrossRef] [EDP Sciences] [Google Scholar]
- Leggett, S. K., Allard, F., Geballe, T. R., Hauschildt, P. H., & Schweitzer, A. 2001, ApJ, 548, 908 [NASA ADS] [CrossRef] [Google Scholar]
- Levine, J. L., Steinhauer, A., Elston, R. J., & Lada, E. A. 2006, ApJ, 646, 1215 [NASA ADS] [CrossRef] [Google Scholar]
- Lodieu, N., Hambly, N. C., Jameson, R. F., & Hodgkin, S. T. 2008, MNRAS, 383, 1385 [NASA ADS] [CrossRef] [Google Scholar]
- Lommen, D., Jørgensen, J. K., van Dishoeck, E. F., & Crapsi, A. 2008, A&A, 481, 141 [NASA ADS] [CrossRef] [EDP Sciences] [Google Scholar]
- Lowrance, P. J., McCarthy, C., Becklin, E. E., et al. 1999, ApJ, 512, L69 [NASA ADS] [CrossRef] [Google Scholar]
- Lowrance, P. J., Schneider, G., Kirkpatrick, J. D., et al. 2000, ApJ, 541, 390 [NASA ADS] [CrossRef] [Google Scholar]
- Lowrance, P. J., Becklin, E. E., Schneider, G., et al. 2005, AJ, 130, 1845 [NASA ADS] [CrossRef] [Google Scholar]
- Lucas, P. W., & Roche, P. F. 2000, MNRAS, 314, 858 [NASA ADS] [CrossRef] [MathSciNet] [Google Scholar]
- Lucas, P. W., Roche, P. F., Allard, F., & Hauschildt, P. H. 2001, MNRAS, 326, 695 [NASA ADS] [CrossRef] [Google Scholar]
- Luhman, K. L. 1999, ApJ, 525, 466 [NASA ADS] [CrossRef] [Google Scholar]
- Luhman, K. L. 2004, ApJ, 617, 1216 [NASA ADS] [CrossRef] [Google Scholar]
- Luhman, K. L. 2007, ApJS, 173, 104 [NASA ADS] [CrossRef] [Google Scholar]
- Luhman, K. L., & Rieke, G. H. 1999, ApJ, 525, 440 [NASA ADS] [CrossRef] [Google Scholar]
- Luhman, K. L., Liebert, J., & Rieke, G. H. 1997, ApJ, 489, L165 [NASA ADS] [CrossRef] [Google Scholar]
- Luhman, K. L., Briceño, C., Stauffer, J. R., et al. 2003a, ApJ, 590, 348 [NASA ADS] [CrossRef] [Google Scholar]
- Luhman, K. L., Stauffer, J. R., Muench, A. A., et al. 2003b, ApJ, 593, 1093 [NASA ADS] [CrossRef] [Google Scholar]
- Luhman, K. L., Peterson, D. E., & Megeath, S. T. 2004, ApJ, 617, 565 [NASA ADS] [CrossRef] [Google Scholar]
- Luhman, K. L., Adame, L., D’Alessio, P., et al. 2005a, ApJ, 635, L93 [NASA ADS] [CrossRef] [Google Scholar]
- Luhman, K. L., D’Alessio, P., Calvet, N., et al. 2005b, ApJ, 620, L51 [NASA ADS] [CrossRef] [Google Scholar]
- Luhman, K. L., Stauffer, J. R., & Mamajek, E. E. 2005c, ApJ, 628, L69 [NASA ADS] [CrossRef] [Google Scholar]
- Luhman, K. L., Wilson, J. C., Brandner, W., et al. 2006, ApJ, 649, 894 [NASA ADS] [CrossRef] [Google Scholar]
- Luhman, K. L., Patten, B. M., Marengo, M., et al. 2007, ApJ, 654, 570 [NASA ADS] [CrossRef] [Google Scholar]
- Luhman, K. L., Allen, L. E., Allen, P. R., et al. 2008, ApJ, 675, 1375 [NASA ADS] [CrossRef] [Google Scholar]
- Luhman, K. L., Mamajek, E. E., Allen, P. R., & Cruz, K. L. 2009, ApJ, 703, 399 [NASA ADS] [CrossRef] [Google Scholar]
- Luhman, K. L., Allen, P. R., Espaillat, C., Hartmann, L., & Calvet, N. 2010, ApJS, 186, 111 [NASA ADS] [CrossRef] [Google Scholar]
- Lyubchik, Y., Jones, H. R. A., Pavlenko, Y. V., et al. 2007, A&A, 473, 257 [NASA ADS] [CrossRef] [EDP Sciences] [Google Scholar]
- Mace, G. N., Prato, L., Torres, G., et al. 2012, AJ, 144, 55 [NASA ADS] [CrossRef] [Google Scholar]
- Malo, L., Doyon, R., Lafrenière, D., et al. 2013, ApJ, 762, 88 [NASA ADS] [CrossRef] [Google Scholar]
- Marleau, G.-D., & Cumming, A. 2014, MNRAS, 437, 1378 [NASA ADS] [CrossRef] [Google Scholar]
- Marois, C., Macintosh, B., Barman, T., et al. 2008, Science, 322, 1348 [NASA ADS] [CrossRef] [PubMed] [Google Scholar]
- Marois, C., Zuckerman, B., Konopacky, Q. M., Macintosh, B., & Barman, T. 2010, Nature, 468, 1080 [NASA ADS] [CrossRef] [PubMed] [Google Scholar]
- Martin, E. L., Rebolo, R., & Zapatero-Osorio, M. R. 1996, ApJ, 469, 706 [NASA ADS] [CrossRef] [Google Scholar]
- Martín, E. L., Delfosse, X., Basri, G., et al. 1999, AJ, 118, 2466 [NASA ADS] [CrossRef] [Google Scholar]
- Mathieu, R. D., Baraffe, I., Simon, M., Stassun, K. G., & White, R. 2007, in Protostars and Planets V, 411 (Tuscon: University of Arizona Press) [Google Scholar]
- McElwain, M. W., Metchev, S. A., Larkin, J. E., et al. 2007, ApJ, 656, 505 [NASA ADS] [CrossRef] [Google Scholar]
- McGovern, M. R., Kirkpatrick, J. D., McLean, I. S., et al. 2004, ApJ, 600, 1020 [NASA ADS] [CrossRef] [Google Scholar]
- McLean, I. S., McGovern, M. R., Burgasser, A. J., et al. 2003, ApJ, 596, 561 [NASA ADS] [CrossRef] [MathSciNet] [Google Scholar]
- McLean, I. S., Prato, L., McGovern, M. R., et al. 2007, ApJ, 658, 1217 [NASA ADS] [CrossRef] [Google Scholar]
- Mohanty, S., Jayawardhana, R., & Basri, G. 2005, ApJ, 626, 498 [NASA ADS] [CrossRef] [Google Scholar]
- Mohanty, S., Jayawardhana, R., Huélamo, N., & Mamajek, E. 2007, ApJ, 657, 1064 [NASA ADS] [CrossRef] [Google Scholar]
- Moorwood, A., Cuby, J.-G., & Lidman, C. 1998, The Messenger, 91, 9 [NASA ADS] [Google Scholar]
- Mordasini, C., Alibert, Y., Klahr, H., & Henning, T. 2012, A&A, 547, A111 [NASA ADS] [CrossRef] [EDP Sciences] [Google Scholar]
- Mountain, C. M., Selby, M. J., Leggett, S. K., Blackwell, D. E., & Petford, A. D. 1985, A&A, 151, 399 [NASA ADS] [Google Scholar]
- Muench, A. A., Lada, C. J., Luhman, K. L., Muzerolle, J., & Young, E. 2007, AJ, 134, 411 [NASA ADS] [CrossRef] [Google Scholar]
- Nakajima, T., Oppenheimer, B. R., Kulkarni, S. R., et al. 1995, Nature, 378, 463 [NASA ADS] [CrossRef] [Google Scholar]
- Neuhäuser, R., & Guenther, E. W. 2004, A&A, 420, 647 [NASA ADS] [CrossRef] [EDP Sciences] [Google Scholar]
- Neuhäuser, R., Guenther, E. W., Petr, M. G., et al. 2000, A&A, 360, L39 [NASA ADS] [Google Scholar]
- Neuhäuser, R., Guenther, E. W., Wuchterl, G., et al. 2005, A&A, 435, L13 [NASA ADS] [CrossRef] [EDP Sciences] [Google Scholar]
- Neuhäuser, R., Ginski, C., Schmidt, T. O. B., & Mugrauer, M. 2011, MNRAS, 416, 1430 [NASA ADS] [CrossRef] [Google Scholar]
- Nielsen, E. L., Close, L. M., Guirado, J. C., et al. 2005, Astron. Nachr., 326, 1033 [NASA ADS] [CrossRef] [Google Scholar]
- Oasa, Y., Tamura, M., & Sugitani, K. 1999, ApJ, 526, 336 [NASA ADS] [CrossRef] [Google Scholar]
- Patience, J., King, R. R., De Rosa, R. J., et al. 2012, A&A, 540, A85 [NASA ADS] [CrossRef] [EDP Sciences] [Google Scholar]
- Patten, B. M., Stauffer, J. R., Burrows, A., et al. 2006, ApJ, 651, 502 [NASA ADS] [CrossRef] [Google Scholar]
- Pecaut, M. J., Mamajek, E. E., & Bubar, E. J. 2012, ApJ, 746, 154 [NASA ADS] [CrossRef] [Google Scholar]
- Phillips, J. G., Davis, S. P., Lindgren, B., & Balfour, W. J. 1987, ApJS, 65, 721 [NASA ADS] [CrossRef] [Google Scholar]
- Pinte, C., Ménard, F., Duchêne, G., & Bastien, P. 2006, A&A, 459, 797 [NASA ADS] [CrossRef] [EDP Sciences] [Google Scholar]
- Rameau, J., Chauvin, G., Lagrange, A.-M., et al. 2013, A&A, 553, A60 [NASA ADS] [CrossRef] [EDP Sciences] [Google Scholar]
- Rayner, J. T., Toomey, D. W., Onaka, P. M., et al. 2003, PASP, 115, 362 [NASA ADS] [CrossRef] [Google Scholar]
- Rayner, J. T., Cushing, M. C., & Vacca, W. D. 2009, ApJS, 185, 289 [NASA ADS] [CrossRef] [Google Scholar]
- Reid, I. N., Burgasser, A. J., Cruz, K. L., Kirkpatrick, J. D., & Gizis, J. E. 2001, AJ, 121, 1710 [NASA ADS] [CrossRef] [Google Scholar]
- Rice, E. L., Barman, T., Mclean, I. S., Prato, L., & Kirkpatrick, J. D. 2010, ApJS, 186, 63 [NASA ADS] [CrossRef] [Google Scholar]
- Robberto, M., Soderblom, D. R., Scandariato, G., et al. 2010, AJ, 139, 950 [NASA ADS] [CrossRef] [Google Scholar]
- Rousselot, P., Lidman, C., Cuby, J., Moreels, G., & Monnet, G. 2000, A&A, 354, 1134 [NASA ADS] [Google Scholar]
- Santos, N. C., Melo, C., James, D. J., et al. 2008, A&A, 480, 889 [NASA ADS] [CrossRef] [EDP Sciences] [Google Scholar]
- Schlegel, D. J., Finkbeiner, D. P., & Davis, M. 1998, ApJ, 500, 525 [NASA ADS] [CrossRef] [Google Scholar]
- Schmidt, T. O. B., Neuhäuser, R., Seifahrt, A., et al. 2008, A&A, 491, 311 [NASA ADS] [CrossRef] [EDP Sciences] [Google Scholar]
- Schweitzer, A., Gizis, J. E., Hauschildt, P. H., Allard, F., & Reid, I. N. 2001, ApJ, 555, 368 [NASA ADS] [CrossRef] [Google Scholar]
- Seifahrt, A., Neuhäuser, R., & Hauschildt, P. H. 2007, A&A, 463, 309 [NASA ADS] [CrossRef] [EDP Sciences] [Google Scholar]
- Sembach, K. R., & Savage, B. D. 1992, ApJS, 83, 147 [NASA ADS] [CrossRef] [Google Scholar]
- Slesnick, C. L., Hillenbrand, L. A., & Carpenter, J. M. 2004, ApJ, 610, 1045 [NASA ADS] [CrossRef] [Google Scholar]
- Song, I., Zuckerman, B., & Bessell, M. S. 2003, ApJ, 599, 342 [Google Scholar]
- Sparks, W. B. & Ford, H. C. 2002, ApJ, 578, 543 [NASA ADS] [CrossRef] [Google Scholar]
- Spiegel, D. S., & Burrows, A. 2012, ApJ, 745, 174 [NASA ADS] [CrossRef] [Google Scholar]
- Stephens, D. C., Leggett, S. K., Cushing, M. C., et al. 2009, ApJ, 702, 154 [NASA ADS] [CrossRef] [Google Scholar]
- Strom, K. M., Strom, S. E., Edwards, S., Cabrit, S., & Skrutskie, M. F. 1989, AJ, 97, 1451 [NASA ADS] [CrossRef] [Google Scholar]
- Tamura, M., Itoh, Y., Oasa, Y., & Nakajima, T. 1998, Science, 282, 1095 [NASA ADS] [CrossRef] [Google Scholar]
- Teixeira, R., Ducourant, C., Chauvin, G., et al. 2009, A&A, 503, 281 [NASA ADS] [CrossRef] [EDP Sciences] [Google Scholar]
- Testi, L. 2009, A&A, 503, 639 [NASA ADS] [CrossRef] [EDP Sciences] [Google Scholar]
- Testi, L., D’Antona, F., Ghinassi, F., et al. 2001, ApJ, 552, L147 [NASA ADS] [CrossRef] [Google Scholar]
- Thatte, N., Abuter, R., Tecza, M., et al. 2007, MNRAS, 378, 1229 [NASA ADS] [CrossRef] [Google Scholar]
- Theodossiou, E., & Danezis, E. 1991, Ap&SS, 183, 91 [NASA ADS] [CrossRef] [Google Scholar]
- Todorov, K., Luhman, K. L., & McLeod, K. K. 2010, ApJ, 714, L84 [NASA ADS] [CrossRef] [Google Scholar]
- Torres, C. A. O., Quast, G. R., Melo, C. H. F., & Sterzik, M. F. 2008, in Handbook of star-forming regions II, Vol. 5 (The Southern Sky APS Monograph Publications), ed. B. Reipurth, 757 [Google Scholar]
- Tsuji, T., Ohnaka, K., Aoki, W., & Nakajima, T. 1996, A&A, 308, L29 [NASA ADS] [Google Scholar]
- van Belle, G. T., & von Braun, K. 2009, ApJ, 694, 1085 [NASA ADS] [CrossRef] [Google Scholar]
- van Belle, G. T., Creech-Eakman, M. J., & Hart, A. 2009, MNRAS, 394, 1925 [NASA ADS] [CrossRef] [Google Scholar]
- van der Bliek, N. S., Manfroid, J., & Bouchet, P. 1996, A&AS, 119, 547 [NASA ADS] [CrossRef] [EDP Sciences] [Google Scholar]
- Viana Almeida, P., Santos, N. C., Melo, C., et al. 2009, A&A, 501, 965 [NASA ADS] [CrossRef] [EDP Sciences] [Google Scholar]
- Wallace, L., & Hinkle, K. 2001, ApJ, 559, 424 [NASA ADS] [CrossRef] [Google Scholar]
- Weights, D. J., Lucas, P. W., Roche, P. F., Pinfield, D. J., & Riddick, F. 2009, MNRAS, 392, 817 [NASA ADS] [CrossRef] [Google Scholar]
- Weinberger, A. J., Anglada-Escudé, G., & Boss, A. P. 2013, ApJ, 762, 118 [NASA ADS] [CrossRef] [Google Scholar]
- White, R. J., & Ghez, A. M. 2001, ApJ, 556, 265 [Google Scholar]
- Witte, S., Helling, C., Barman, T., Heidrich, N., & Hauschildt, P. H. 2011, A&A, 529, A44 [NASA ADS] [CrossRef] [EDP Sciences] [Google Scholar]
- Woitke, P., & Helling, C. 2003, A&A, 399, 297 [NASA ADS] [CrossRef] [EDP Sciences] [Google Scholar]
- Woitke, P., & Helling, C. 2004, A&A, 414, 335 [NASA ADS] [CrossRef] [EDP Sciences] [Google Scholar]
- Zapatero Osorio, M. R., Béjar, V. J. S., Martín, E. L., et al. 2000, Science, 290, 103 [NASA ADS] [CrossRef] [PubMed] [Google Scholar]
- Zapatero Osorio, M. R., Rebolo, R., Bihain, G., et al. 2010, ApJ, 715, 1408 [NASA ADS] [CrossRef] [Google Scholar]
Appendix A: Details on the equivalent width computation
The EW and associated error bars are computed following the method of Sembach & Savage (1992). The pseudo-continuum is fitted using a third-order Legendre polynomial locally around the line ( from λ1 to λ2, and from λ3 to λ4) and interpolated at the feature wavelengths (between λ2 to λ3). The reference wavelengths used to compute the EW displayed in Fig. 11 are reported in Table A.1.
Reference wavelengths used for the computing of equivalent widths of Na I and K I lines.
Appendix B: New analysis of Lodieu et al. 2008 spectra
We re-assigned NIR spectra to the sample of young late-type dwarfs members of Upper Sco presented in Lodieu et al. (2008) using the method explained in Sect. 3.1.2 and based on optical standards. We report our results in Table B.1. Each spectrum from this library was also compared to synthetic spectra from the BT-SETTL libraries and to the DRIFT-PHOENIX grid. The best-fit temperatures and surface gravities are reported in Table B.1. The atmospheric parameters agree with the values reported in Sect. 3.2.2 for dwarfs with similar spectral types.
Appendix C: New near-infrared photometry for AB Pic b and GSC08047-00232 B
AB Pic was observed on March 19, 2006 with the SofI NIR spectrograph and imaging camera at NTT (Moorwood et al. 1998). Four exposures of 20 and 40 × 1.2 seconds were recorded using the J and Ks band filters of the instrument, respectively. We reduced the data using the ESO Eclipse software (Devillard 1997). The companion is resolved in both datasets. The stars saturate the detector and do not enable us to directly compute a contrast for the companion. We removed most of its flux subtracting a radial profile. A few dozen of unrelated sources are detected in the field of view (up to 6.9′) of the final mozaic images. We then chose to perform relative photometry using ten of the brightest sources with accurate 2MASS photometry. The results are reported in Table C.1. The error quadratically combines the mean error bar associated to the 2MASS magnitudes of the reference stars, and the scatter in magnitude found for the different references considered.
The discrepancy of this photometry with respect to the one reported in Chauvin et al. (2005b) led us to re-analyze the NaCo data presented in this paper. We reported a new NaCo J, H, and Ks photometry of the companion with more realistic error bars in Table C.1.
We also estimated the magnitude of the companion in the L′ band of NaCo and reported it in Table C.1. We used the contrast value reported in Rameau et al. (2013) for that purpose (but considering the measured transmission factor of the NaCo neutral density filter; see Bonnefoy et al. 2013). We assumed that the WISE W1 photometry and L′ band magnitude of the star are close. This seems to be the case since the W1 − Ks color of AB Pic corresponds well to L′ − Ks colors of stars at the same spectral types (van der Bliek et al. 1996).
GSC08047-00232 B was also observed with SofI in the J and Ks bands on October 11, 2005. We built calibrated images from the four raw frames recorded in each band. The photometry of the companion was extracted the same way as for AB Pic b. The NIR photometry of the companion is summarized in Table C.2.
Appendix D: Optical fluxes of young companions
AB Pic b and HR7329 B were observed with the Hubble/Wide Field Camera 3 instrument on and January 24 and February 16, 2012, respectively. We used flux-calibrated images provided by the ESA Hubble Science Archive system10 of the sources corresponding to observations performed with ten filters with central wavelengths from 3354.8 Å to 9158.8 Å. We removed the stellar halo using a radial profile of the source or a low-pass filter and integrated the flux of the companion in five-pixel width circular appertures. The companions were too faint to be detected shortward of 4.77 μm. We then rather estimated upper limits on the flux at these wavelengths. Results are reported in Table D.1.
Revised and new NIR photometry of AB Pic b.
Near-infrared photometry of GSC08047-00232 B.
Hubble/WFC3 flux densities for young companions and isolated brown-dwarfs of our sample with avaliable photometric data longward of 3 μm.
All Tables
Atmospheric parameters derived from the fit of our empirical spectra by synthetic spectra of the BT-SETTL10, BT-SETTL12, and DRIFT-PHOENIX libraries in the J, H + K, and JHK bands.
Atmospheric parameters derived from the fit of the TWA 22A & B spectra by synthetic spectra of the GAIA-COND and BT-SETTL libraries in the J, H + K, and JHK bands.
Adopted atmospheric parameters derived from the fit of our empirical spectra by synthetic spectra and compared to effective temperatures obtained from spectral types (see text).
Masses and radii predicted by evolutionary models of Baraffe et al. (1998) and Chabrier et al. (2000) for the given age, Teff, and log g estimates of the SINFONI sources.
Parameters of the disk models used to represent the spectral energy distribution model of Cha1109 and OTS 44, and considering two different photospheres for the objects.
Reference wavelengths used for the computing of equivalent widths of Na I and K I lines.
Hubble/WFC3 flux densities for young companions and isolated brown-dwarfs of our sample with avaliable photometric data longward of 3 μm.
All Figures
|
Fig. 1 J band spectra (1.1–1.35 μm) of the young M6–L4.5 objects observed with SINFONI. Molecular absorptions are indicated in green and atomic features in blue. |
| In the text | |
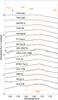 |
Fig. 2 Same as Fig. 1 but for the H band (1.47–1.80 μm). |
| In the text | |
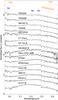 |
Fig. 3 Same as Fig. 1 but for the K band (1.955–2.45 μm). |
| In the text | |
|
Fig. 4 Comparison of the J band SINFONI spectra (red) of 2M0141 (L0), OTS44 (M9.5), and KPNO Tau 4 (M9.5) to R ~ 2000 templates (black) of M9.5–L1 field dwarfs (BRI B0021-0214, C05; 2M0345, ML03; 2MASS J14392836+1929149, C05) classified in the optical, and to the spectrum of a very late type giant (IO Virginis, R09). The flux ratio inside the gray zones (a) and (b) defines the Na index defined by A07 and used in part 3.1.2. The flux ratio of gray zones (c) and (d) defined by G03 measures the depth of the water band longward of 1.3 μm. It can be used to classify young M dwarfs but appears slightly age-dependent at the M–L transition. |
| In the text | |
|
Fig. 5 Same as Fig. 4 for the H and K bands. Flux ratio of the (e) and (f) zones, and of the (g) and (h) zones define the spectral indices H2O–1.5 μm and H2O 2 used in Fig. 10. They vary only slightly with age from 1 Myr and can be used to confirm the spectral type of our targets. |
| In the text | |
|
Fig. 6 J band spectrum of the companion to GSC 08047-00232 (gray) compared to the spectrum of the young L0 dwarf 2MASS J01415823-4633574 (Kirkpatrick et al. 2006), of the old field L2 dwarf 2MASS J0015448+351603 (Kirkpatrick et al. 2000), and of the young M9.5 companion USco CTIO 108B (Béjar et al. 2008). |
| In the text | |
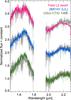 |
Fig. 7 Same as Fig. 6 but for the H + K band. |
| In the text | |
|
Fig. 8 J band spectra of TWA 22A and B, and TWA 22AB compared to young SpecX spectra of young M5−M6 (Allers et al. 2010) and old field M5–M6 dwarfs (Cushing et al. 2005). |
| In the text | |
|
Fig. 9 Same as Fig. 8 but for the H + K band. We also add here the spectrum of the M5.5 dwarf AB Dor C Close et al. (2007), which is currently estimated to be 50–150 Myr old (Close et al. 2005; Nielsen et al. 2005; Luhman et al. 2005c; Boccaletti et al. 2008). |
| In the text | |
|
Fig. 10 Spectral indices used for the classification and age estimation computed on SINFONI spectra of dwarfs classified in the optical (orange triangles) and in the NIR (filled orange triangles), on medium-resolution spectra of young dwarfs classified in the optical (red filled squares; the references associated to the spectra are given in Sect. 3.1.2), and on field dwarfs spectra from the IRTF library (filled blue dots; Cushing et al. 2005; Rayner et al. 2009). We also overlaid the indices’ values for the young late dwarfs found and classified by Lodieu et al. (2008) (violet stars) and our proposed alternative classification using the method described in Sect. 3.1.2 (filled green inverted triangles; see Appendix B). |
| In the text | |
|
Fig. 11 Equivalent widths of gravity sensitive lines of Na I (1.138 μm) and K I (1.169 μm, 1.177 μm, 1.243 μm, 1.253 μm) computed on the SINFONI spectra and on reference spectra (see Fig. 10 for details). Spectra of objects not reported in this plot suffered from a S/N that is too low or from artefacts that prevented the EW from being computed. |
| In the text | |
|
Fig. 12 Best matched synthetic spectra from the BT-SETTL10 (green line), the DRIFT-PHOENIX (red line), and the BT-SETTL12 (pink line) libraries to J band spectra of the SINFONI spectral library (black line). The spectrum of DH Tau B was dereddened by AV = 1.16 mag. The corresponding atmospheric parameters are reported in each panel. 2900/4.5/0.0 corresponds to Teff = 2900 K, log g = 4.5 dex, and M/H = 0.0 dex. |
| In the text | |
|
Fig. 13 Same as Fig. 12 but for the H + K band. Alternative fitting solutions are overlaid in blue and are shifted for clarity (+0.5 in normalized flux unit). |
| In the text | |
|
Fig. 14 Same as Fig. 12 but for cooler objects. The spectrum of Cha1109 was dereddened by AV = 1.1 mag. Alternative fitting solutions are overlaid in blue (shifted for clarity by −0.3 to −0.4 in normalized flux unit). |
| In the text | |
|
Fig. 15 Same as Fig. 13 but for cooler objects. Alternative fitting solutions are overlaid in blue and are shifted for clarity (+0.5 to +0.7 in normalized flux unit). |
| In the text | |
|
Fig. 16 Spectroscopic effective temperatures of field objects (squares) and young objects (dots) compared to those derived from Teff vs spectral type conversion scales valid for old field dwarfs (Stephens et al. 2009, black line) and young objects (dashed and/or dotted lines; Luhman et al. 2003b; Briceño et al. 2002; Luhman et al. 2004, 2008). The spectroscopic temperatures were found comparing the NIR spectra (IRTF, NIRSPEC, SINFONI) to synthetic spectra of the DRIFT-PHOENIX and BT-SETTL libraries (filled symbols), or fitting spectral energy distributions built from the typical colors of young objects (open circles; Luhman et al. 2010) or from the photometry of field dwarfs (open triangles; Patten et al. 2006). |
| In the text | |
|
Fig. 17 Comparison of the SED (filled circles) of several young M9.5–L0 dwarfs with best-fit DRIFT-PHOENIX (red), BT-SETTL10 (green), and BT-SETTL12 (magenta) spectra. The SED of Cha1109 is de-reddened by AV = 1.1 mag. The typical photometry of M9.5 (for Cha1109, OTS 44, and KPNO Tau 4) and L0 dwarfs (for AB Pic b) is overlaid (triangles) along with the corresponding fitting solution found using the BT-SETTL10 grid (light blue). |
| In the text | |
|
Fig. 18 Normalized optical spectra of 2M0141, KPNO Tau 4, Cha1109, OTS 44, and USCO CTIO 108B compared to the best-fitting BT-SETTL10 (green; left), DRIFT-PHOENIX (red; middle), and BT-SETTL12 (magenta; right) spectra found in the NIR. The spectrum of Cha1109 is de-redenned by AV = 1.1 mag. Synthetic spectra at the temperature predicted by conversion scales are overlaid in blue-green. We also show the alternative fitting solution found for 2M0141 using BT-SETTL10 spectra (blue). |
| In the text | |
|
Fig. 19 0.6–2.5 μm spectra of 2M0141, and KPNO Tau 4 normalized over the considered wavelength range and compared to best-fit BT-SETTL10 (green line; shifted by +0.5 normalized flux unit) and DRIFT-PHOENIX (red; shifted by −0.5 normalized flux unit) spectra. A spectrum at Teff corresponding to predictions from conversion scales ang log g = 3.5 dex (gray-blue) is overlaid for comparison. |
| In the text | |
Current usage metrics show cumulative count of Article Views (full-text article views including HTML views, PDF and ePub downloads, according to the available data) and Abstracts Views on Vision4Press platform.
Data correspond to usage on the plateform after 2015. The current usage metrics is available 48-96 hours after online publication and is updated daily on week days.
Initial download of the metrics may take a while.