| Issue |
A&A
Volume 560, December 2013
|
|
|---|---|---|
| Article Number | A22 | |
| Number of page(s) | 8 | |
| Section | Galactic structure, stellar clusters and populations | |
| DOI | https://doi.org/10.1051/0004-6361/201322670 | |
| Published online | 29 November 2013 | |
Anchors for the cosmic distance scale: the Cepheids U Sagittarii, CF Cassiopeiae, and CEab Cassiopeiae
1 Saint Mary’s University, Halifax, Nova Scotia, Canada
2 Mount Saint Vincent University, Halifax, Nova Scotia, Canada
3 European Southern Observatory, Av. Alonso de Cordova, 3107, 19001 Casilla, Santiago, Chile
4 Instituto de Astronomía, Universidad Católica del Norte, Av. Angamos 0610, 1270709 Antofagasta, Chile
5 Departamento de Astronomia, Universidade Federal do Rio Grande do Sul, Av. Bento Gonalves 9500, 91501-970 Porto Alegre, RS, Brazil
6 Sternberg Astronomical Institute, Moscow M. V. Lomonosov State University, 119992 Moscow, Russia
7 Isaac Newton Institute of Chile, Moscow Branch, Universitetskij Pr. 13, 119992 Moscow, Russia
8 Dominion Astrophysical Observatory, Victoria, British Columbia, Canada
9 Departamento de Astronomía, Universidad de Concepción, 160 Casilla, Concepción, Chile
10 Departamento de Física y Astronomía, Facultad de Ciencias, Universidad de Valparaíso, Av. Gran Bretaña 1111, 5030 Casilla, Valparaíso, Chile
11 Astronomical Observatory, Odessa National University, Odessa, Ukraine
12 Isaac Newton Institute of Chile, Odessa Branch, T. G. Shevkenko Park, 65014 Odessa, Ukraine
13 Las Campanas Observatory, Carnegie Institution of Washington, Colina el Pino, 601 Casilla, La Serena, Chile
Received: 14 September 2013
Accepted: 2 November 2013
Abstract
New and existing X-ray, UBVJHKsW(1 − 4), and spectroscopic observations were analyzed to constrain fundamental parameters for M 25, NGC 7790, and dust along their sight-lines. The star clusters are of particular importance because they host the classical Cepheids U Sgr, CF Cas, and the visual binary Cepheids CEa and CEb Cas. Precise results from the multiband analysis, in tandem with a comprehensive determination of the Cepheids’ period evolution (dP/dt) from ~140 years of observations, helped to resolve concerns raised regarding the clusters and their key Cepheid constituents. Specifically, the distances derived for members of M 25 and NGC 7790 are 630 ± 25 pc and 3.40 ± 0.15 kpc, respectively.
Key words: stars: variables: Cepheids / Hertzsprung-Russell and C-M diagrams
© ESO, 2013
1. Introduction
The latest suite of cosmological parameters deduced from the Planck satellite has renewed concerns regarding the Cepheid distance scale and the standard ΛCDM model (e.g., Neilson et al. 2013, see also Kroupa et al. 2012 and Peebles 2013). The Hubble constant cited by the Planck Collaboration (2013) differs by ~5% from that determined by the SH0ES and Carnegie Hubble projects (Riess et al. 2011; Freedman et al. 2012), whereby the latter efforts rely partly on Cepheids for determining H0 (see also Tammann & Reindl 2013, and references therein). The discrepancy is sufficient to hinder efforts to constrain the nature of dark energy (for which σw ~ 2σH0, Macri & Riess 2009), and could be linked to a systematic offset in the Cepheid calibration, or unreliable photometry for remote extragalactic Cepheids owing to crowding effects (Mochejska et al. 2004; Majaess 2010, 2011a, see also Table 2 in Riess et al. 2011). Research continues on the aforementioned topics irrespective of the discrepancy, namely to resolve the putative degeneracy between the impact of crowding and metallicity on Cepheid parameters (Majaess et al. 2011a, 2013a; Chavez et al. 2012, and references therein), and to strengthen the Galactic Cepheid calibration (e.g., Majaess et al. 2012a; Anderson et al. 2013). That calibration is likewise important for defining the metallicity gradient of the Milky Way (Luck et al. 2011), benchmarking standard candles (Matsunaga 2012; Kudritzki et al. 2012), and constraining the behavior of intermediate mass stars (Neilson et al. 2012; Bono et al. 2013, and references therein). Indeed, the Galactic calibration may serve as the basis for the cosmic distance scale in concert with LMC (Soszyñski et al. 2008) and NGC 42581 Cepheids.
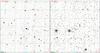 |
Fig. 1 XMM-Newton X-ray data (ObsID:040472) were used to help segregate fainter cluster members from field stars, thus facilitating the application of an isochrone and reducing uncertainties associated with the cluster distance derived (e.g., Majaess et al. 2012a; Carraro et al. 2013). Left panel: a cropped XMM-Newton image of the field encompassing M 25, while a near-infrared 2MASS J-band image is shown on the right. Red circles are 2MASS (AAA) sources that exhibit X-ray emission. |
Improving the Cepheid calibration by deriving solid parameters for cluster Cepheids using X-ray, UBVJHKsW(1 − 4), and spectroscopic observations is the principal impetus of this analysis. In particular, the star clusters M 25 and NGC 7790 are examined given they host the classical Cepheids U Sgr, CF Cas, and the visual binary Cepheids CEab Cas (Berdnikov 1990; Szabados 2003, and references therein). P. Doig suggested that U Sgr may be a member2 of M 25 (Sandage 1960), and O. Eggen was among the first to propose a Cepheid connection with NGC 7790 (Sandage 1958). Yet generations after those discoveries ambiguities linger regarding the parameters for the host clusters (e.g., Matthews et al. 1995; Hoyle et al. 2003, and discussion therein). Indeed, the uncertainty led Turner (2010) to bypass NGC 7790 when constructing the 2010 iteration of the Galactic Cepheid calibration. Analyses of M 25 are complicated by systematic offsets between relatively shallow observations published for the cluster, as well as its projection upon a rich background field.
New and existing multiband data are analyzed here with the aim of mitigating uncertainties tied to M 25, NGC 7790, their key constituent Cepheids, and invariably the important Galactic Cepheid calibration (Joner & Laney 2012; Monson et al. 2012; Ngeow 2012; Groenewegen 2013).
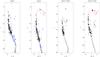 |
Fig. 2 Optical and near-infrared color–magnitude diagrams for M 25 and NGC 7790. For M 25 the blue and black filled circles are X-ray and bright U-band selected sources, respectively. Color cuts were made to reduce field star contamination. For NGC 7790 the black filled circles are 2MASS (near-infrared) and ARO (optical) field decontaminated photometry (Bonatto & Bica 2011, and references therein). Black dots in the color–magnitude diagrams represent the intrinsic relation (Majaess et al. 2011b) shifted to match the observations. Optical photometry for the cluster Cepheids are conveyed by circled dots (Berdnikov et al. 2000; Berdnikov 2008). |
2. Analysis
2.1. M 25
Distinguishing cluster members from field stars is a principal challenge associated with establishing reliable parameters for open clusters. Late-type cluster dwarfs can prove difficult to distinguish from field stars that are of comparable brightness, hence the pertinence of X-ray data. Majaess et al. (2012a) used X-ray observations to identify low-mass stars associated with the Cepheid SU Cas, and its host cluster Alessi 95 (Turner et al. 2012). X-ray emitting stars associated with relatively young Cepheids (τ ~ 100 Myr, Turner 2012) are typically cooler than F5-F8 V, where convection becomes an important mode of energy transport in the stellar atmosphere. The X-rays stem from a hot coronal plasma driven by convection and the magnetic dynamo. X-ray emission drops with stellar age, since the angular momentum inherited from the accretion process dissipates (i.e., via stellar winds and magnetic braking) and the dynamo weakens. Consequently, relatively young stars associated with classical Cepheids can be separated from field stars along the same sight-line, since the latter are typically old slow-rotators that are X-ray quiet. X-rays are also useful for identifying companions to massive cluster stars (Evans 2011; Majaess et al. 2012a).
XMM-Newton X-ray images (ObsID:040472, PI: Motch) of the field were examined to identify fainter cluster members (Fig. 1). Sources were identified using SExtractor (Bertin & Arnouts 1996). The elongation option was selected since sources on the XMM-Newton image were asymmetric. A 2.5σ criterion was chosen to reduce spurious detections. The X-ray targets were subsequently matched with newly acquired UBV photometry and 2MASS near-infrared (AAA) photometry, and the resulting sample is displayed in Figs. 1 and 2. The new optical CCD photometry was obtained from the 1 m Henrietta Swope telescope (Las Campanas, Chile). The data were reduced following Carraro (2009). Bright saturated stars were swapped with unpublished photoelectric photometry obtained from Las Campanas using the 0.6 m Helen Sawyer Hogg telescope. Deeper near-infrared photometry was also obtained via the Osiris instrument on the 4 m SOAR telescope (Cerro Pachón, Chile). The Stetson (1987) DAOPHOT routines were employed to extract photometry from the images since the sources exhibited satisfactory stellar PSFs (point spread functions). The deeper near-infrared data revealed numerous field stars occupying the region of the color–magnitude diagram associated with cluster M-dwarfs. 2MASS observations constitute the bulk of the data displayed in the near-infrared color–magnitude diagram for M 25 (Fig. 2), with photometry for several faint X-ray sources supplied by the SOAR observations. Deeper X-ray data are needed to fully exploit the SOAR data.
Field contamination was likewise minimized by selecting stars that exhibit bright U-band photometry. Bright (U) early-type stars are comparatively rare in a field owing to a steep initial mass function and relatively short lifetimes. Moreover, background B-stars are faint given M 25 is comparatively nearby. Most field stars that remained after imposing the U-band limit did not traverse the cluster sequence. The combined X-ray and U-band selected stars populate the bulk of the cluster sequence (Fig. 2), thus facilitating the application of an isochrone. Fewer X-ray stars were identified in the optical dataset relative to the near-infrared owing to the reduced field of view of the former (by contrast 2MASS is all-sky).
The optical color excess was determined via the UBV color–color diagram, and yielded EB − V = 0.513 ± 0.034σ (Fig. 4). The intrinsic UBV color–color relation of Turner (1989, and references therein) was used, in tandem with the reddening line for the broader field determined by Turner (1976). B-stars were solely considered in the fit to avoid the Hyades anomaly (Turner 1979). To within the uncertainties the cluster reddening matches the estimate cited for U Sgr by Turner (2010, EB − V = 0.50 ± 0.03. However, the cluster reddening is larger than the average color-excess cited for U Sgr by Laney & Caldwell (2007, and references therein, EB − V = 0.42 ± 0.02. The source of the reddening discrepancy is unknown, and differential extinction cannot be invoked since B-stars encompassing U Sgr share the mean cluster reddening.
The near-infrared reddening for M 25 was inferred using spectral types cited for bright B-stars by Wampler et al. (1961) and Skiff (2013)3, in conjunction with JHKs intrinsic colors from Straižys & Lazauskaitė (2009). The resulting mean color excess is E(J–H) = 0.165 ± 0.032σ. The Wampler et al. (1961) spectral types are offset in temperature and luminosity class from those established by Feast (1957) and Wallerstein (1957). The latter, although comprehensive, often cite dwarf classifications for evolved B-stars. The evolved luminosity class determinations of Wampler et al. (1961) are in better agreement with the color–magnitude diagram (Fig. 2, see also Houk & Cowley 1975).
With the reddening established, the isochrone and the intrinsic Majaess et al. (2011b) relation were shifted along the ordinate of the color–magnitude diagram to match the observations. The near-infrared empirical calibration derived by Majaess et al. (2011b) was used to establish the cluster distance. That calibration was constructed from revised Hipparcos parallaxes for nearby stars (van Leeuwen 2007), and yields distances to seven benchmark clusters (e.g., α Per) that are consistent with the van Leeuwen (2009)4 Hipparcos determinations. The relation is not tied to the Pleiades cluster, an important consideration granted a dispute continues concerning its parameters (van Leeuwen 2009; Majaess et al. 2011b; de Grijs 2012, and references therein). A comprehensive analysis of B-stars in M 25 by Luck et al. (2000) demonstrated that cluster stars exhibit near solar abundances. U Sgr likewise displays near solar abundances (Laney & Caldwell 2007; Klagyivik & Szabados 2009, and references therein). Metallicity effects in the near-infrared are negligible in this instance (Alonso et al. 1996; Majaess et al. 2011b).
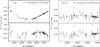 |
Fig. 3 Period evolution (O–C) diagrams for U Sgr (dP/dt = + 0.073 s yr-1) and CF Cas (dP/dt = −0.072 s yr-1) facilitate the selection of an isochrone (Fig. 2). The new results imply that U Sgr is traversing the instability strip for the third time and is evolving toward the cool-end of the instability strip, whereas CF Cas may be a second crosser venturing toward hotter temperatures (the scatter is admittedly large). The lower panels display the residuals from the polynomial fits applied. Sterken (2005) relays comprehensive information regarding period evolution (O–C) diagrams. |
The resulting distance and age for M 25 are d = 630 ± 25 pc and log τ = 7.88 ± 0.10, respectively. The parameters were inferred from the near-infrared (the calibration) and optical data, respectively. The latter dataset exhibits more reliable photometry for bright cluster members. The distance determined for M 25 agrees with a preliminary estimate deduced by Turner (2010) (see also Kharchenko et al. 2005), yet is larger than the distance established for U Sgr from the infrared surface brightness technique (Storm et al. 2011, d = 579 ± 6 pc). The age was ascertained by matching the isochrone to evolved blue and red cluster stars, whereby a solar isochrone was selected (Padova, Girardi et al. 2002; Bonatto et al. 2004). The period evolution of U Sgr (dP/dt = + 0.073 ± 0.010 s yr-1, Fig. 3) was likewise considered in the aforementioned determination, since it implies that the Cepheid lies in the third crossing of the instability strip according to the Turner et al. (2006) framework (see also Szabados 1983; Becker 1985; Neilson et al. 2012). The duration of each instability strip crossing differs, whereby the first traversal is shortest (Becker 1985). The positive rate (dP/dt) implies U Sgr is evolving toward the cool side of the instability strip, provided the period evolution is primarily tracking density changes (Eddington 1918). However, recent and precise observations exhibit a superposed variation (Fig. 3). The aforementioned conclusions stem from a comprehensive analysis featuring more than 100 years of U Sgr observations5 (Fig. 3).
A distance based on the optical measurements was evaluated with the aim of supporting (to first-order) the near-infrared solution. The analysis yielded d = 650 pc, but the result is tied to the canonical extinction law (RV = AV/EB − V ~ 3.1, Turner 1976). The ratio varies throughout the Galaxy, e.g., Carraro et al. (2013) obtain RV ≃ 3.85 for the cluster Westerlund 2, while Nataf et al. (2013) derived RV = 2.5 for the Galactic bulge. Majaess et al. (in prep.) mapped RV variations throughout the region and determined that RV ~ 3.25 (Fig. 5).6 That implies an optical-based distance for M 25 (d = 640 pc) that matches the near-infrared solution. Admittedly, obtaining new spectra to confirm existing classifications is desirable, and would allow for a separate estimate of RV (e.g., Wegner 2002).
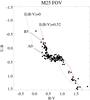 |
Fig. 4 New observations for stars in the field of M 25 that exhibit bright U-band photometry. The intrinsic relation and reddening law by Turner (1989, and references therein) and Turner (1976) were adopted, respectively. A mismatch to the intrinsic relation appears just beyond A0 and may be indicative of a standardization offset or the Hyades anomaly. A mean cluster reddening was determined (EB − V = 0.513 ± 0.034σ) from the B-stars to avoid the aforementioned problem (Turner 1979). |
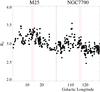 |
Fig. 5 Estimated extinction law (RV = AV/EB − V) variations binned as a function of Galactic longitude (Majaess et al., in prep.). The broader sight-lines encompassing M 25 (ℓ ~ 14°) and NGC 7790 (ℓ ~ 117°) exhibit higher and marginally lower values of RV than the canonical extinction law (RV ~ 3.1, Turner 1976), respectively. |
2.2. NGC 7790
Reddening estimates for NGC 7790 exhibit a sizable spread, and it was speculated that dust along the sight-line is peculiar (Hoyle et al. 2003, their Fig. 14 and references therein). However, the UBV color–color diagram constructed by Mateo & Madore (1988) does not support that finding. It is unclear whether problems endemic to standardizing U-band photometry are the source of the discrepancy (Cousins & Caldwell 2001; Massey 2002; Turner et al. 2011), or a Hyades-like anomaly is present.
New spectroscopic observations were acquired to constrain the reddening. Six cluster B-stars were observed using the 1.8 m Plaskett telescope (Dominion Astrophysical Observatory (DAO), Victoria). The spectra were reduced via IRAF and are shown in Fig. 6. Spectral classifications and coordinates for the sample are listed in Table 1, the former being derived using the precepts highlighted by Gray & Corbally (2009). The results are generally confirmed by fitting synthetic spectra to the observations (see Sect. 2.2.1, and Moni Bidin et al. 2007, 2012).
Four additional B-stars featured in the Skiff (2013) catalog were included to evaluate a mean color-excess of E(J–H) = 0.14 ± 0.04σ and EB − V = 0.52 ± 0.05σ. The former was computed using 2MASS photometry and near-infrared intrinsic colors from Straižys & Lazauskaitė (2009), whereas the latter stemmed from new ARO7BV photometry in conjunction with the intrinsic colors of Turner (1989, and references therein). To within the uncertainties the reddening for NGC 7790 is consistent with estimates cited previously for CF Cas (Laney & Caldwell 2007; Fouqué et al. 2007, and references therein, EB − V = 0.553).
The optical CCD observations obtained at the ARO were standardized (Fig. 2) to unpublished photoelectric photometry obtained at Kitt Peak during August 1984 (the 0.9 m and 1.3 m telescopes were used in tandem with a 1P21 system). The ARO photometry was generated using DAOPHOT, and a search for variability was carried out via the VaST8 routine (Sokolovsky & Lebedev 2005). No cluster variables were detected to sufficient precision other than the Cepheids. New JHKs photometry was obtained from the Observatoire Mont-Mégantic (Artigau et al. 2010) for the field hosting NGC 7790. However, the photometry could not be placed on the 2MASS system since nonlinearities appeared near the faint end of the standardization, which rendered the zero-point uncertain for any key data beyond the 2MASS limits. Those observations were thus omitted from the analysis.
NGC 7790 is too distant to exhibit reliable proper motion or X-ray data that could facilitate the identification of cluster members. A field star decontamination algorithm was therefore employed (Bonatto & Bica 2011, and references therein), whereby the morphology displayed in the color–magnitude diagram by a field sample was removed from a diagram featuring field and cluster stars (of equal area). The results for NGC 7790 are shown in Fig. 2.
The distance to NGC 7790 was established in the manner described for M 25 (Sect. 2.1). The near-infrared distance is d = 3.40 ± 0.15 kpc, which fits the solution based on optical measurements (Fig. 2). The cluster distance and reddening are larger and marginally smaller, respectively, than estimates recently inferred from MegaCam images (Davidge 2012, d ~ 3176 pc and EB − V = 0.56, see also his Table 2). Kharchenko et al. (2005) advocated cluster parameters of d = 2944 pc and E(B − V) = 0.53. The cluster age (log τ = 8.0 ± 0.1) was inferred by matching a solar isochrone to precise optical photometry for evolved members (the authors are unaware of complete near-infrared data for CEab Cas). Here too an analysis of the Cepheids’ period evolution was considered to facilitate the age determination. An examination of over 100 years of CF Cas observations implies that the Cepheid is in the second crossing (dP/dt = −0.0721 ± 0.014 s yr-1), given its low rate of period change (the second crossing is generally longest, Becker 1985). CEa and CEb Cas were analyzed by Berdnikov (1990), and the objects may be third crossers. Photometry for the Cepheids (Berdnikov et al. 2000; Berdnikov 2008) support the aforementioned conclusions (i.e., CEa Cas is brighter than CF Cas), although uncertainties associated with the period change and crossing mode determined render the conclusion tentative. However, the period analysis certainly indicates that none of the Cepheids are first crossers (the crossing mode with the shortest duration, i.e., rapid period change).
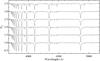 |
Fig. 6 New DAO spectra for B-stars in NGC 7790 were used in determining the mean reddening (EB − V = 0.52 ± 0.05σ). The spectra are listed in order of increasing ID. Pertinent details regarding the stars are highlighted in Table 1. |
Spectroscopically observed stars encompassing NGC 7790.
Cluster parameters.
2.2.1. Synthetic spectra fits
Fundamental parameters for the DAO target stars (Teff, log g, Vsini) were estimated by fitting the Balmer and helium lines with synthetic spectra. Solar metallicity was assumed because new abundance estimates derived for this study imply that CF Cas, CEa Cas, and CEb Cas have [ Fe/H ] = −0.08, −0.03, and −0.01 (σ = 0.15 dex), respectively (Kovtyukh 2013, unpublished). A grid of model spectra (Teff = 12 000–32 000 K and log g = 3.5–5.0 dex) was generated via Lemke’s version9 of the LINFOR program (developed originally by Holweger, Steffen, and Steenbock at Kiel University). Local thermodynamic equilibrium (LTE) model atmospheres were computed with ATLAS9 (Kurucz 1993). Extensive details about the synthetic spectra fitting procedure are found in Moni Bidin et al. (2012).
The stellar parameters were derived via a χ2 fit, as implemented in the fitprof21 code developed by Bergeron et al. (1992) and Saffer et al. (1994), and subsequently modified by Napiwotzki et al. (1999). The routine returns formal statistical uncertainties and neglects uncertainties stemming from the normalization procedure, sky subtraction, and flat-fielding. Therefore the uncertainties cited are likely underestimated (Table 1). Balmer lines from Hβ to H12 were fitted simultaneously, with the exception of Hϵ (when blended with the Ca II H line). The derived values of Teff and log g are most sensitive to the hydrogen lines. Four weak helium lines (λ4026, 4388, 4471, and 4922 Å) were also matched, and those features generate a better estimate for Vsini than broad Balmer lines. Vsini was an input quantity that was iteratively tweaked until a minimum χ2 was achieved. Admittedly, Vsini is not precisely determined at the resolution of the spectra obtained. Numerous factors may alter the effective line width (e.g., instrumental profile, variations of the true resolution owing to seeing), although rapid rotation endemic to such hot targets is the dominant line-broadening effect. A precise Vsini estimate would likewise require a zero-point calibration to standard stars (e.g., Recio Blanco et al. 2004; Monaco et al. 2011). The results presented in Table 1 are thus deemed suggestive and may be affected by systematic offsets (e.g., systematic offsets exist between parameters inferred from NLTE and LTE models, Young & Short, in prep.).
Results inferred from the synthetic spectra are consistent with the spectral types assigned from a visual inspection (to within the expected uncertainties), thus supporting the cluster parameters deduced.
3. Conclusion
A new multiband X-ray, UBVJHKsW(1 − 4), and spectroscopic investigation was carried out to establish precise cluster parameters (Table 1). Parameters tabulated for M 25 are d = 630 ± 25 pc and log τ = 7.88 ± 0.10, as deduced from isochrone fits to color–magnitude diagrams populated by X-ray and U-band selected members (Figs. 1, 2). The age is partly associated with a comprehensive period-change analysis for U Sgr (Fig. 3). The period evolution of U Sgr (dP/dt = + 0.073 s yr-1) implies the Cepheid is in the third crossing according to the Turner et al. (2006) framework, and is evolving toward cooler temperatures. Dust along the line of sight to M 25 is characterized by color excesses of E(J − H) = 0.165 ± 0.032σ and EB − V = 0.513 ± 0.034σ (Fig. 4), the former being tied to the Wampler et al. (1961) spectral types. The Wampler et al. (1961) spectral types are offset from previously published designations, but they match the evolved (IV-III) luminosity classifications expected for late-to-mid B-stars associated with intermediate-period Cepheids (Fig. 2). The Majaess et al. (in prep.) analysis implies that dust along the broader sight-line encompassing M 25 follows a marginally higher extinction law (RV ≃ 3.25). Adopting that value reduces the offset between the near-infrared and optical distance solutions for the cluster.
Parameters determined for NGC 7790 are d = 3.40 ± 0.15 kpc and log τ = 8.0 ± 0.1, where the results rely partly on the application of a field decontamination algorithm (Bonatto & Bica 2011, and references therein) since X-ray data are unavailable. The period evolution of the cluster’s constituent Cepheids CF Cas and CEab Cas (Berdnikov 1990) were considered when deriving the cluster age. An elaborate period analysis for CF Cas (dP/dt = −0.0721 s yr-1, Fig. 3) indicates that it is a second crosser evolving toward the hot end of the instability strip. It was previously suggested that dust along the line of sight to NGC 7790 is anomalous, as implied by UBV color–color diagrams constructed from various published datasets (Hoyle et al. 2003, their Fig. 14 and references therein). However, an inspection of the UBV color–color diagram assembled by Mateo & Madore (1988) for cluster stars does not support that finding. Nonetheless, the impact of inhomogeneous or stellar parameter sensitive U-band photometry was reduced by using unpublished UBV photoelectric photometry, near-infrared photometry, and new DAO spectroscopic observations for several B-stars (Fig. 6). The observations imply color excesses of E(J–H) = 0.14 ± 0.04σ and EB − V = 0.52 ± 0.05σ, and rely on spectroscopic classifications assigned by visual inspection that were generally confirmed via synthetic spectral fits (Sect. 2.2.1, Table 1). The RV for the broader region encompassing NGC 7790 is marginally lower than the canonical RV ~ 3.1 extinction law (Fig. 5).
Lastly, the Galactic Wesenheit (VIc) function based on the Turner (2010) and Benedict et al. (2007) calibrators was updated using the suite of new parameters established here and elsewhere (e.g., V340 Nor and QZ Nor, Majaess et al. 2013b). The resulting function is described by  (1)where P0 is the pulsation period (fundamental mode), WVIc,0 is the absolute Wesenheit magnitude, and the apparent Wesenheit magnitude is WVIc = V − 2.55 × (V − Ic). The slope of the Galactic WVIc function (Eq. (1)) matches that derived for LMC and SMC Cepheids (Ngeow et al. 2009), but is inconsistent with the slope established for distant solar extragalactic Cepheids associated with known supernova-host galaxies (Majaess 2010; Riess et al. 2009). Continued research aimed at reducing uncertainties associated with the Cepheid calibration (e.g., Benedict et al. 2007; Gieren et al. 2013) and the impact of crowding on remote extragalactic Cepheid photometry may eventually help identify the source behind discrepant values of H0 cited in the literature (e.g., Riess et al. 2011; Freedman et al. 2012; Tammann & Reindl 2013; Planck Collaboration 2013).
The Humphreys et al. (2013) maser distance for NGC 4258 is ~ 5% larger than the original Herrnstein et al. (1999) result. The new distance can be reconciled with the Cepheid photometry for NGC 4258 (Macri et al. 2006) if the crowding bias endemic to the latter is considered (Fig. 4 in Majaess et al. 2009, and see also Bono et al. 2008, 2010; Majaess 2010; Bresolin 2011).
Anderson et al. (2013) hinted that Y Sgr could likewise be a member of M 25.
Catalogue of stellar spectral classifications.
van Leeuwen (2009) suggests that Hipparcos parallaxes and the Hyades anomaly (e.g., see Sect. 2 of Turner 1979; and Fig. 29 of van Leeuwen 2009) imply that traditional main-sequence fitting is flawed, as there exists an additional parameter affecting the luminosity (i.e., age). Majaess et al. (2011b) provide an alternate interpretation to consider.
An elaborate listing of references tied to the O–C analyses (Fig. 3) is obtainable from the coauthor L. Berdnikov.
The Majaess et al. (in prep.) analysis used mid-infrared WISE data (Wright et al. 2010) to determine RV via the color-extrapolation method.
The Abbey Ridge observatory (ARO) is a remotely operated facility hosting a 0.3 m telescope and is engaged in supernova, variable star, and cluster research (e.g., Lane & Gray 2011; Majaess et al. 2012b).
Variability Search Toolkit (VaST): http://scan.sai.msu.ru/vast/
Acknowledgments
D.M. is grateful to the following individuals and consortia whose efforts, advice, or encouragement enabled the research: 2MASS (R. Cutri), HIP (F. van Leeuwen), B. Skiff, WEBDA (E. Paunzen, J.-C. Mermilliod), DAML02 (W. Dias), OMM (R. LeMontagne, E. Artigau), WISE, J. Wampler, DAOPHOT (P. Stetson), VaST (K. Sokolovsky), VVV (D. Minniti), CDS (F. Ochsenbein, T. Boch, P. Fernique), arXiv, and NASA ADS. L.B. thanks the Russian Foundation for Basic Research (project 13-02-00203). W.G. is grateful for support from the BASAL Centro de Astrofísica y Tecnologias Afines (CATA) PFB-06/2007. D.M. and L.B. thank O. J. Knudsen (Aarhus Universitet) for providing access to a publication featuring pertinent U Sgr data (Nielsen A. V., Medd. Romer Observ. Aarhus, 1954, Nr. 24, P.337-350). This publication makes use of data products from the Wide-field Infrared Survey Explorer, which is a joint project of the University of California, Los Angeles, and the Jet Propulsion Laboratory/California Institute of Technology, funded by NASA; observations obtained with XMM-Newton, an ESA science mission with instruments and contributions directly funded by ESA Member States and NASA; observations obtained at the Southern Astrophysical Research (SOAR) telescope (program ID: CN2013A-157), which is a joint project of the Ministério da Ciência, Tecnologia, e Inovação (MCTI) da República Federativa do Brasil, the US National Optical Astronomy Observatory (NOAO), the University of North Carolina at Chapel Hill (UNC), and Michigan State University (MSU).
References
- Alonso, A., Arribas, S., & Martinez-Roger, C. 1996, A&A, 313, 873 [NASA ADS] [Google Scholar]
- Anderson, R. I., Eyer, L., & Mowlavi, N. 2013, MNRAS, 434, 2238 [NASA ADS] [CrossRef] [Google Scholar]
- Artigau, É., Lamontagne, R., Doyon, R., & Malo, L. 2010, Proc. SPIE, 7737 [Google Scholar]
- Becker, S. 1985, IAU Colloq. 82: Cepheids: Theory and Observation (New York: Cambridge University press), 104 [Google Scholar]
- Benedict, G. F., McArthur, B. E., Feast, M. W., et al. 2007, AJ, 133, 1810 [NASA ADS] [CrossRef] [Google Scholar]
- Berdnikov, L. N. 1990, AZh, 67, 798 [NASA ADS] [Google Scholar]
- Berdnikov, L. N. 2008, VizieR Online Data Catalog, II/285 [Google Scholar]
- Berdnikov, L. N., Dambis, A. K., & Vozyakova, O. V. 2000, A&A, 143, 211 [Google Scholar]
- Bergeron, P., Saffer, R. A., & Liebert, J. 1992, ApJ, 394, 228 [NASA ADS] [CrossRef] [Google Scholar]
- Bertin, E., & Arnouts, S. 1996, A&AS, 117, 393 [NASA ADS] [CrossRef] [EDP Sciences] [Google Scholar]
- Bonatto, C., & Bica, E. 2011, MNRAS, 415, 2827 [NASA ADS] [CrossRef] [Google Scholar]
- Bonatto, C., Bica, E., & Girardi, L. 2004, A&A, 415, 571 [NASA ADS] [CrossRef] [EDP Sciences] [Google Scholar]
- Bono, G., Caputo, F., Fiorentino, G., Marconi, M., & Musella, I. 2008, ApJ, 684, 102 [NASA ADS] [CrossRef] [Google Scholar]
- Bono, G., Caputo, F., Marconi, M., & Musella, I. 2010, ApJ, 715, 277 [NASA ADS] [CrossRef] [Google Scholar]
- Bono, G., Inno, L., Matsunaga, N., et al. 2013, IAU Symp., 289, 116 [NASA ADS] [Google Scholar]
- Bresolin, F. 2011, ApJ, 729, 56 [NASA ADS] [CrossRef] [Google Scholar]
- Carraro, G. 2009, AJ, 137, 3809 [NASA ADS] [CrossRef] [Google Scholar]
- Carraro, G., Turner, D., Majaess, D., & Baume, G. 2013, A&A, 555, A50 [NASA ADS] [CrossRef] [EDP Sciences] [Google Scholar]
- Chavez, J. M., Macri, L. M., & Pellerin, A. 2012, AJ, 144, 113 [NASA ADS] [CrossRef] [Google Scholar]
- Cousins, A. W. J., & Caldwell, J. A. R. 2001, MNRAS, 323, 380 [NASA ADS] [CrossRef] [Google Scholar]
- Davidge, T. J. 2012, ApJ, 761, 155 [NASA ADS] [CrossRef] [Google Scholar]
- de Grijs, R. 2012, IAU Symp., 289, 351 [NASA ADS] [CrossRef] [Google Scholar]
- Eddington, A. S. 1918, MNRAS, 79, 2 [NASA ADS] [Google Scholar]
- Evans, N. R. 2011 [arXiv:1112.1046] [Google Scholar]
- Feast, M. W. 1957, MNRAS, 117, 193 [NASA ADS] [Google Scholar]
- Fouqué, P., Arriagada, P., Storm, J., et al. 2007, A&A, 476, 73 [NASA ADS] [CrossRef] [EDP Sciences] [Google Scholar]
- Freedman, W. L., Madore, B. F., Scowcroft, V., et al. 2012, ApJ, 758, 24 [NASA ADS] [CrossRef] [Google Scholar]
- Gieren, W., Storm, J., Nardetto, N., et al. 2013, IAU Symp., 289, 138 [NASA ADS] [Google Scholar]
- Girardi, L., Bertelli, G., Bressan, A., et al. 2002, A&A, 391, 195 [NASA ADS] [CrossRef] [EDP Sciences] [Google Scholar]
- Gray, R. O., & Corbally, C., J. 2009, Stellar Spectral Classification (Princeton University Press) [Google Scholar]
- Groenewegen, M. A. T. 2013, A&A, 550, A70 [NASA ADS] [CrossRef] [EDP Sciences] [Google Scholar]
- Herrnstein, J. R., Moran, J. M., Greenhill, L. J., et al. 1999, Nature, 400, 539 [NASA ADS] [CrossRef] [Google Scholar]
- Houk, N., & Cowley, A. P. 1975, University of Michigan Catalogue of two-dimensional spectral types for the HD stars. Vol. I. Declinations –90 to –53° [Google Scholar]
- Hoyle, F., Shanks, T., & Tanvir, N. R. 2003, MNRAS, 345, 269 [NASA ADS] [CrossRef] [Google Scholar]
- Humphreys, L., Reid, M., Moran, J., Greenhill, L., & Argon, A. 2013, ApJ, accepted [arXiv:1307.6031] [Google Scholar]
- Kharchenko, N. V., Piskunov, A. E., Röser, S., Schilbach, E., & Scholz, R.-D. 2005, A&A, 438, 1163 [NASA ADS] [CrossRef] [EDP Sciences] [MathSciNet] [Google Scholar]
- Klagyivik, P., & Szabados, L. 2009, A&A, 504, 959 [NASA ADS] [CrossRef] [EDP Sciences] [Google Scholar]
- Kroupa, P., Pawlowski, M., & Milgrom, M. 2012, Int. J. Mod. Phys. D, 21, 30003 [NASA ADS] [CrossRef] [Google Scholar]
- Kudritzki, R.-P., Urbaneja, M. A., Gazak, Z., et al. 2012, ApJ, 747, 15 [NASA ADS] [CrossRef] [Google Scholar]
- Kurucz, R. 1993, ATLAS9 Stellar Atmosphere Programs and 2 km s-1 grid, Kurucz CD-ROM No. 13 (Cambridge, Mass.: Smithsonian Astrophysical Observatory) [Google Scholar]
- Joner, M. D., & Laney, C. D. 2012, AAS/Division of Dynamical Astronomy Meeting, 43, #09.02 [Google Scholar]
- Lane, D. J., & Gray, K. A. 2011, Central Bureau Electronic Telegrams, 2618, 1 [NASA ADS] [Google Scholar]
- Laney, C. D., & Caldwell, J. A. R. 2007, MNRAS, 377, 147 [NASA ADS] [CrossRef] [Google Scholar]
- Luck, R. E., Andrievsky, S. M., Kovtyukh, V. V., Korotin, S. A., & Beletsky, Y. V. 2000, A&A, 361, 189 [NASA ADS] [Google Scholar]
- Luck, R. E., Andrievsky, S. M., Kovtyukh, V. V., Gieren, W., & Graczyk, D. 2011, AJ, 142, 51 [NASA ADS] [CrossRef] [Google Scholar]
- Macri, L. M., & Riess, A. G. 2009, AIP Conf. Ser., 1170, 23 [NASA ADS] [CrossRef] [Google Scholar]
- Macri, L. M., Stanek, K. Z., Bersier, D., Greenhill, L. J., & Reid, M. J. 2006, ApJ, 652, 1133 [NASA ADS] [CrossRef] [Google Scholar]
- Majaess, D. 2010, Acta Astron., 60, 121 [NASA ADS] [Google Scholar]
- Majaess, D., Turner, D., & Lane, D. 2009, Acta Astron., 59, 403 [NASA ADS] [Google Scholar]
- Majaess, D., Turner, D., & Gieren, W. 2011a, ApJ, 741, L36 [NASA ADS] [CrossRef] [Google Scholar]
- Majaess, D. J., Turner, D. G., Lane, D. J., & Krajci, T. 2011b, JAAVSO, 39, 219 [Google Scholar]
- Majaess, D., Turner, D. G., Gallo, L., et al. 2012a, ApJ, 753, 144 [NASA ADS] [CrossRef] [Google Scholar]
- Majaess, D., Turner, D., Gieren, W., Balam, D., & Lane, D. 2012b, ApJ, 748, L9 [NASA ADS] [CrossRef] [Google Scholar]
- Majaess, D., Turner, D., Gieren, W., Berdnikov, L., & Lane, D. 2013a, Ap&SS, 344, 381 [NASA ADS] [CrossRef] [Google Scholar]
- Majaess, D., Sturch, L., Moni Bidin, C., et al. 2013b, Ap&SS, 347, 61 [NASA ADS] [CrossRef] [Google Scholar]
- Massey, P. 2002, ApJS, 141, 81 [NASA ADS] [CrossRef] [MathSciNet] [Google Scholar]
- Mateo, M., & Madore, B. 1988, in The Extragalactic Distance Scale (San Francisco, CA: ASP), Proc. ASP, 4, 174 [NASA ADS] [Google Scholar]
- Matthews, J. M., Gieren, W. P., Mermilliod, J.-C., & Welch, D. L. 1995, AJ, 110, 2280 [NASA ADS] [CrossRef] [Google Scholar]
- Matsunaga, N. 2012, Ap&SS, 341, 93 [NASA ADS] [CrossRef] [Google Scholar]
- Monaco, L., Villanova, S., Moni Bidin, C., et al. 2011, A&A, 529, A90 [NASA ADS] [CrossRef] [EDP Sciences] [Google Scholar]
- Moni Bidin, C., Moehler, S., Piotto, G., Momany, Y., & Recio-Blanco, A. 2007, A&A, 474, 505 [NASA ADS] [CrossRef] [EDP Sciences] [Google Scholar]
- Moni Bidin, C., Villanova, S., Piotto, G., et al. 2012, A&A, 547, A109 [NASA ADS] [CrossRef] [EDP Sciences] [Google Scholar]
- Mochejska, B. J., Macri, L. M., Sasselov, D. D., & Stanek, K. Z. 2004, in Variable Stars in the Local Group, IAU Colloq. 193, ASP Conf. Proc., 310, 41 [NASA ADS] [Google Scholar]
- Monson, A. J., Freedman, W. L., Madore, B. F., et al. 2012, ApJ, 759, 146 [NASA ADS] [CrossRef] [Google Scholar]
- Napiwotzki, R., Green, P. J., & Saffer, R. A. 1999, ApJ, 517, 399 [NASA ADS] [CrossRef] [Google Scholar]
- Nataf, D. M., Gould, A., Fouqué, P., et al. 2013, ApJ, 769, 88 [NASA ADS] [CrossRef] [Google Scholar]
- Neilson, H. R., Langer, N., Engle, S. G., Guinan, E., & Izzard, R. 2012, ApJ, 760, L18 [NASA ADS] [CrossRef] [Google Scholar]
- Neilson, H. R., Biesiada, M., Remage Evans, N., et al. 2013 [arXiv:1309.4118] [Google Scholar]
- Ngeow, C.-C. 2012, ApJ, 747, 50 [NASA ADS] [CrossRef] [Google Scholar]
- Ngeow, C.-C., Kanbur, S. M., Neilson, H. R., Nanthakumar, A., & Buonaccorsi, J. 2009, ApJ, 693, 691 [NASA ADS] [CrossRef] [Google Scholar]
- Peebles, P. J. E. 2013 [arXiv:1305.6859] [Google Scholar]
- Planck Collaboration 2013, A&A, submitted [arXiv:1303.5076] [Google Scholar]
- Recio-Blanco, A., Piotto, G., Aparicio, A., & Renzini, A. 2004, A&A, 417, 597 [NASA ADS] [CrossRef] [EDP Sciences] [Google Scholar]
- Riess, A. G., Macri, L., Li, W., et al. 2009, ApJS, 183, 109 [NASA ADS] [CrossRef] [Google Scholar]
- Riess, A. G., Macri, L., Casertano, S., et al. 2011, ApJ, 730, 119 [NASA ADS] [CrossRef] [Google Scholar]
- Saffer, R. A., Bergeron, P., Koester, D., & Liebert, J. 1994, ApJ, 432, 351 [NASA ADS] [CrossRef] [Google Scholar]
- Sandage, A. 1958, ApJ, 128, 150 [NASA ADS] [CrossRef] [Google Scholar]
- Sandage, A. 1960, ApJ, 131, 610 [NASA ADS] [CrossRef] [Google Scholar]
- Skiff, B., 2013, VizieR On-line Data Catalog: B/mk [Google Scholar]
- Sokolovsky, K., & Lebedev, A. 2005, in 12th Young Scientists’ Conference on Astronomy and Space Physics, 79 [Google Scholar]
- Soszyñski, I., Poleski, R., Udalski, A., et al. 2008, Acta Astron., 58, 163 [NASA ADS] [Google Scholar]
- Sterken, C. 2005, in The Light-Time Effect in Astrophysics: Causes and cures of the O–C diagram, Proc. ASP Conf. Ser., 335, 3 [Google Scholar]
- Stetson, P. B. 1987, PASP, 99, 191 [NASA ADS] [CrossRef] [Google Scholar]
- Storm, J., Gieren, W., Fouqué, P., et al. 2011, A&A, 534, A94 [NASA ADS] [CrossRef] [EDP Sciences] [Google Scholar]
- Straižys, V., & Lazauskaitė, R. 2009, Baltic Astron., 18, 19 [Google Scholar]
- Szabados, L. 1983, Ap&SS, 96, 185 [NASA ADS] [CrossRef] [Google Scholar]
- Szabados, L. 2003, Information Bulletin on Variable Stars, 5394, 1 [Google Scholar]
- Tammann, G. A., & Reindl, B. 2013, IAU Symp., 289, 13 [NASA ADS] [Google Scholar]
- Turner, D. G. 1976, AJ, 81, 1125 [NASA ADS] [CrossRef] [Google Scholar]
- Turner, D. G. 1979, PASP, 91, 642 [NASA ADS] [CrossRef] [Google Scholar]
- Turner, D. G. 1989, AJ, 98, 2300 [NASA ADS] [CrossRef] [Google Scholar]
- Turner, D. G. 2010, Ap&SS, 326, 219 [NASA ADS] [CrossRef] [Google Scholar]
- Turner, D. G. 2012, JAAVSO, 40, 502 [Google Scholar]
- Turner, D. G., Abdel-Sabour Abdel-Latif, M., & Berdnikov, L. N. 2006, PASP, 118, 410 [NASA ADS] [CrossRef] [Google Scholar]
- Turner, D. G., Rosvick, J. M., Balam, D. D., et al. 2011, PASP, 123, 1249 [NASA ADS] [CrossRef] [Google Scholar]
- Turner, D. G., Majaess, D. J., Lane, D. J., et al. 2012, MNRAS, 422, 2501 [NASA ADS] [CrossRef] [Google Scholar]
- van Leeuwen, F. 2007, A&A, 474, 653 [NASA ADS] [CrossRef] [EDP Sciences] [Google Scholar]
- van Leeuwen, F. 2009, A&A, 497, 209 [NASA ADS] [CrossRef] [EDP Sciences] [Google Scholar]
- Wallerstein, G. 1957, PASP, 69, 172 [NASA ADS] [CrossRef] [Google Scholar]
- Wampler, J., Pesch, P., Hiltner, W. A., & Kraft, R. P. 1961, ApJ, 133, 895 [NASA ADS] [CrossRef] [Google Scholar]
- Wegner, W. 2002, Baltic Astron., 11, 1 [Google Scholar]
- Wright, E. L., Eisenhardt, P. R. M., Mainzer, A. K., et al. 2010, AJ, 140, 1868 [NASA ADS] [CrossRef] [Google Scholar]
All Tables
All Figures
|
Fig. 1 XMM-Newton X-ray data (ObsID:040472) were used to help segregate fainter cluster members from field stars, thus facilitating the application of an isochrone and reducing uncertainties associated with the cluster distance derived (e.g., Majaess et al. 2012a; Carraro et al. 2013). Left panel: a cropped XMM-Newton image of the field encompassing M 25, while a near-infrared 2MASS J-band image is shown on the right. Red circles are 2MASS (AAA) sources that exhibit X-ray emission. |
| In the text | |
|
Fig. 2 Optical and near-infrared color–magnitude diagrams for M 25 and NGC 7790. For M 25 the blue and black filled circles are X-ray and bright U-band selected sources, respectively. Color cuts were made to reduce field star contamination. For NGC 7790 the black filled circles are 2MASS (near-infrared) and ARO (optical) field decontaminated photometry (Bonatto & Bica 2011, and references therein). Black dots in the color–magnitude diagrams represent the intrinsic relation (Majaess et al. 2011b) shifted to match the observations. Optical photometry for the cluster Cepheids are conveyed by circled dots (Berdnikov et al. 2000; Berdnikov 2008). |
| In the text | |
|
Fig. 3 Period evolution (O–C) diagrams for U Sgr (dP/dt = + 0.073 s yr-1) and CF Cas (dP/dt = −0.072 s yr-1) facilitate the selection of an isochrone (Fig. 2). The new results imply that U Sgr is traversing the instability strip for the third time and is evolving toward the cool-end of the instability strip, whereas CF Cas may be a second crosser venturing toward hotter temperatures (the scatter is admittedly large). The lower panels display the residuals from the polynomial fits applied. Sterken (2005) relays comprehensive information regarding period evolution (O–C) diagrams. |
| In the text | |
|
Fig. 4 New observations for stars in the field of M 25 that exhibit bright U-band photometry. The intrinsic relation and reddening law by Turner (1989, and references therein) and Turner (1976) were adopted, respectively. A mismatch to the intrinsic relation appears just beyond A0 and may be indicative of a standardization offset or the Hyades anomaly. A mean cluster reddening was determined (EB − V = 0.513 ± 0.034σ) from the B-stars to avoid the aforementioned problem (Turner 1979). |
| In the text | |
|
Fig. 5 Estimated extinction law (RV = AV/EB − V) variations binned as a function of Galactic longitude (Majaess et al., in prep.). The broader sight-lines encompassing M 25 (ℓ ~ 14°) and NGC 7790 (ℓ ~ 117°) exhibit higher and marginally lower values of RV than the canonical extinction law (RV ~ 3.1, Turner 1976), respectively. |
| In the text | |
|
Fig. 6 New DAO spectra for B-stars in NGC 7790 were used in determining the mean reddening (EB − V = 0.52 ± 0.05σ). The spectra are listed in order of increasing ID. Pertinent details regarding the stars are highlighted in Table 1. |
| In the text | |
Current usage metrics show cumulative count of Article Views (full-text article views including HTML views, PDF and ePub downloads, according to the available data) and Abstracts Views on Vision4Press platform.
Data correspond to usage on the plateform after 2015. The current usage metrics is available 48-96 hours after online publication and is updated daily on week days.
Initial download of the metrics may take a while.