Fig. 3
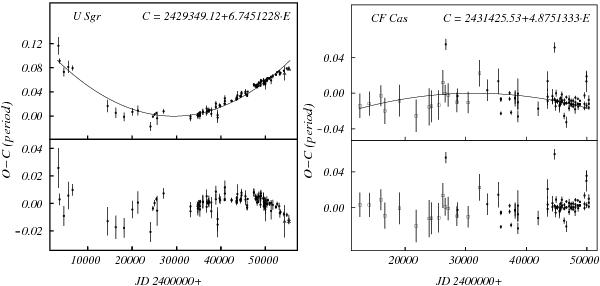
Period evolution (O–C) diagrams for U Sgr (dP/dt = + 0.073 s yr-1) and CF Cas (dP/dt = −0.072 s yr-1) facilitate the selection of an isochrone (Fig. 2). The new results imply that U Sgr is traversing the instability strip for the third time and is evolving toward the cool-end of the instability strip, whereas CF Cas may be a second crosser venturing toward hotter temperatures (the scatter is admittedly large). The lower panels display the residuals from the polynomial fits applied. Sterken (2005) relays comprehensive information regarding period evolution (O–C) diagrams.
Current usage metrics show cumulative count of Article Views (full-text article views including HTML views, PDF and ePub downloads, according to the available data) and Abstracts Views on Vision4Press platform.
Data correspond to usage on the plateform after 2015. The current usage metrics is available 48-96 hours after online publication and is updated daily on week days.
Initial download of the metrics may take a while.