Fig. 2
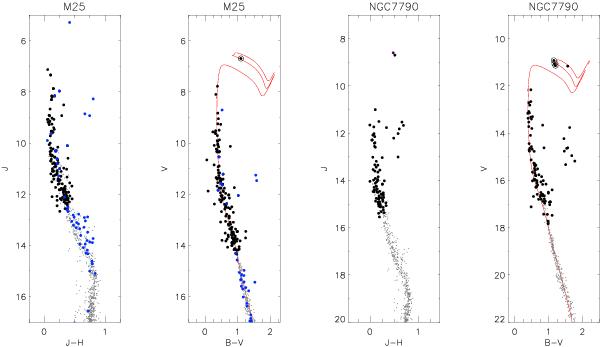
Optical and near-infrared color–magnitude diagrams for M 25 and NGC 7790. For M 25 the blue and black filled circles are X-ray and bright U-band selected sources, respectively. Color cuts were made to reduce field star contamination. For NGC 7790 the black filled circles are 2MASS (near-infrared) and ARO (optical) field decontaminated photometry (Bonatto & Bica 2011, and references therein). Black dots in the color–magnitude diagrams represent the intrinsic relation (Majaess et al. 2011b) shifted to match the observations. Optical photometry for the cluster Cepheids are conveyed by circled dots (Berdnikov et al. 2000; Berdnikov 2008).
Current usage metrics show cumulative count of Article Views (full-text article views including HTML views, PDF and ePub downloads, according to the available data) and Abstracts Views on Vision4Press platform.
Data correspond to usage on the plateform after 2015. The current usage metrics is available 48-96 hours after online publication and is updated daily on week days.
Initial download of the metrics may take a while.