| Issue |
A&A
Volume 560, December 2013
|
|
|---|---|---|
| Article Number | A30 | |
| Number of page(s) | 6 | |
| Section | Stellar structure and evolution | |
| DOI | https://doi.org/10.1051/0004-6361/201322114 | |
| Published online | 02 December 2013 | |
Doppler tomography of the circumstellar disk of π Aquarii⋆,⋆⋆
1
Observatorio Astronomico Nacional, Instituto de Astronomia, Universidad
Nacional Autonoma de Mexico,
22800 Ensenada
BC
Mexico
e-mail:
zhar@astrosen.unam.mx
2
University of North Carolina at Greensboro,
Greensboro,
NC
27402,
USA
e-mail: a_mirosh@uncg.edu
3
Emil-Nolde-Str. 12, 51375
Leverkusen,
Germany
4
Ritter Observatory, University of Toledo,
Toledo,
OH
43606,
USA
5
19 Boulevard Carnot, 21000
Dijon,
France
6
Balmes, 2, 08784
Piera ( Barcelona), Spain
7
6 rue Virgile, 42100
Saint-Etienne,
France
8
ARAS, Astronomical Ring for Access to Spectroscopy,
France
9
Observatoire de Juvignac, 19 avenue du Hameau du Golf, 34990
Juvignac,
France
10
SAPP, CSC des Trois Cités, Le Clos Gaultier,
86000
Poitiers,
France
11
16 Calade, St. Roch, 06410
Biot,
France
12
Observatoire du Val de l’Arc, route de Peynier, 13530
Trets,
France
13
Ebnetstrasse 12, Bitsch, Switzerland
14
Castanet Tolosan Observatory, 6 place Clémence Isaure, 31320
Castanet Tolosan,
France
15
Alpha Observatory, Alpine, Texas
79830,
USA
16
Dorfstrasse 3f, 8603
Schwerzenbach,
Switzerland
17
Observatoire de la Tourbiére, 38690
Chabons,
France
Received:
21
June
2013
Accepted:
23
October
2013
Aims. The work is aimed at studying the circumstellar disk of the bright classical binary Be star π Aqr.
Methods. We analysed variations of a double-peaked profile of the Hα emission line in the spectrum of π Aqr that was observed in many phases during ~40 orbital cycles in 2004−2013. We applied the discrete Fourier transform (DFT) method to search for periodicity in the peak intensity ratio (V/R). Doppler tomography was used to study the structure of the disk around the primary.
Results. The dominant frequency in the power spectrum of the Hα V/R ratio is 0.011873 day-1, which corresponds to a period of 84.2(2) days and agrees with the earlier determined orbital period of the system, Porb = 84.1 days. The V/R shows a sinusoidal variation that is phase-locked with the orbital period. Doppler maps of all our spectra show a non-uniform structure of the disk around the primary: a ring with the inner and outer radii at Vin ≈ 450 km s-1 and Vout ≈ 200 km s-1, respectively, along with an extended stable region (spot) at Vx ≈ 225 km s-1 and Vy ≈ 100 km s-1. The disk radius of ≈65 R⊙ = 0.33 AU was estimated by assuming Keplerian motion of a particle on a circular orbit at the disk’s outer edge.
Key words: binaries: spectroscopic / circumstellar matter / stars: emission-line, Be / stars: individual: pi Aquarii / techniques: spectroscopic
Table 1 and π Aquarii spectra in FITS format are only available at the CDS via anonymous ftp to cdsarc.u-strasbg.fr (130.79.128.5) or via http://cdsarc.u-strasbg.fr/viz-bin/qcat?J/A+A/560/A30
© ESO, 2013
1. Introduction
Classical Be stars are fast-rotating, non-supergiant B-type stars with Balmer emission lines in their spectra. The emission lines are recombination lines that occur in a geometrically thin, equatorial, circumstellar disk according to a model first proposed by Struve (1931). The model has been modified and developed further by many authors and recently confirmed by direct interferometric observations (Quirrenbach et al. 1997; Gies et al. 2007; Carciofi et al. 2009; Grzenia et al. 2013). The disk may disappear entirely and reappear unpredictably. The intensity of the emission lines varies on a time scale of days to decades. It is widely accepted that the origin of the variability is caused by processes occurring in the circumstellar disk and non-radial pulsations of the B-star photosphere (Porter & Rivinius 2003). Typically, the dominant feature in the Be star spectra is an asymmetric double-peaked Hα emission line.
Many Be stars exhibit variations in the ratio of the blue (violet) and red emission peaks (V/R variations) of the Balmer emission lines on a time scale of a few years. V/R variations may be due to the evolution of a one-armed spiral density pattern and/or binary effects (Kato 1983; Okazaki 1991, 1997). The main observational properties of the V/R variations and theoretical suggestions were summarized in Mennickent et al. (1997). The most complete compilation of Be stars showing the V/R variations contains 62 objects (Okazaki 1997). Eleven of them were known to be binaries at the time. The time scale of the V/R variations is typically much longer than rotational periods of the star or the disk and does not correlate with orbital periods of the binaries. However, some binary systems, ϕ Per (Bozic et al. 1995; Gies et al. 1998), V696 Mon (Peters 1972), 4 Her (Harmanec et al. 1976; Koubsky et al. 1997), V744 Her (Doazan et al. 1982), κ Dra (Juza et al. 1991), ϵ Cap (Rivinius et al. 1999), and FY CMa (Rivinius et al. 2004) present an exception to the rule. For example, in the case of 4 Her, the V/R variations are orbitally phase-locked and coherent over more than 80 cycles (Štefl et al. 2007).
The source π Aqr (HR 8539, HD 212571) is a bright, rapidly rotating
(υsini ≈ 300 km s-1) classical Be star with
variable mass loss. Analysing its Hα line profiles and
photospheric absorption during a diskless phase in 1996−2001, Bjorkman et al. (2002) suggested that π Aqr is a binary system
with an orbital period of Porb = 84.1 days. The system consists
of two stars with masses
M1sin3i = 12.4 M⊙
and
M2sin3i = 2.0 M⊙.
The orbit is viewed at an inclination angle of 50°−75°. The
components mass ratio and separation are
M2/M1 = 0.16
and a = 0.96sin-1i AU, respectively. Using the
evolutionary tracks from Schaerer et al. (1993), the
effective temperature  of the primary component,
and its luminosity
log (Lbol/L⊙) = 4.1 ± 0.3,
(Bjorkman et al. 2002) estimated the primary’s mass
to be M1 = 11 ± 1.5 M⊙. We further
address this issue in Sect. 4.1.
of the primary component,
and its luminosity
log (Lbol/L⊙) = 4.1 ± 0.3,
(Bjorkman et al. 2002) estimated the primary’s mass
to be M1 = 11 ± 1.5 M⊙. We further
address this issue in Sect. 4.1.
Variability of the Balmer line profiles of π Aqr, which appeared double-peaked most of the time, has been reported by McLaughlin (1962) and Pollmann (2012). McLaughlin (1962) observed strong V/R variations ranging from 0.5 to 4.0, and several periods of absence of bright emission lines (1936−1937, 1944−1945, 1950). Based on the π Aqr spectra obtained between October 2004 and August 2011 together with the available spectra of the data base BeSS1, Pollmann (2012) found a dominant frequency in the power spectrum of the V/R ratio that corresponded to a period of 83.8 ± 0.8 days. This value coincides within the errors with the above mentioned orbital period of the system.
In this paper we attempt a new period analysis of the V/R variations in the Hα line profile of π Aqr based on spectroscopic observations obtained over ~40 orbital cycles of the system in 2004−2013. The disk structure of π Aqr was probed using the Doppler tomography method. In Sect. 2 we describe our observations, in Sect. 3 period analysis of the Hα line profile variation is presented. The Doppler tomography of the system and modelling of the circumstellar disk are presented in Sect. 4.2, and the results and conclusion are presented and discussed in Sect. 5.
2. Observations and data reduction
The object is continuously observed by both professionals and amateurs since its binarity was revealed. For this study we used spectra obtained by both communities. In particular, 36 spectra were obtained in 2004−2006 with the 1.0 m telescope of the Ritter Observatory of the University of Toledo (Toledo, OH, USA) using a fiber-fed échelle spectrograph with a Wright Instruments Ltd. CCD camera. The spectra consisted of nine non-overlapping orders ~70 Å in the range 5285−6597 Å with a spectral resolving power R ≃ 26 000. Twelve spectra were obtained between October 2011−October 2013 at the 0.81 m telescope of the Three College Observatory (near Greensboro, NC, USA) using a fiber-fed échelle spectrograph manufactured by Shelyak Instruments with a SBIG ST−7XMEI (2011−2012) or an ATIK−460EX (2013) CCD camera. The spectra cover a range 4600−7200 Å with a R ≃ 10 000. These data were reduced with IRAF2.
The contribution of the amateur community to the campaign involved 17 observers from Germany, France, Spain, Mexico, Switzerland, and the USA. They used 0.2 m to 0.4 m telescopes with a long-slit (in most cases) and échelle spectrographs with a range of R = 10 000−22 000. In total, 238 spectra were obtained between September 2004 and October 2013. Data reduction was performed using MaxIm-DL 3.06 (Diffraction Limited, Sehgal Corporation) for Pollmann’s data, while data from other amateurs were reduced with software packages developed for amateur spectrographs, such as SpcAudace3, Audela4, VSpec5, and IRIS36. Spectral line parameters were measured with the spectral classification software package MK327. No systematic difference in the V/R ratios or the Hα line equivalent widths (hereafter EWHα) were found between the professional and amateur data (see Figs. 2 & 3). We showed earlier that radial velocity data from both communities also agree very well (Miroshnichenko et al. 2013). The dates of observations, the source, and results of the V/R and EW measurements are presented in Table 1.
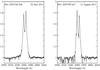 |
Fig. 1 V- and R-dominated examples of π Aqr Hα profiles. Epoch of observations are shown. |
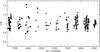 |
Fig. 2 Variation of V/R ratio of the Hα during reported observation. The amateur and professional data are marked by grey circles and black squares, respectively. |
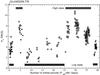 |
Fig. 3 Equivalent width of Hα emission line vs. orbital cycles of the system. The epoch of beginning of observations is shown too. The notes and bands in figure mark values of the Hα equivalent widths selected for “high” and “low” state. Symbols are the same as in Fig. 2. |
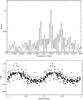 |
Fig. 4 Top panel: power spectrum of V/R variation. Bottom panel: V/R ratio folded on the orbital period of the system 84.1 day. φorb = 0.0 corresponds to the inferior conjunction of the secondary. |
3. Variability of the Hα line
As noted above, the Hα line profile of π Aqr is double-peaked and strongly variable. Examples of the Hα line profile for two epochs of observations are shown in Fig. 1. We measured the V/R ratio (defined as V/R = IV/IR) in the Hα emission line using peak intensities of the V and R components which were separately fitted with a single Gaussian. The values of the V/R ratio vary in the range of 0.8−1.4 (Fig. 2) and do not correlate with EWHα (Fig. 3). The latter ranges between 1.0 and 11.0 Å and shows no periodicity. We refer to the spectra with a stronger Hα line (EWHα ≥ 4.8 Å) as to a “high state” and to those with a weaker Hα line as to a “low state” for the following analysis. The discrete Fourier transform (DFT) method8 was used to search for periodicity in the V/R variation during our observations. The dominant frequency in the power spectrum is 0.011873 ± 0.00028 day-1 corresponds to a period of 84.2 ± 0.2 days that is in agreement with the system orbital period of Porb = 84.1 days found by Bjorkman et al. (2002). The resulting power spectrum and the V/R ratio folded with the dominant frequency are presented in Fig. 4. Therefore, we conclude that the V/R variations in π Aqr are locked with the orbital period, at least on a time scale of ≈3400 days or 40 orbital cycles. The shape of the V/R variation curve is sinusoidal.
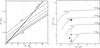 |
Fig. 5 Left panel: M2 vs.
M1 relationships for different inclination
i of the system orbital plane obtained from the mass function
|
4. Doppler tomography and disk model
4.1. System parameters
There is an apparent discrepancy between the dynamical and the evolutionary mass of the primary component that was outlined. This problem has not been resolved by Bjorkman et al. (2002), so we reanalysed the system parameters of the π Aqr binary below.
We calculated an absolute magnitude of  mag using the following: system brightness during the diskless epoch (1996−2001) of
V = 4.85 mag, an interstellar extinction of
AV = 0.15 mag, and a Hipparcos
distance
mag using the following: system brightness during the diskless epoch (1996−2001) of
V = 4.85 mag, an interstellar extinction of
AV = 0.15 mag, and a Hipparcos
distance  pc (Perryman & ESA 1997). A more recent
distance
pc (Perryman & ESA 1997). A more recent
distance  pc (van Leeuwen 2007) gives an absolute magnitude
of
pc (van Leeuwen 2007) gives an absolute magnitude
of  mag. Applying a bolometric correction of
BCV = −2.36 ± 0.10 mag
for Teff = 24 000 ± 1000 K (Miroshnichenko 1997), one gets a luminosity of log
L/L⊙ = 4.02 ± 0.24 for
the larger distance and log
L/L⊙ = 3.72 ± 0.08 for
the smaller one. These luminosities correspond to initial masses of 10.5
M⊙ and 9.5 M⊙, respectively, on
the most recent evolutionary tracks with rotation by Ekström et al. (2012). Both these values are noticeably lower than the primary’s
dynamical mass
M1sin3i = 12.4 M⊙
from Bjorkman et al. (2002). Since the radial
velocity curves of both companions were well-established over the entire diskless period,
the dynamical mass seems to be more reliable than the evolutionary mass. As seen in Fig.
5 (left panel), the primary’s mass ranges within
12.5−17.0 M⊙ for the most probable orbital inclination of
i = 65−85° (Bjorkman et al.
2002). This mass range requires a higher luminosity of the system (see Fig. 5, right panel). Comparison with the evolutionary models
by Ekström et al. (2012) also shows that the primary
component with
mag. Applying a bolometric correction of
BCV = −2.36 ± 0.10 mag
for Teff = 24 000 ± 1000 K (Miroshnichenko 1997), one gets a luminosity of log
L/L⊙ = 4.02 ± 0.24 for
the larger distance and log
L/L⊙ = 3.72 ± 0.08 for
the smaller one. These luminosities correspond to initial masses of 10.5
M⊙ and 9.5 M⊙, respectively, on
the most recent evolutionary tracks with rotation by Ekström et al. (2012). Both these values are noticeably lower than the primary’s
dynamical mass
M1sin3i = 12.4 M⊙
from Bjorkman et al. (2002). Since the radial
velocity curves of both companions were well-established over the entire diskless period,
the dynamical mass seems to be more reliable than the evolutionary mass. As seen in Fig.
5 (left panel), the primary’s mass ranges within
12.5−17.0 M⊙ for the most probable orbital inclination of
i = 65−85° (Bjorkman et al.
2002). This mass range requires a higher luminosity of the system (see Fig. 5, right panel). Comparison with the evolutionary models
by Ekström et al. (2012) also shows that the primary
component with  K in π
Aqr has evolved out of the main sequence if its mass exceeds ~15
M⊙.
K in π
Aqr has evolved out of the main sequence if its mass exceeds ~15
M⊙.
Since Be stars are considered to be main-sequence objects (e.g., Frémat et al. 2006), we therefore adopt a mass of 14.0 ± 1.0 M⊙ for the primary. This constrains its luminosity at log L/L⊙ = 4.7 ± 0.1, which in turn leads to MV = −4.64 ± 0.25 mag and a distance of 740 ± 90 pc. A separate study of stars near the object’s line of sight (which is beyond the scope of this paper) is needed to verify this result. Nevertheless, the mass adjustment will only change the circumstellar disk scale, but not the qualitative results of our modelling. In Table 2 we present a summary of the adopted parameters of the π Aqr binary system.
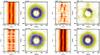 |
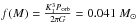
Fig. 6 Phased time series spectra around Hα line folded with the orbital period of the system and corresponding Doppler maps. The orbital period of Porb = 84.1 days, the primary mass of M1 = 14.0 M⊙, and the mass ratio of q = 0.16 are used to overlay positions of the stellar components on the Doppler maps. The inclination angle i = 70° is arbitrarily chosen based on suggestions by Bjorkman et al. (2002). φorb = 0.0 corresponds to the inferior conjunction of the secondary. |
 |
Fig. 7 Our geometrical model of π Aqr. The blue and orange filled circles mark the primary and the secondary, respectively. The circumstellar disk is shown in brown. The red regions in the disk are constructed on the basis of the Doppler tomography and corresponds the excess of Hα emission comparison to with the rest of the disk. Scales of both axes are given in solar radii. Arrows show the direction of the binary rotation, and the cross indicates the centre of mass of the system. Parameters of the system are given in Table 2. |
Adopted parameters of π Aqr.
4.2. Doppler tomography
The Hα line profiles of π Aqr were recorded at many orbital phases of the system over ~40 orbital cycles. Our finding that the V/R variations are locked with the orbital period suggests that the Hα line profile variability could be caused by a complex structure in the circumstellar disk. We used Doppler tomography (Marsh & Horne 1988) to study the structure of the disk around the primary in π Aqr.
The Doppler maps were built by combining time-resolved spectra using the maximum entropy method as implemented by Spruit (1998)9. Figure 6 shows phased time series spectra around the Hα line and corresponding Doppler maps of all spectra (top row, left panel), “low” (bottom row, left panel) and “high” (bottom row, right panel) states, and a difference between each spectrum in a “high” and the average spectrum in the “low” state (top row, right panel). The orbital period of Porb = 84.1 days, the primary mass of M1 = 14.0 M⊙, and the mass ratio q = 0.16 (Table 2) are used to overlay positions of the stellar components on the Doppler maps. The inclination angle i = 70° is arbitrarily chosen based on the discussion in Sect. 4.1, and φorb = 0.0 corresponds to the inferior conjunction of the secondary. The location of the main components in the system, such as the position of the centre of mass, the primary, the secondary, and the Roche lobe of the secondary star, are indicated.
The Doppler maps of all spectra show a non-uniform structure of the disk around the primary: a ring with the inner and outer radii at Vin ≈ 450 km s-1 and Vout ≈ 200 km s-1, respectively, together with an extended stable region (spot) at Vx ≈ 225 km s-1 and Vy ≈ 100 km s-1. We note that EWHα is a function of the total flux and surface brightness distribution of the disk. The “spot” is brighter and more extended in the “High” state than in to the “Low” state. However, the brightness of the extended region is significantly lower than the total disk brightness and corresponds to an S-wave that can be seen only in “High-Low” trailed spectra. The disk radius of ≈65 R⊙ = 0.33 AU was estimated assuming Keplerian motion of a particle in a circular orbit at the disk’s outer edge. Based on the results of the Doppler tomography, a geometrical model of the π Aqr system is presented in Fig. 7.
5. Discussion and conclusion
In this paper we attempted a new period analysis of the V/R variations in the Hα line profile of π Aqr and probe the primary’s circumstellar disk structure based on spectroscopic observations obtained over multiple orbital cycles of the system. The main conclusions of our analysis follow:
-
The primary star has a mass of M1 = 14 ± 0.1 M⊙ and a radius of 13.0 ± 1.4 R⊙. The latter is nearlytwice as large as that of a ZAMS star with the same mass. Thesystem orbit most likely has an inclination angle in the range of 65°−85°.
-
The V/R variations for the Hα line of π Aqr show sinusoidal behaviour with a period that coincides with the orbital period of the system. Therefore, based on the results of Bjorkman et al. (2002), Pollmann (2012), and the analysis presented here, we propose to include π Aqr in the list of Be binaries that show orbital phase-locked V/R variations. The V/R variations reported here were coherent over ~40 cycles.
-
There is an S-wave in the Hα phased time-series spectra, and the Doppler tomograms demonstrate a corresponding bright extended spot within the circumstellar disk. The radius of the circumstellar disk around the primary component is ~65 R⊙. The spot is located in the outer part of the disk that faces the secondary. The position of the spot in the disk is stable, but its relative brightness correlates with the EWHα value. In general, the structure of the spot looks like a one-armed spiral density pattern. However, there is a faint hint of the second arm at the opposite side of the disk. The brightest part of the spot begins at ≈−90° from the major axis of the system and continues to ~120° counterclockwise with decreasing intensity (Figs. 6 and 7).
Long-term V/R variations in Be stars are explained well by a model of global one-armed oscillations in the equatorial disk first proposed by Kato (1983) and developed by Okazaki (1991, 1997). In this model the one-armed perturbation slowly (on a time scale of ~10 years) precesses in the opposite direction to the semi-Keplerian motion as a result of pressure forces in the disk. If we take into account deviation from a 1/r point potential, this leads to a slowly revolving prograde oscillation mode also with very long time scale semi-periods (Papaloizou et al. 1992). The following studies include other effects, although the number of free parameters and their wide range lead to a low predictive power for these models (Fiřt & Harmanec 2006).
A significant number of Be stars are binary systems (Porter & Rivinius 2003; Oudmaijer & Parr 2010; Miroshnichenko 2011). Nevertheless, in the current models, the oscillation period weakly depends on the orbital parameters. For example, Oktariani & Okazaki (2009) found that the oscillation period increases with increasing binary separation and/or decreasing binary mass ratio. However, two well-established examples of orbital phase-locked systems 4 Her and π Aqr have relatively large separations and low mass ratios of 0.06−0.016 (Koubsky et al. 1997) and 0.165 (Bjorkman et al. 2002), respectively. Therefore, we must emphasize that, in fact, a number of Be systems exist with phase-locked V/R variations. Unfortunately, no explanation currently exists for this phenomenon within the framework of the one-armed oscillation model. It is likely that careful accounting of tidal or/and heating effects from the secondary on the structure of a circumstellar disk can improve the situation.
There are also a number of Be + sdO binaries, such as 59 Cyg (Maintz et al. 2005; Peters et al. 2013), FY CMa (Štefl et al. 2005; Peters et al. 2008) and φ Per (Gies et al. 1993; Štefl et al. 2000), in which the V/R variations are also locked with the orbital period. The orbital period locked emission in these systems more likely originated in the outer parts of the Be star disk facing the secondary that are directly heated by a low-mass (log M/M⊙ from ~−0.1 to ~0.1), hot (log Teff ~ 4.7) subdwarf (sdO) companion (Peters et al. 2013, see Table 5). Most sdO/sdB stars have masses between 0.40 M⊙ and 0.55 M⊙, but some of them may be as massive as ~1.1 M⊙ (Zhang et al. 2010). Although the effective temperature of the secondary component in π Aqr is unknown, its mass M2 cannot be lower than 2 M⊙ (Fig. 5, left panel). Therefore, it is unlikely to be an sdO or sdB star.
Bjorkman et al. (2002) suggest that the secondary component in π Aqr is probably an A− or F−type main-sequence star, since only signs of the primary component are seen in the UV spectrum. Nevertheless, the latter does not exclude the mechanism of phase-locked V/R variations in π Aqr being similar to or the same (some tidal and heating effects on the structure of the circumstellar disk caused by the secondary) as discussed above for Be + sdO binaries.
In any case, it is very important to continue observing π Aqr and other phase-locked systems spectroscopically, photometrically, and interferometrically to search for more clues to their nature. Finally, the data presented in this paper manifest an increasing role of the amateur spectroscopy in stellar astrophysics (cf. Miroshnichenko et al. 2013).
Acknowledgments
This work was supported by DGAPA/PAPIIT project IN 103912. A.M. acknowledges financial support from the University of North Carolina at Greensboro and from its Department of Physics and Astronomy. We thank observers at the Ritter Observatory for taking the spectra and reducing them. This work has made use of the BeSS database, operated at LESIA, Observatoire de Meudon, France: http://basebe.obspm.fr.
References
- Bjorkman, K. S., Miroshnichenko, A. S., McDavid, D., & Pogrosheva, T. M. 2002, ApJ, 573, 812 [NASA ADS] [CrossRef] [Google Scholar]
- Bozic, H., Harmanec, P., Horn, J., et al. 1995, A&A, 304, 235 [NASA ADS] [Google Scholar]
- Carciofi, A. C., Okazaki, A. T., Le Bouquin, J.-B., et al. 2009, A&A, 504, 915 [NASA ADS] [CrossRef] [EDP Sciences] [Google Scholar]
- Doazan, V., Harmanec, P., Koubsky, P., Krpata, J., & Zdarsky, F. 1982, A&A, 115, 138 [NASA ADS] [Google Scholar]
- Ekström, S., Georgy, C., Eggenberger, P., et al. 2012, A&A, 537, A146 [NASA ADS] [CrossRef] [EDP Sciences] [Google Scholar]
- Fiřt, R., & Harmanec, P. 2006, A&A, 447, 277 [NASA ADS] [CrossRef] [EDP Sciences] [Google Scholar]
- Frémat, Y., Neiner, C., Hubert, A.-M., et al. 2006, A&A, 451, 1053 [NASA ADS] [CrossRef] [EDP Sciences] [Google Scholar]
- Gies, D. R., Willis, C. Y., Penny, L. R., & McDavid, D. 1993, PASP, 105, 281 [NASA ADS] [CrossRef] [Google Scholar]
- Gies, D. R., Bagnuolo, Jr., W. G.,Ferrara, E. C., et al. 1998, ApJ, 493, 440 [NASA ADS] [CrossRef] [Google Scholar]
- Gies, D. R., Bagnuolo, Jr., W. G.,Baines, E. K., et al. 2007, ApJ, 654, 527 [Google Scholar]
- Grzenia, B. J., Tycner, C., Jones, C. E., et al. 2013, AJ, 145, 141 [NASA ADS] [CrossRef] [Google Scholar]
- Harmanec, P., Koubský, P., Krpata, J., & Ždárský, F. 1976, Bull. Astron. Inst. Czechosl., 27, 47 [NASA ADS] [Google Scholar]
- Hohle, M. M., Neuhäuser, R., & Schutz, B. F. 2010, Astron. Nachr., 331, 349 [NASA ADS] [CrossRef] [Google Scholar]
- Juza, K., Harmanec, P., Hill, G. M., Tarasov, A. E., & Matthews, J. M. 1991, Bull. Astron. Inst. Czechosl., 42, 39 [Google Scholar]
- Kato, S. 1983, PASJ, 35, 249 [NASA ADS] [Google Scholar]
- Koubsky, P., Harmanec, P., Kubat, J., et al. 1997, A&A, 328, 551 [NASA ADS] [Google Scholar]
- Maintz, M., Rivinius, T., Stahl, O., Stefl, S., & Appenzeller, I. 2005, Publ. Astron. Inst. Czechosl. Acad. Sci., 93, 21 [Google Scholar]
- Marsh, T. R., & Horne, K. 1988, MNRAS, 235, 269 [NASA ADS] [CrossRef] [Google Scholar]
- McLaughlin, D. B. 1962, ApJS, 7, 65 [NASA ADS] [CrossRef] [Google Scholar]
- Mennickent, R. E., Sterken, C., & Vogt, N. 1997, A&A, 326, 1167 [NASA ADS] [Google Scholar]
- Miroshnichenko, A. S. 1997, eds. T. R. Bedding, A. J. Booth, & J. Davis, in IAU Symp., 189, 50 [Google Scholar]
- Miroshnichenko, A. S. 2011, in IAU Symp. 272, eds. C. Neiner, G. Wade, G. Meynet, & G. Peters, 304 [Google Scholar]
- Miroshnichenko, A. S., Pasechnik, A. V., Manset, N., et al. 2013, ApJ, 766, 119 [NASA ADS] [CrossRef] [Google Scholar]
- Okazaki, A. T. 1991, PASJ, 43, 75 [NASA ADS] [Google Scholar]
- Okazaki, A. T. 1997, A&A, 318, 548 [NASA ADS] [Google Scholar]
- Oktariani, F., & Okazaki, A. T. 2009, PASJ, 61, 57 [NASA ADS] [Google Scholar]
- Oudmaijer, R. D., & Parr, A. M. 2010, MNRAS, 405, 2439 [NASA ADS] [Google Scholar]
- Papaloizou, J. C., Savonije, G. J., & Henrichs, H. F. 1992, A&A, 265, L45 [NASA ADS] [Google Scholar]
- Perryman, M. A. C., & ESA, eds. 1997, The HIPPARCOS and TYCHO catalogues, Astrometric and photometric star catalogues derived from the ESA Hipparcos Space Astrometry Mission, ESA SP, 1200 [Google Scholar]
- Peters, G. J. 1972, PASP, 84, 334 [NASA ADS] [CrossRef] [Google Scholar]
- Peters, G. J., Gies, D. R., Grundstrom, E. D., & McSwain, M. V. 2008, ApJ, 686, 1280 [Google Scholar]
- Peters, G. J., Pewett, T. D., Gies, D. R., Touhami, Y. N., & Grundstrom, E. D. 2013, ApJ, 765, 2 [NASA ADS] [CrossRef] [Google Scholar]
- Pollmann, E. 2012, Inf. Bull. Var. Stars, 6023, 1 [NASA ADS] [Google Scholar]
- Porter, J. M., & Rivinius, T. 2003, PASP, 115, 1153 [NASA ADS] [CrossRef] [Google Scholar]
- Quirrenbach, A., Bjorkman, K. S., Bjorkman, J. E., et al. 1997, ApJ, 479, 477 [NASA ADS] [CrossRef] [Google Scholar]
- Rivinius, T., Štefl, S., & Baade, D. 1999, A&A, 348, 831 [NASA ADS] [Google Scholar]
- Rivinius, T., Štefl, S., Maintz, M., Stahl, O., & Baade, D. 2004, A&A, 427, 307 [NASA ADS] [CrossRef] [EDP Sciences] [Google Scholar]
- Schaerer, D., Charbonnel, C., Meynet, G., Maeder, A., & Schaller, G. 1993, A&AS, 102, 339 [NASA ADS] [Google Scholar]
- Spruit, H. C. 1998 [arXiv:astro-ph/9806141] [Google Scholar]
- Struve, O. 1931, ApJ, 73, 94 [NASA ADS] [CrossRef] [Google Scholar]
- Štefl, S., Hummel, W., & Rivinius, T. 2000, A&A, 358, 208 [NASA ADS] [Google Scholar]
- Štefl, S., Rivinius, T., Baade, D., Maintz, M., & Stahl, O. 2005, in The Nature and Evolution of Disks Around Hot Stars, eds. R. Ignace, & K. G. Gayley, ASP Conf. Ser., 337, 309 [Google Scholar]
- Štefl, S., Okazaki, A. T., Rivinius, T., & Baade, D. 2007, in Active OB-Stars: Laboratories for Stellare and Circumstellar Physics, eds. A. T. Okazaki, S. P. Owocki, & S. Stefl, ASP Conf. Ser., 361, 274 [Google Scholar]
- van Leeuwen, F. 2007, A&A, 474, 653 [NASA ADS] [CrossRef] [EDP Sciences] [Google Scholar]
- Zhang, X., Chen, X., & Han, Z. 2010, Ap&SS, 329, 11 [NASA ADS] [CrossRef] [Google Scholar]
All Tables
All Figures
|
Fig. 1 V- and R-dominated examples of π Aqr Hα profiles. Epoch of observations are shown. |
| In the text | |
|
Fig. 2 Variation of V/R ratio of the Hα during reported observation. The amateur and professional data are marked by grey circles and black squares, respectively. |
| In the text | |
|
Fig. 3 Equivalent width of Hα emission line vs. orbital cycles of the system. The epoch of beginning of observations is shown too. The notes and bands in figure mark values of the Hα equivalent widths selected for “high” and “low” state. Symbols are the same as in Fig. 2. |
| In the text | |
|
Fig. 4 Top panel: power spectrum of V/R variation. Bottom panel: V/R ratio folded on the orbital period of the system 84.1 day. φorb = 0.0 corresponds to the inferior conjunction of the secondary. |
| In the text | |
|
Fig. 5 Left panel: M2 vs.
M1 relationships for different inclination
i of the system orbital plane obtained from the mass function
|
| In the text | |
|
Fig. 6 Phased time series spectra around Hα line folded with the orbital period of the system and corresponding Doppler maps. The orbital period of Porb = 84.1 days, the primary mass of M1 = 14.0 M⊙, and the mass ratio of q = 0.16 are used to overlay positions of the stellar components on the Doppler maps. The inclination angle i = 70° is arbitrarily chosen based on suggestions by Bjorkman et al. (2002). φorb = 0.0 corresponds to the inferior conjunction of the secondary. |
| In the text | |
|
Fig. 7 Our geometrical model of π Aqr. The blue and orange filled circles mark the primary and the secondary, respectively. The circumstellar disk is shown in brown. The red regions in the disk are constructed on the basis of the Doppler tomography and corresponds the excess of Hα emission comparison to with the rest of the disk. Scales of both axes are given in solar radii. Arrows show the direction of the binary rotation, and the cross indicates the centre of mass of the system. Parameters of the system are given in Table 2. |
| In the text | |
Current usage metrics show cumulative count of Article Views (full-text article views including HTML views, PDF and ePub downloads, according to the available data) and Abstracts Views on Vision4Press platform.
Data correspond to usage on the plateform after 2015. The current usage metrics is available 48-96 hours after online publication and is updated daily on week days.
Initial download of the metrics may take a while.