Fig. 7
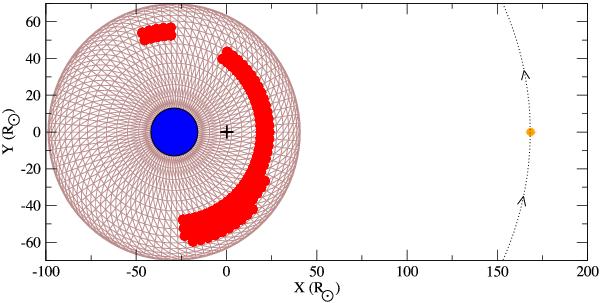
Our geometrical model of π Aqr. The blue and orange filled circles mark the primary and the secondary, respectively. The circumstellar disk is shown in brown. The red regions in the disk are constructed on the basis of the Doppler tomography and corresponds the excess of Hα emission comparison to with the rest of the disk. Scales of both axes are given in solar radii. Arrows show the direction of the binary rotation, and the cross indicates the centre of mass of the system. Parameters of the system are given in Table 2.
Current usage metrics show cumulative count of Article Views (full-text article views including HTML views, PDF and ePub downloads, according to the available data) and Abstracts Views on Vision4Press platform.
Data correspond to usage on the plateform after 2015. The current usage metrics is available 48-96 hours after online publication and is updated daily on week days.
Initial download of the metrics may take a while.