| Issue |
A&A
Volume 678, October 2023
|
|
|---|---|---|
| Article Number | A47 | |
| Number of page(s) | 29 | |
| Section | Interstellar and circumstellar matter | |
| DOI | https://doi.org/10.1051/0004-6361/202244149 | |
| Published online | 03 October 2023 | |
The historical active episodes of the disks around γ Cassiopeiae (B0.5 IVe) and 59 Cygni (B1 IVe) revisited
1
European Organisation for Astronomical Research in the Southern Hemisphere (ESO),
Karl-Schwarzschild-Str. 2,
85748
Garching b. München, Germany
e-mail: dbaade@eso.org
2
LESIA, Paris Observatory, PSL University, CNRS, Sorbonne University, Université Paris Cité,
5 place Jules Janssen,
92195
Meudon, France
e-mail: Jonathan.Bartz@obspm.fr
3
Homer L. Dodge Department of Physics and Astronomy, University of Oklahoma,
440 W. Brooks Street,
Norman, OK
73019, USA
4
Instituto de Astronomia, Geofísica e Ciências Atmosféricas, Universidade de São Paulo,
Rua do Matão 1226, Cidade Universitária,
05508-900
São Paulo, SP, Brazil
5
European Organisation for Astronomical Research in the Southern Hemisphere (ESO),
Casilla
19001,
Santiago 19,
Chile
Received:
30
May
2022
Accepted:
5
June
2023
The observations of all known major activity phases of the disks around the classical Be stars γ Cas and 59 Cyg with low-mass companions are comprehensively reviewed and purely qualitatively evaluated again, though taking advantage of new insights gained over the past 25 yr into the physics of Be disks. Both stars have exhibited activity cycles in the violet-to-red (V/R) flux ratio of emission lines with two peaks. This activity is indistinguishable from those of the vast majority of Be stars and so probably were caused by one-armed (m = 1) disk oscillations. The anomalous high-activity phases from 1932 to 1942 in γ Cas and between 1972 and 1976 in 59 Cyg were distinguished from m = 1 density waves by large variations in the separations of pairs of emission peaks. In two consecutive cycles, shell phases during which the emission peaks were maximally separated alternated with single (blended) emission peaks. The amplitude in peak separation of more than a factor of two implies a high-amplitude variation in the disk aspect angle. When the peaks were blended and the disk was viewed closest to face-on, local maxima in visual brightness probably occurred in γ Cas, and the visibility of the stellar absorption lines was reduced, as is expected from increased free-bound emission into the line of sight (there is no time-resolved photometry for 59 Cyg from the event in the 1970s). In y Cas, the pre-event V/R variability (pre-event observations of 59 Cyg do not exist) was practically identical to m = 1 variability. In spite of the subsequent rapid rise in amplitude (up to ~4), the V/R variations connected smoothly in phase but may require an explanation involving the 3D structure of the disk. The phasing of single-peak and shell stages relative to the V/R activity was the same in both cycles of γ Cas, whereas this is not clear for 59 Cyg. During both high-activity cycles of γ Cas, but at different phases, transient additional pairs of emission lines appeared in γ Cas that were much sharper than the main ones and they also had different peak separations and V/R ratios. In the second instance, their velocities were up to ~+500 km s−1. The extremely rapid excitation of the activity phases and their short duration of only two cycles in both stars may indicate a resonant behavior of an unidentified nature. In both stars, the line emission was strongly developed at the onset of the high-activity phases but it basically disappeared at the end of them, and the disks may have been dynamically destroyed. The atypical disk variations were presumably triggered by enhanced interactions between a disk and companion star. In both systems, there seems to be less evidence for a mass-loss outburst than for a reduced mass-injection rate into the disk. The resulting lower viscous coupling between a disk and star would have facilitated the tilting of the disk.
Key words: stars: massive / stars: mass-loss / stars: emission-line / Be / circumstellar matter / stars: individual: y Cassiopeiae / stars: individual: 59 Cygni
© The Authors 2023
 Open Access article, published by EDP Sciences, under the terms of the Creative Commons Attribution License (https://creativecommons.org/licenses/by/4.0), which permits unrestricted use, distribution, and reproduction in any medium, provided the original work is properly cited.
This article is published in open access under the Subscribe to Open model. Subscribe to A&A to support open access publication.
1 Introduction
For several decades, a fitting definition of a Be star could have been as follows: a riddle (namely the central B star) wrapped up in an enigma (namely the circumstellar disk). Although, over the past generation, several very enlightening advances have been achieved (see Rivinius et al. 2013, for a review), the Be phenomenon, namely the formation of a rotating gaseous disk around a rapidly rotating B star, is nevertheless still awaiting its generally accepted explanation.
Be disks are dust free, rotationally supported, and governed by viscosity as described by the viscous decretion disk (VDD) model (Haubois et al. 2012; Okazaki 2016; Vieira et al. 2017, a more general summary is provided in Labadie-Bartz et al., in prep., hereafter Paper II). To compensate for the combined effects of viscous dissipation and radiative ablation (Kee et al. 2018, and references therein), disks need to be replenished to persist. Irregularities in this process can lead to medium- and long-term variations in emission strength. Since some fraction of the stellar mass injection into the disk is due to discrete events at varying rates on mostly shorter timescales (e.g., Semaan et al. 2018; Baade et al. 2018; Rivinius et al. 1998), the amount of matter in the disk and, as the result, the strength of the line emission (Labadie-Bartz et al. 2018) and the continuum flux excess (Labadie-Bartz et al. 2017; Bernhard et al. 2018) vary on timescales from days to decades.
The (near-Keplerian) rotation of the disks around classical Be stars (hereafter called Be stars) manifests in doubly peaked emission lines. In an epochal paper, Struve (1931) established that the separation of the peaks scales with the width of the photospheric lines so that the disks are equatorial (see also Andrillat & Fehrenbach 1982; Hanuschik 1987). An important companion observation is the typically very low variability of the polarization angle (Draper et al. 2014). It demonstrates that the orientation of the disks in space is constant, which is as expected for the equatorial planes of stars with stable rotation axes.
V/R variations denote cyclically varying ratios in flux of the violet (V) to the red (R) peak. They are typically accompanied by small changes in radial velocity (RV, McLaughlin 1961). As one of the most common medium-term (a few years) variabilities, V/R variations are the most immediate indicator of dynamical processes in Be disks. In many Be stars, V/R variations are transient with V/R-active episodes lasting for a few cycles and being separated by years or decades of V/R quiescence. Given that typical Be disks maintain their aspect angles over years and decades, the majority of these variabilities should take place within a spatially stationary disk.
Sixty years ago, McLaughlin (1962) excommunicated the first ever discovered Be star, γ Cas, from the population of V/R-variable Be stars because of its “anomalous behavior”. Forty years later, Harmanec (2002) even went a step further and called γ Cas “strange among the strange”. Both characterizations were perfectly justified at their times and have their origin in a very peculiar V/R-active episode between 1932 and 1942.
The observational history of 59 Cyg is similar but much more sparsely documented (see Barker 1979, 1982, and references therein). Barker (1979) explored a magnetic model for the peculiar V/R-active episode in the 1970s. However, while about 15±3% of all non-Be and nonsupergiant B stars have large-scale magnetic fields (Wade et al. 2021), that fraction is zero among classical Be stars (Wade et al. 2016). For γ Cas, Baldwin (1940) considered a rotational-pulsational model (see also McLaughlin 1961), which is now an obsolete predecessor of the m = 1 density-wave model discussed below (Sect. 3.2).
From the published rich optical observational database, there are no indications of major differences between the central stars of γ Cas and 59 Cyg and those of other early-type Be systems. That is, the apparent peculiarities of γ Cas and 59 Cyg most probably lie in the disk dynamics and associated geometry. Similar to many other Be stars, γ Cas and 59 Cyg are binaries with a low-mass companion that may have a significant impact on the disk. The behavior of both disks during their peculiar V/R-active episodes was very similar but seemingly unparalleled by other Be disks known until a few years ago so that the variations are sometimes called ‘spectacular’. This paper uses the term ‘high-activity phases’. The observed variations have not repeated themselves since then. Presumably because of the widespread belief that these variabilities are not intelligible, they have not received much attention in connection with the meanwhile much improved understanding of Be stars at large. Only Hummel (1998) noticed what the two stars’ offense had been that they had violated Struve’s law and their disks were no longer aligned with the stellar equator.
According to Struve’s model for Be stars, Be-shell spectra with absorption lines very much narrower than the stellar ones result when the star is viewed through the circumstellar disk, while normal Be spectra are observed at lower inclinations. γ Cas and 59 Cyg have displayed both types of spectra, which motivated Hummel ( 1998) to develop a rotating and precessing model for the disks around these stars. Apart from Pleione (see Sect. 2), the literature has not identified other stars exhibiting this kind of variability. Given that ≲30% of the early-type field B stars in the Milky Way may be (often very intensively observed) Be stars (Zorec & Briot 1997), these variations should be very rare; however, if the definition is relaxed, more cases can be found (Baade et al., in prep.) Furthermore, it is not clear whether an understanding of these events is a prerequisite for the understanding of the “Be phenomenon” at large. Therefore, this study revisits the historical observations of the high-activity stages of the two stars. To provide more context, it also describes and discusses for both stars other active phases of their disks that fully followed the temporal profile known from many other Be disks.
Together with the last blink before supernova explosions and the heating of the solar corona, the behavior of γ Cas in the optical wavelength range during the 1930s and 1940s is one of the oldest surviving problems of naked-eye astronomy. Among these, γ Cas is by far not the most important issue. But the challenge of γ Cas and 59 Cyg has the longest way to go even to a broadly shared description of the problem at hand. It is not even known whether their historical peculiar behavior is at the extreme end of what governs the Be phenomenon or whether it is merely a nuisance.
After brief introductions to the two stars in Sect. 2 and to canonical models of V/R variations in Sect. 3, Sects. 4 and 5 attempt to establish for both stars a description of the challenges posed by them. Since it would be unfeasible for many reasons, no attempt has been made to collect and reanalyze the historical spectra of γ Cas and 59 Cyg. Sections 4 and 5 are exclusively based on the measurements and descriptions available from the cited publications. Sections 4.2 and 5.1 show that atypical V/R variability merely played a secondary role in the two events. The decisive observations were the RV curves of emission lines that exhibited two cycles during which phases with maximal peak separation and shell lines alternated with single-line stages when pairs of peaks were blended. The identification of emerging patterns is the purpose of Sect. 6. Section 7 discusses various concepts explaining the patterns and finds (Sect. 7.3) that full rotations of the disk planes reproduce the RV curves. Section 7.3.6 compares γ Cas and 59 Cyg to simulations of tilting circumstellar disks. The conclusions follow in Sect. 8.
2 Overviews of γ Cas and 59 Cyg
γ Cas and 59 Cyg not only share the peculiarities that are the subject of this paper but, as is detailed in Paper II, are also the mutually closest analogs of one another in a vast variety of parameters. One of the biggest differences concerns the orbital parameters of these two binary stars (see Sects. 2.1 and 2.2) and perhaps even the nature of the companions.
Among the earliest-type Be stars, no binaries with main-sequence companions and periods shorter than ~5000 d are known (Gies 2000; Bodensteiner et al. 2020), but Bodensteiner et al. (2020, their Appendix B) discuss some possible borderline cases. An indirect indication of low-mass companions is the truncation in many Be stars of the circumstellar disk as inferred from the spectral energy distribution (Klement et al. 2019). In the ultraviolet, spectral signatures of sdO/sdB-like companions have been found (Wang et al. 2021), and in some cases the companions have also been detected by optical longbaseline interferometry (Klement et al. 2022b,a). The generally accepted explanation of these systems is that the low-mass stars are the remnants of the former primaries that have transferred most of their mass to the present B-type primary and thereby produced the extreme rotation that is another characteristic of Be stars (Rivinius et al. 2013). Higher-mass analogs of these systems are Be X-ray binaries (BeXRBs, Reig 2011) in which the companions are gas-accreting neutron stars. Lower-mass analogs may exist, but are difficult to detect and characterize. The Regulus system, containing a rapidly rotating B8 star and a prewhite-dwarf companion is one confirmed case (Gies et al. 2020; Rappaport et al. 2009), although no emission has ever been observed, that is to say the B8 star is not a Be star despite its near-critical rotation. The EL CVn-type eclipsing binary KOI-81 is another example (Matson et al. 2015).
The second big difference between y Cas and 59 Cyg only emerges in the X-ray domain. y Cas is the prototype of a small (𝒪(1%)) but still growing fraction of Be stars emitting very hard and highly variable thermal X-rays at a total flux level intermediate between Be-XRBs and the winds from highly evolved early-type stars (for a recent review see Rauw 2022). In 59 Cyg, X-rays have not been detected. It has been proposed (Smith et al. 2016) that the X-rays in y Cas and similar Be stars are the result of the interaction between a magnetic field in the disk and another one in the star with properties that makes them undetectable with current observational means. As was recently established (Nazé et al. 2022), the fraction of binaries among the stars with γ Cas-like X-ray properties is about the same as for Be stars at large. This would seem to increase the scope of binarity-based models of the X-ray properties (Postnov et al. 2017; Langer et al. 2020). However, since the fraction of binaries probably exceeds that of Be stars with γ Cas-like X-rays by an order of magnitude or more, the mere presence of a compact companion does not explain the X-rays, as exemplified by the twins γ Cas and 59 Cyg.
Hamaguchi et al. (2016) and Tsujimoto et al. (2018) tentatively proposed that the X-ray properties of γ Cas and γ Cas-like stars are the result of accretion by a white dwarf (WD) of matter lost by the B star. Recently, Gies et al. (2023) reported that the companions to γ Cas-like stars are generally not detected by observations in the UV-to-optical domain sensitive enough to find sdO/B companions and, therefore, are not likely to be sdO/B stars. Instead, these authors, too, suggested, the companions could be WDs, which would easily escape all present-day search techniques at UV and optical wavelengths. In that case, the γ Cas and 59 Cyg binaries would differ in the nature of the companion stars: an X-ray-emitting WD in γ Cas and an X-ray-faint sdOB star in 59 Cyg (Sect. 2.2).
As described in Sects. 2.1 and 2.2, both stars are characteristically distinguished from the variability known from the vast majority of all other Be stars in that their disks have temporarily intersected the line of sight as evidenced by the appearance of narrow absorption (‘shell’) lines. Because typical disk opening half-angles of Be shell stars are ≤15° (Hanuschik 1996; Cyr et al. 2015), the inclination angle of γ Cas of ~43° (Paper II) is not easily reconciled with a line of sight passing through the disk. However, if, in a binary, the equatorial plane of the primary and the orbital plane are misaligned, the disk may tilt, warp, and precess (Martin et al. 2011; Okazaki 2016; Cyr et al. 2017) or even get torn (Suffak et al. 2022).
The B8 star Pleione (28 Tau) is a third well-observed Be star with transient shell phases. Its 218 d orbital period (Katahira et al. 1996; Nemravová et al. 2010) is nearly the same as that of γ Cas but with significant eccentricity. The mass of the companion is around 0.1 M⊙. The variable linear polarization (which also includes long time intervals of roughly constant position angle) implies that the plane of the disk varies with time and indicates precession induced by the companion star (Hirata 2007; Tanaka et al. 2007). Shell phases repeat every ~35 yr (Hirata 1995). Marr et al. (2022) recently found a precession period of 80.5 yr and attributed the 35-yr timescale to the disk being regularly torn apart by the gravitational influence of the companion (see also Hirata 2007; Tanaka et al. 2007). From γ Cas and 59 Cyg no such periodicities are known. Only two shell phases each were observed, and the time intervals between them were shorter by more than an order of magnitude than in Pleione. To within the observational uncertainties and outside high-activity phases, the linear polarization of γ Cas is constant (Paper II) and that of 59 Cyg did not change over more than a decade (Sect. 5.1). Because of these differences to y Cas and 59 Cyg, Pleione is not included in the present study (see also Sect. 7.2).
2.1 γ Cassiopeiae
The most recent broad reviews of the observational history of γ Cas are in Underhill et al. (1982) and from Harmanec (2002). Pottasch (1959) compiled the most complete overview of the main facts for the time between 1890 and 1950. Cowley & Marlborough (1968) focused on a collection of optical spectra from the first half of the twentieth century.
γ Cas (= HR 264 = HIP 4427 = HD 5394) is a star of spectral type B0.5 IVe (Slettebak 1982) with a parallax of 5.94±0.12 milliarcseconds (mas) (van Leeuwen 2007). Harmanec et al. (2000) derived a mass of ~13 M⊙, and Stee et al. (2012) found 14–18 M⊙, a range also considered by Harmanec (2002). Given the prominence of γ Cas in the literature, it surprises that the stellar v sin i is only poorly known. Slettebak’s value of 230 km s−1 (Slettebak 1982) is clearly too low, perhaps because at the time of his observations in 1979/80 the disk was already well developed. This can affect hot Be stars like γ Cas more strongly than cooler ones because, in He I lines, the two emission peaks are typically fully within the photospheric profile, probably because in disks around hot stars He I line emission forms out to larger radii where rotation is slower. Harmanec (2002) found 380 km s−1, and Chauville et al. (2001), who discussed the difficulty of the measurements, suggested 432±11 km s−1 for v sin i. The discrepancies and the small number of measurements might be an indication of near critical rotation (when different lines can yield different values, Townsend et al. 2004) although, on average, critical rotation may be more widespread among later spectral subtypes (Rivinius et al. 2013). At a first glance, the critical equatorial velocity (vcrit) of 489 km s−1 published by Chauville et al. (2001) appears consistent with near-critical rotation but cannot be reconciled with a disk inclination angle of 43±3° (see next paragraph) unless disk and stellar equator are strongly misaligned. This conflict nearly vanishes if the v sin i of Chauville et al. (2001, 432±11 km s−1 ) is combined with vcrit = 577 km s−1 from Frémat et al. (2005), who corrected the observations for gravity darkening but also derived an inclination angle of 76.4°.
Analyzing near-infrared long-baseline interferometry data, Paper II determined the disk inclination angle at times with little or no V/R activity to be 43±3°. The time baseline of broad-band polarimetry is even longer, and, from the combination of the two datasets, Paper II concludes that the orientation in space of the disk of γ Cas was invariant for decades.
The companion to γ Cas is only indirectly detected. It has an orbital period of 203.5 d, roughly one solar mass and was proposed to be a helium star (Nemravovâ et al. 2012). This companion resonantly excites a permanent two-armed oscillation (Borre et al. 2020, Paper II). Wang et al. (2017) cross-correlated 227 International Ultraviolet Explorer (IUE) spectra of γ Cas with template sdO model spectra in the temperature range from 27.5 to 55.0 kK. Because of the large number of observations and the well-known orbit, they could derive a low upper limit of 0.006 on the UV flux ratio. This work did not consider that the flux of the companion may be attenuated by circumstellar gas. Hints at this possibility were found by Peters et al. (2016) from an orbital-phase dependence of the cross-correlation signal for HR 2142. More recently, Gies et al. (2023) suggested that the nondetection of the companions and the X-ray properties of γ Cas and γ Cas-like stars can be simultaneously accounted for if the companions are WDs.
The present separation, a, of the two stars in γ Cas corresponds to ~35R★ if the radius of the Be star, R★, is about 8–10R⊙ (Stee et al. 2012; Harmanec 2002). With these numbers, the size of the Roche lobe of the Be star amounts to ~0.6 × a ≈ 21R★ (following Eggleton 1983), and the disk truncation radius is ~0.5 × a ≈ 17 R★ (following Okazaki & Negueruela 2001). The spectral energy distribution (SED) of γ Cas indicates a truncation-like drop in density around 35 equatorial radii (Klement et al. 2017) but also suggests the presence of matter outside the companion’s orbit (Klement et al. 2019). Recent numerical simulations not specifically targeting γ Cas (Rubio et al., in prep.) confirm that neither Roche limit nor truncation radius are hard cut-offs.
The 203.5-d binary has a visual companion with an angular separation of ~2.1 arcsec. These and further astrometric observations were examined by Roberts et al. (2007). These authors did not confirm the companion reported by Gontcharov et al. (2000) to cause a motion of the photocenter of γ Cas with an amplitude of ~0.150 arcsec, semimajor axis 46 au, and period >60yr.
After the high-amplitude second V/R-active episode in the 1930s (Sect. 4.2), γ Cas lost its emission lines (almost) completely. As described in Paper II, the disk has been steadily growing, with very few setbacks, since the mid-1940s until very recently, that is through the third V/R-active episode between 1969 and 2003 and reaching a plateau ~20 yr ago but probably slightly fading and reddening in B – V since ~2019. For many decades, γ Cas has been following a linear (apparently slightly bi-valued) relation between V magnitude and (B – V) color (Paper II). The star is brightest when reddest as expected from the VDD model (Haubois et al. 2012, see also Marr et al. 2018) for stars with intermediate inclination. On short timescales, TESS detected several pulsation frequencies (Nazé et al. 2020; Labadie-Bartz et al. 2021) grouped in an overall pattern similar to that of other Be stars (Labadie-Bartz et al. 2022).
de Roy (1936) compiled visual magnitude estimates between 1879 and 1901 from the Harvard archive, when the mean of 230 estimates was 2.25 mag with most individual values lying between 2.2 and 2.3 mag, that is close to the level found by Rigollet (1936) before the high-activity phase. de Roy (1936) also added estimates from Ptolemy through al-Sufi, the Herschels, and Argelander to Flammarion. Not one of the values listed is less than 1.67 mag (the historical minimum magnitude in the 1930s was ~ 1.3 mag, Sect. 4.2.5) in spite of the presumably large measuring errors. The same holds for the broad historical discussion by Edwards (1944). On these grounds, it seems likely that the coincidence of historically unique variations in brightness and line-emission strengths in the 1930s/40s (Sect. 4.2.1) represents their combination to a single event.
2.2 59 Cygni
The B1 IVe star 59 Cyg (= HR 8047 = HIP 103632 = HD 200120) is a binary with a period of 28.2d (Peters et al. 2013; Maintz et al. 2005; Harmanec et al. 2002; Rivinius & Štefl 2000; Tarasov & Tuominen 1987). Unlike the secondary in γ Cas, that in 59 Cyg was directly observed, and its UV spectrum resembles that of an sdO star which contributes 4% of the UV flux (Peters et al. 2013). Peters et al. determined an RV amplitude ratio of about 10:1 while Maintz et al. (2005) found ~5:1. The reason for the difference is presumably that the optical spectra analyzed by the latter authors carry strong signatures of interaction between the companion and the disk around the primary. If the mass ratio is ~1:10, the mass of the companion is below the Chandrasekhar limit so that the system would not be a progenitor of a Type II supernova and BeXRB. Maintz et al. (2005) and Peters et al. (2013) derived very similar eccentricities of 0.11 and 0.14, respectively, which, therefore, might not be too strongly affected by gas streams in the system. Especially if the progenitor system has gone through a common-envelope phase, significant eccentricity is not expected, and Harmanec et al. (2002) discussed circumstances that may lead to spurious eccentricity measurements. Peters et al. considered that the third star in the system may be responsible. As discussed by Hutter et al. (2021), the orbital period of this outer component is ~165 yr (see also Harmanec et al. 2002).
As for γ Cas, the rotational velocity of 59 Cyg is uncertain. The value of 260 km s−1 published by Slettebak (1982) is again too low, perhaps underlining the peculiarity among early-type Be stars mentioned in Sect. 2.1. Harmanec et al. (2002) found a previous measurement of a stellar v sin i of 450 km s−1 confirmed. However, that value is based on UV spectra (Hutchings & Stoeckley 1977) and possibly affected by the stellar wind. Chauville et al. (2001) measured 379 ± 22 km s−1, which could be consistent with intermittent shell phases if, given the short orbital period of 28 d, a misalignment between the Be-star’s equator and the orbit of the secondary could temporarily tilt and/or warp the disk away from the equator (Suffak et al. 2022). On the other hand, if 450 km s−1 is a realistic value for the projected stellar rotation velocity of 59 Cyg, it is the same as the maximum v sin i value observed in persistent shell stars (Rivinius et al. 2006) so that the question arises why 59 Cyg is not a persistent shell star. (Persistent shell stars may temporarily lose their narrow shell absorptions, but, then, the emission lines disappear as well.) The Gaia DR2 parallax of 59 Cyg, namely 2.51 ± 0.32 mas (Gaia Collaboration 2018), is well consistent with the HIPPARCOS measurement of 2.30 ± 0.42 mas (van Leeuwen 2007). However, the Gaia EDR3 value of 1.47 ± 0.37 mas (Gaia Collaboration 2020) differs quite strongly from both.
Over the past decades, Hα profiles in the BeSS database1 (Neiner et al. 2011) have not exceeded a peak-to-continuum (E/C) ratio of ~2.2, in agreement with the long-term record traced by Harmanec et al. (2002). The much lower emission level than in γ Cas may be due to the large difference in separation of the component stars, which in 59 Cyg is 73.3 R⊙ (Peters et al. 2013) but in γ Cas amounts to about 350 R⊙ (Sect. 2.1) and so leaves much more space for a large disk.
The not very rich observational history of 59 Cyg in the decades before the shell episodes in the 1970s was summarized by Doazan et al. (1975), Hubert-Delplace & Hubert (1981), Barker (1982), and in Underhill et al. (1982). In addition, Burbidge & Burbidge (1951) found a major increase in the strength of the Balmer emission compared to ~15 yr before 1949. Outside high-activity phases, the emerging picture is that of an active Be star like many others. In particular, the overview in Underhill et al. (1982) concluded that the emission-free phase in 1917 was not preceded by unusual activity so that the disk dissipated quietly as is typical of Be stars at large (e.g., Marr et al. 2021).
In the (B – V) versus V color-magnitude diagram, the star seems to stay all the time close to a single straight line (with some scatter) from bright and red to blue and faint (Harmanec et al. 2002). The trajectories in this diagram of Be stars are driven by the growth and dissipation of the disk in response to the viscous redistribution of matter within the disk and as well as to variations in the mass-injection rate. Since the shape of these paths is quite sensitive to the disk inclination angle (Haubois et al. 2012; Marr et al. 2018), it is interesting that the photometric overall behavior of γ Cas (Paper II) and 59 Cyg is qualitatively very similar. This would argue against v sin i values at the high end of the range discussed above.
A quick analysis (TR, unpublished) of space photometry with BRITE (Weiss et al. 2014) and SMEI (Jackson et al. 2004) detected the orbital period with a strong amplitude of 0.02 to 0.025 mag. TESS space photometry (Ricker et al. 2015) also shows clear variability at the orbital period (JLB, unpublished). TESS observed 59 Cyg for ~50 consecutive days, so not even two binary orbits were covered. Yet, the brightness amplitude varied significantly from one orbit to the next (up to a max - min amplitude of 4% in units of relative flux). In the combination of power spectra from all three satellites, distinct frequency groups appear (the strongest two centered near 1 and 2 c d−1, and a weaker third group near 3.9 c d−1; JLB and TR, unpublished) like in many other Be stars (Labadie-Bartz et al. 2022), where they are due to multimode nonradial pulsation.
Between 1992 and 2004, Draper et al. (2014) observed constant V-band polarization (see Sect. 5.1). Therefore, the orientation of the disk in the sky remained constant through some moderate long-term increase of Hα emission strength (with some minor fluctuations, Harmanec et al. 2002). However, in Draper et al.’s sample of eleven Be stars, 59 Cyg was one of two stars, which exhibited rapid activity across the Balmer discontinuity. γ Cas was one of the other nine stars. The difference may be due to a more edge-on orientation of the disk around 59 Cyg.
3 Disk oscillations
One- and two-armed disk oscillations are successful in qualitatively describing the ubiquitous V/R variability of Be stars. Radiative effects from a hot companion can lead to superficially similar symptoms. These phenomena can account at most partly for the anomalous variations observed in γ Cas 1932–1942 (Sect. 4.2) and in 59 Cyg 1972–1976 (Sect. 5.1). However, at other times, both stars have also exhibited variations that are explained by oscillations in the circumstellar disks, and such density waves may provide useful context for the understanding of the more unusual activity. Therefore, the basic concepts and symptoms are introduced in this section. In Sects. 4 and 5 they are projected onto the historical observations of γ Cas and 59 Cyg, respectively.
The best tracer of V/R variability is typically the strongest Balmer emission line with clear double-peak structure. In disks around hot Be stars, V/R activity may also be seen in helium lines but confusion with local irradiation by a hot companion is possible. Especially in dense disks, V/R variations are additionally seen in metal lines (e.g., Rivinius et al. 2006; Chojnowski et al. 2018). Measurements of the peak separation are likewise useful to probe the disk structure and dynamics, and the positions (RVs) of the peaks and the central reversal were found to correlate with the V/R cycle in simulations by Escolano et al. (2015). Time dependencies can be used to infer radial migrations of physical conditions in the disk. Small orbitally phase-locked signals in polarization may also be present (Panoglou et al. 2019).
3.1 Two-armed (m = 2) density waves resonantly excited by a companion
Through their gravitational forces, companions to the central stars of Be disks can induce the development of a two-armed (m = 2) spiral structure that is resonantly coupled to the orbit, that is propagates in space with the orbital period (Panoglou et al. 2018; Cyr et al. 2020, and references therein). The most conspicuous observational diagnostic is the violet-to-red (V/R) intensity ratio of the two emission peaks which traces the azimuthal density distribution in the disk and its propagation. In a resonant situation, the V/R frequency should be twice the orbital frequency. However, if the two-armed symmetry is broken by the companion, significant variability occurs also with the orbital period as discussed by Borre et al. (2020, see also Panoglou et al. 2018). The difference between the two arms decreases with increasing misalignment of the planes of the orbit and the disk (Cyr et al. 2020). Moreover, the appearance of V/R variations is viewing-angle dependent, and, at intermediate disk inclination angles, flat-topped emission profiles with marginal V/R variability can develop in Hα (Panoglou et al. 2018). V/R variability with the orbital period can also be due to irradiation by the companion (Stefl et al. 2000; Hummel & Štefl 2001; Maintz et al. 2005) and difficult to conclusively distinguish from an m = 2 density wave with two arms of different properties. Oscillations in brightness may accompany V/R variability, but usually are hard to detect as the expected signals are small (Panoglou et al. 2016). 59 Cyg is an exception, as photometric variability at the orbital period is clear in space photometry (Sec. 2.2). However, its attribution to dynamical and/or radiative effects from the companion is still pending.
Per revolution of a perfectly symmetric m = 2 pattern, emission-peak separations are expected to reach two minima, when the arms are viewed in conjunction, and two maxima, when the arms are seen at greatest elongation. For V/R variations to occur with the orbital period as seen in 59 Cyg, a significant difference between the two arms would be required. One of the best-observed cases of m = 2 variability in a Be disk is that of HD 55606 which develops shell absorptions twice per orbit, probably forming in overdense regions of the two arms (Chojnowski et al. 2018). In agreement with numerical simulations (Panoglou et al. 2018; Cyr et al. 2020), it is resonantly excited by the companion star. Changes in emission-peak separation clearly seen at half the orbital period support the m = 2 interpretation whereas the V/R ratio varies with the full orbital period (see Figs. 7 and 8 in Chojnowski et al. 2018).
In addition to azimuthal perturbations, and especially when the disk and orbit are coplanar, gravitational interaction with the companion will truncate the disk (Panoglou et al. 2018, and references therein). Truncation does not mean that the disk radius is trimmed to a hard limit, but around the truncation radius the density drops significantly. For coplanar orbits, this truncation radius is often about halfway between the two stars (or equivalently, about 0.8 times the Be star’s Roche lobe, Panoglou et al. 2016). Inside the truncation radius, the slope of the radial density profile is reduced, i.e., additional matter is accumulated. This accumulation effect might be related to the observation that, on average, disks around BeXRBs are denser than in Be stars without neutron-star companion (Reig et al. 2016, and references therein).
As long as the disk is not too feeble and/or the separation of the two stars is not too large, orbital modulations of the disk structure should be quasi-permanent. However, often these variations are not detectable against the background of higheramplitude variations due to any m = 1 density waves which, however, are more volatile.
3.2 One-armed (m = 1 ) disk oscillations
Owing to the rotationally distorted gravitational potential of the central star, V/R variations can also develop without obvious influence by a companion star. Models as well as interpretations of observations seem to exclusively invoke one-armed (m = 1) disk oscillations as their origin. However, long series of spectra with good cadence are few in number.
Johnson (1958) considered apsidal rotation of an elliptical orbit around an oblate star. Papaloizou et al. (1992) suggested that the gravitational quadrupole moment of the rotationally flattened central star drives disk oscillations. Okazaki (1997) confirmed this conclusion for late-type Be stars but found that radiative forces are required to maintain the oscillation modes confined. In a later development of the theory, Ogilvie (2008) concluded that radiative line forces are not needed to explain the modes, as long as the vertical structure of the perturbation is taken into consideration. Carciofi et al. (2009) applied Okazaki’s model to the high-inclination Be-shell star ζ Tau. The model was later improved, using Ogilvie’s formalism, by Escolano et al. (2015).
In all model variants, the disk needs to be (nearly) Keplerian2, and the gas particle orbits are elliptically distorted. A lower-density region near the star and a higher-density region farther away develop owing to Kepler’s third law. In azimuth, they are 180° apart, leading to the eponymous one-armed structure of an m = 1 density wave. Depending on the position angle of the wave, double-peaked emission-line profiles that, in a point-symmetric disk, are equal can have V/R ratios different from unity. The strong bilateral asymmetry of m = 1 waves usually causes much higher V/R amplitudes than the more balanced m = 2 density waves. V/R variations and shifts in RV result from the precession of the argument of periapsis of the particle orbits. In Fig. 3 of Okazaki (2016), the density maximum appears at a radius of ~2.5 stellar radii and is offset from the stellar equatorial plane by -3 scale heights. If the scale height varies like a disk opening angle of 10°, the vertical offset corresponds to 1.3 stellar radii. Since the angle from the nominal equatorial plane to the perturbation is arctan(1.3) or about 35°, the density enhancement could yield a maximum shell obscuration at i = ~55°.
Apart from the time-resolved combination of spectroscopy with interferometry (Berio et al. 1999; Carciofi et al. 2009), the observational evidence for the spiral structure (helicity) consists of (variable) phase differences between lines formed at different radii (e.g., Kogure et al. 1981; Mennickent et al. 1994; Wisniewski et al. 2007). Both observations (Telting et al. 1994; Mennickent et al. 1997; Berio et al. 1999) and models (Carciofi et al. 2009) find support for the theoretical expectations for flat disks (Papaloizou et al. 1992; Ogilvie 2008) that the density waves are prograde, i.e., propagate in the direction of the rotation.
Since disk oscillations are a dynamical process, their ultimate observational hallmark is the RV variability mentioned above. McLaughlin (1961) found that the observed RV curves of V/R-variable Be stars can typically be described as the V and R peaks and central depressions being maximally shifted blueward (redward) when V/R is at minimum (maximum). The maximum displacement of the central depressions does not exceed that of the emission peaks, and the latter can be low even in the presence of significant V/R amplitudes (Mon et al. 2013, EW Lac). Another well documented example is β1 Mon; Telting et al. (1994) modeled the observations by Cowley & Gugula (1973) as a prograde m = 1 density wave. Model line profiles from Hanuschik et al. (1995) and Okazaki (1996) confirmed roughly parallel shifts of the emission-peak and central-depression RVs as a signature of m = 1 density waves; this is explained in Okazaki (2016). However, Escolano et al. (2015) could not reproduce the RV curves for the Be-shell star ζ Tau, especially that of the central depression in Hγ.
The typical timescales of m = 1 density waves are years, that is much longer than most orbital resonances, and, at one time or another, develop in most classical Be stars (McLaughlin 1961; Hirata et al. 1981; Mennickent & Vogt 1991; Okazaki 1997). As for other oscillation processes, the frequency of m = 1 density waves increases with density (and likewise as the density gradient becomes shallower as the disk approaches an asymptotic steady state, Oktariani et al. 2016). The concomitant V/R variations are not strictly periodic and normally only last for a few cycles during which the amplitude initially rises and later is damped out (e.g., McLaughlin 1961; Cowley & Gugula 1973). One-armed V/R-active episodes are interleaved with V/R-quiescent phases of globally comparable duration during which only m = 2 density waves may be seen. Low-amplitude m = 1 disk oscillations and a shorter orbitally resonant m = 2 variability are not uncommon to coexist (Štefl et al. 2007, see also Sect. 5.2). Model calculations suggest that one-armed disk oscillations are particularly pronounced in the presence of a steep radial density gradient (Okazaki 1993).
4 The historical V/R-active episodes of γ Cas
The historical accounts by Curtiss (1916) and Edwards (1944) discuss photometric and spectroscopic variations of γ Cas, including V/R variations, in the century before the second V/R-active episode in the 1930s. There are many reports of variations during this time. None of them concerned anything similar to the series of events in 1932–1942, and they do not seem to convey information that could help understand these latter events.
Since the discovery of its emission lines (Secchi 1866), γ Cas has gone through at least four V/R-active episodes. Checking archival spectrograms, Lockyer (1933a) and Edwards (1944) found V/R variations in Hγ and Hδ in the 1890s, which seems to be the first established V/R-active episode. Only the last decade of the second episode in the 1920–1940s earned y Cas the reputation of being anomalous. Its observational record in the optical wavelength range is far more detailed than that of the third V/R-active episode between 1969 and 2003, which, qualitatively, was not any different from the V/R-active episodes of most other Be stars. The fourth of these episodes is still on-going (into the beginning of 2023) and the best observed, thanks to the dedication and efforts of amateur spectroscopists. These most recent data will be discussed in Paper II (Labadie-Bartz et al., in prep.).
Several earlier studies, especially of the second V/R-active episode and before, have considered the possibility of periodic changes. However, the variations of all circumstellar features are clearly just cyclic (see also the discussion by Harmanec 2002). The only confirmed periodic phenomena are due to the orbital motion (Nemravová et al. 2012), the resonantly excited m = 2 disk oscillation (Borre et al. 2020), and stellar pulsations (Labadie-Bartz et al. 2021).
The peculiar variability, which this paper tries to explain, only concerned the second (Sect. 4.2) V/R-active episode. Since the observational record available for the second episode is much more complete than that for the third, the third V/R-active episode (Sect. 4.1) is described first. Paper II is dedicated to the fourth of these episodes.
4.1 The third V/R-active episode (~1969–2003)
At the end of the second V/R-active episode, after rapid, irregular variations in Balmer and helium emission lines in the early 1940s (Hase 1942; Peachey 1942, 1943), the Balmer emission began to fade to near-invisibility or perhaps even disappeared completely (Belorizky & Fehrenbach 1947; Smith & Struve 1950; Burbidge et al. 1952; Edwards 1956; Cowley et al. 1976). From the available data, it seems impossible to reconstruct whether the implied loss of the circumstellar disk was due to the temporary cessation of the injection of matter into the disk, some kind of destruction of the disk, or both. Around this time, the star became bluer (Vanderkerkhove 1947; Hiltner 1941; Edwards 1942). The first observation of new Ha emission seems to have been obtained in 1946 (Belorizky & Fehrenbach 1947). Following a steep but decelerating decline of the AAVSO visual light curve to ~2.8 mag in the mid- to late 1940s, the brightness has since been continually increasing to a plateau of ~2.15 ± 0.05 mag maintained over the past 20 yr. Unlike the second V/R-active episode in the 1930s/40s, the third one from 1969 to 2003 left no major fingerprint in the light curve. Figure 5 by Harmanec (2002) shows a hump with a few 0.1 mag amplitude around the beginning of this episode. It does not appear in Fig. 1b compiled by Doazan et al. (1983), is perhaps marginally visible in the AAVSO light curve, and not covered by Howarth (1979).
The third known V/R-active episode began around ~1969 (Doazan et al. 1983; Horaguchi et al. 1994; Harmanec 2002) and lasted through ~2003 (Gerhartz 2017). The cycle length was initially about 3.4 to 5 yr (Cowley et al. 1976; Telting et al. 1993) but later increased to seven to eight years (Miroshnichenko et al. 2002; Rivinius et al. 2006), exceeding the orbital period of 203.5 days by an order of magnitude. The V/R variations were roughly symmetric about unity with a maximum amplitude above the ambient continuum in Hß of about four (Telting et al. 1993). The V/R variability in Hß was accompanied by similar modulations of the Ha emission strength (Miroshnichenko et al. 2002; Harmanec 2002). This behavior is completely missing from the schematic sketch in Fig. 1a of Doazan et al. (1983, see also Underhill et al. 1982) which shows cyclic brightness variations only during the second V/R-active episode.
In contrast to the emission strength, Telting et al. (1993) could not detect any obvious correlation between V/R ratio and visual magnitude of γ Cas. Berio et al. (1999) inferred an associated prograde one-armed (m = 1 ) spiral structure from long-baseline optical interferometry performed in 1988, 1991, 1993, and 1994. It was no longer detected in observations from 2008 to 2010 (Stee et al. 2012). After 2003, the V/R activity ceased. Starting in 2002, the equivalent width (EW) of Hα recovered from a significant increase (decrease in emission strength3) that had begun in 1996 and accelerated in 2000/2001 (Gerhartz 2017).
The description given by Miroshnichenko et al. (2002) of the RV variations of Fe and He peaks matches the typical m = 1 pattern (Sect. 3.2). The behavior of the Hβ peaks was similar (Doazan et al. 1983), and the latter authors and Hummel (1998) attributed the variations to a one-armed density wave. The peak separations were approximately constant (Miroshnichenko et al. 2002).
In agreement with the m = 1 spiral density-wave paradigm, observations of this third V/R-active episode showed that Si II λ6347 lagged He I λ6678 by about 100–200 d in V/R, and both lines were strongly out of phase with Hγ (Rivinius et al. 2006, their Fig. B.2). From a V/R phase delay of Hα relative to He I λ5876 and Fe II λ5316, Gerhartz (2017) concluded that an inner disk density enhancement preceded the outer disk by about 300 d. At least in 1988/89 (Horaguchi et al. 1994) and in 1993 and 1995 (Harmanec 2002), the Hα emission line was single-peaked with a ‘wine-bottle’ profile roughly matching class L2 in the classification scheme of Hanuschik et al. (1996). By contrast, between 2004 and 2010, that is right after the second V/R-active episode, the Hα profiles observed by Gerhartz (2017) looked roughly flat with weak indications of two peaks, in agreement with observations by Nemravová et al. (2012).
Following earlier work by Doazan et al. (1987), Telting & Kaper (1994) extended the investigation of the V/R variability in Hβ to the contemporaneous strength of discrete absorption components (DACs, also known under the more interpretative designation Corotating Interaction Regions [CIRs]) of UV wind lines. Variable DACs are commonly seen in all types of hot stars with radiatively driven winds (Howarth & Prinja 1989) and indicate nonstationary deviations in density and/or ionization from a smoothly accelerating wind flow. This wind flow is intrinsically very highly unstable so that even minor perturbations can produce major effects (Sundqvist et al. 2018), and the tracing of DACs to their origin can be a challenge even in the presence of (quasi-)periodic modulations/triggers. In Be stars, the incidence and especially the share of DACs in the total equivalent width of UV resonance lines are particularly high (Grady et al. 1987).
Telting & Kaper (1994) analyzed line profiles of the N Vλλ1238,1242, Si IVλλ1393,1402, and C IVλλ1548,1550 doublets in 133 IUE spectra of γ Cas, which covered two half-cycles with V/R > 1 and one with V/R < 1 between 1978 and 1989, that is part of the third episode of V/R variability known for γ Cas. They found that in phases with V/R > 1 (V/R < 1) ~ 80% (~ 20%) of the UV spectra exhibited DACs. Moreover, the column densities of the DACs were ~2–3 times higher when V/R > 1. Accordingly, the line-of-sight wind mass-loss rate of γ Cas is apparently higher when V/R > 1 than when V/R < 1.
4.2 The second V/R-active episode in the 1920s to 1940s
It is useful to recall the observational means available before the 1960s. Spectrographs normally employed one prism, sometimes two. With a dispersion of ~50 Å/mm at Hγ, the spectral resolution was around 1 Å. The spectra were recorded on photographic plates, which were mostly blue-sensitive and only occasionally covered Hα. Later, grating spectrographs with higher (and linear) dispersion were built, and photographic emulsions with lower granularity became available. Only some of the early publications on y Cas include microdensitometer tracings; a rich collection is available from Baldwin (1941b) for Hδ profiles between 1927 and 1940. In the sometimes also published photographic reproductions of spectroscopic plates, many details got necessarily lost.
Photometry of bright stars often relied on visual eye estimates. For bright stars, they are hampered by the lack of nearby comparison stars of similar magnitude and color. Without neutral-density filter, photomultipliers and solid-state detectors saturate even with small telescopes. Moreover, some comparison stars later turned out to be variable (Sect. 4.2.5). Standard passbands for multicolor photometry were not yet defined or in broad use. However, from calibrations with standard stars of the spectral response of photographic emulsions, it was possible to measure flux gradients and so estimate color temperatures (Edwards 1943).
Many of the original observational reports for γ Cas mention significant variability within a few days or even a single night; some examples are presented in the following subsubsections. This does not surprise for visual magnitude estimates. But photographic spectra are also implied, and observers were firm in their assertions. The timescales were too short and the observing cadences were generally too low to expect simultaneous observations. The only major exception are the descriptions by Hase (1942), Burbidge (Peachey 1942, 1943), and Edwards (1956). But their overlap in time is less than half a year. The agreement especially between the reports by Hase and Burbidge is remarkable (see Appendix A). In any event, for the extraction of the big picture from the historical reports, only multiple observations, ideally by different observers, should be relied on. However, this cautionary remark is not to cast any doubt on the reliability of the historical observations. In fact, the observers have demonstrated impressive care and skill in dealing with a phenomenon that even today is hard to grasp.
Broad end-to-end overviews of this stage in the history of γ Cas were given by Baldwin (1939b), Edwards (1956), and Pottasch (1959). To complement these mostly chronological, loglike accounts, the following subsubsections describe the episode by observables.
In addition to these reviews, there are several dozen original observational publications for almost all of which the SAO/NASA Astrophysics Data System (ADS4) hardly lists a handful of citations. Regrettably, not even scans are available for the publications in Russian. Scans of some other papers are lacking the last page(s). The SIMBAD bibliography (Wenger et al. 2000) is extremely incomplete for the time interval in question because SIMBAD’s focus is on publications that appeared after the foundation of the Centre de données astronomiques de Strasbourg in 1972.
4.2.1 Overview
Already before the onset in 1932 of the high-amplitude activities, the disk of γCas was clearly developed as can be deduced from the long series of flux-calibrated Hδ profiles published by Baldwin (1941b). The same conclusion results from the description in the same paper of the appearance of the photospheric lines toward the end of the episode when the emission lines had largely disappeared. Baldwin found “a clearing of the atmosphere to such an extent that the broad underlying hydrogen absorption lines appeared about 10 times as strong as in 1927–1932”. In other words, the stellar spectrum was already before 1932 strongly veiled by the disk (cf. Sect. 4.2.6). The correct explanation of veiling is discussed in Sect. 7.3.3 but does not affect the conclusion. In the VDD context (Haubois et al. 2012), the latter is also supported by the elevated visual brightness (Sect. 4.2.5).
That y Cas was developing new activity was detected on account of increased V/R variations in 1932 (Sect. 4.2.4) and by visual photo metry in 1936 when the star had substantially bright-ened (Sect. 4.2.5). Between 1932 and 1942, two high-amplitude V/R cycles were observed. The second of them attained higher amplitudes in almost all observables. On the other hand, toward its end, the emission strength faded very steeply but also briefly recovered in 1939, making the identification of cyclic activity difficult.
This second V/R-active episode exhibited several notable differences with respect to the third V/R-active episode (Sect. 4.1). Firstly, the earlier V/R-active episode comprised only little over two V/R cycles spanning roughly a decade while the later one consisted of about five cycles in ≲35 yr. Secondly, in the third V/R-active episode, the V-band light curve at most had a single initial bump of ~0.3 mag (it does not appear in all photometric compilations, see Sect. 4.1) whereas the large brightening in 1936 happened around the beginning of the second V/R cycle in this episode and strong, mostly irregular photometric variability continued thereafter. Thirdly, shell phases developed in 1935/36 and in 1939/40 (Edwards 1956) with sharp absorption lines from metastable levels (Struve & Elvey 1940) appearing at high strength. An important and closely related fourth difference is that not only were there shell phases but they alternated with single-peak stages of all emission lines.
The fifth difference is that, at the end of the second V/R-active episode, the emission lines disappeared for some years whereas at the end of the third one they only decreased temporarily somewhat in strength and continued the growth thereafter. The sixth difference seems closely connected to the previous one and distinguishes γ Cas also from what is known from most other Be stars in that, during the rapid fading of the emission lines in the 1940s, their overall structure changed several times drastically within very few days. If there are any causalities in this behavior, they are not known. Disks may dissipate because the star no longer supplies enough matter to preserve it, or they may be dynamically destroyed, or both. In simulations of isolated Be stars, the termination of the mass supply alone does not lead to rapid instabilities (Haubois et al. 2012). Because many Be stars temporarily lose their disk, strong changes in mass-injection rates would indicate long-term cycles in stellar activity as discussed in Paper II and by Baade & Rivinius (2020) and previously stressed by Doazan (e.g., in Underhill et al. 1982). In γ Cas, there would have been two such cycles in the observational database. The first one started before the discovery of emission lines in 1866 and ended in the 1940s when the second one started, which is still on-going.
The dynamic and structural relevance of these six differences for the disk between 1932 and 1942 can only be deduced from the series of spectra which appear to trace two main activity cycles. However, on the one hand, it seems hardly possible to extract a comprehensive and comprehensible picture from verbal descriptions of the complex variability of the various spectroscopic parameters. On the other hand, the temporal sampling of some parameters is too low for a meaningful X/Y-diagram-like representation. Therefore, Table 1 and Fig. 1 attempt a hybrid, semi-graphical approach with a bin size of 2 months. In order to highlight the cyclic character of the variability, they do not use numbers but merely identify the extrema of the quantities included. These are local extrema that mostly had fairly different absolute values in the two main cycles. In most observables, the second cycle was stronger than the first one but dropped very steeply toward its end. The temporal sampling of the original observations is inhomogeneous so that the true widths in time of the extrema are rather uncertain. In the final phases of this V/R-active episode of γ Cas, WW II took its terrible toll.
Notes. Where applicable, the data mainly pertain to Hβ, Hγ and/or Hδ. Exceptionally, the sign is dropped from the EW so that higher EW means stronger line emission. ‘emiss. width’ stands for the width of emission lines in general, not just peak separations. ‘Y’/‘y’ means that a feature was present (clearly/weakly). n denotes the last member of the Balmer lines seen in emission. Fields were filled with ellipses when there was no extremum, no detection or no observation. From Europe and North America, γ Cas is circumpolar and visible at an airmass less than 2 between June and March. Figure 1 provides a more graphical presentation of the same data.
The backbones of the information in Table 1 and Fig. 1 are the original studies by Cleminshaw (1936), Baldwin (1939b, 1941b); Baldwin & Torp-Smith (1941), and Peachey (1943) Overarching context is provided by the reviews by Baldwin (1939b), Edwards (1956), and Pottasch (1959). Other sources used include, but are not restricted to, Lockyer (1935), McLaughlin (1936), Cherrington (1938), Heard (1938), Baldwin (1940, 1941a, 1942), Struve & Elvey (1940), Hase (1942), Edwards (1943), Smith & Struve (1950), and Howarth (1979). In many instances, the conversion of textual and graphical information into the tabular format required judgment and interpolation as well as consolidation of differing sources. This was done with care but mistakes, also due to lack of comprehension of some statements, cannot be excluded, and completeness is not guaranteed.
Only a few of the historical publications put more than two or three observables into a direct common context. One exception is Edwards (1944) who wrote: “… when the magnitude, emission intensities, number of Balmer lines and radial velocity are at a maximum, the V/R ratio is near a point of inflection; it is decreasing, and not far from unity (that is V=R)”. He did not mention a time but the independent compilation in Table 1 and Fig. 1 reproduces this quintuple constellation around mid-1937.
Time dependence of very broadly defined local extrema (MAX/min) of main observables of γ Cas during its high-activity episode in 1932–1942.
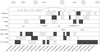 |
Fig. 1 Graphical rendition of Table 1. The thumbnails at the top schematically indicate the inclination of the disk. Any changes in PA due to precession are not included. Exceptionally, the sign is dropped from the EW so that higher EW means stronger line emission. |
4.2.2 Emission-peak separations
At the time of the second V/R episode, it was already well known that V/R cycles are widespread in Be stars (McLaughlin 1932) although a firm explanation was still lacking. Therefore, y Cas distinguished itself from all other previously observed Be stars in that during both high-amplitude V/R cycles between 1932 and 1942 the separations of all double-peaked emission lines showed one minimum and one maximum each (this decisive point was not mentioned in the broad review by Harmanec 2002). The other peculiarity, namely the shell phases in 1935/36 and 1939/40, is described in Sect. 4.2.3.
Changes in peak separation (PS) were first reported by Heard (1935) for 1934, who did not find them on earlier plates, but probably already started shortly after the onset of the strong V/R variations in 1932 (Edwards 1956). Prior to that, the RV curves of the emission peaks and the central depression had been roughly parallel without noteworthy changes in width (Cleminshaw 1936), in agreement with an m = 1 density wave (Sect. 3.2). Series of separate RVs of the two emission peaks are only available starting 1935 April (Baldwin 1939b). During the minima, the two emission peaks merged into one at the spectral resolution used, and many of the original observers referred to the ‘single-line stages’, which literally peaked in 1933/34 and 1937 (Table 1 and Fig. 1), as convenient timestamps. Since the high-amplitude V/R variability had the same cycle length as the PS variations, it is important that the RV curves of emission peaks and edges were roughly parallel (but very different for the V and R parts of the profiles), as this fact implies that the PS variations were real and not an artifact of the changes in V/R.
In the Balmer RV curves presented by Baldwin (1939b), the (mirrored) RV curve of the violet peak was ahead of the red one by as much as half a year. In all other ions, similar phase differences are not obvious. Since the V/R amplitudes of these lines were lower, the phase lags between the two Balmer peaks may be related to a detail which Baldwin (1940) suggested as the explanation. It concerns V/R variations of relative absorption-wing intensities in Hδ and other Balmer lines which were essentially in phase with the V/R curves for the Hδ emission. The absorption was enhanced on the side adjacent to the stronger emission component (Hase 1942 noticed the same phenomenon but, owing to the much shorter timespan of her observations, not the variability). The absorption edge on the side of the weaker emission component was apparently not affected until the emission components reversed intensities. Where present, phase differences between the V and the R peaks make it difficult to measure the PS in a meaningful quantitative way.
In all ions, the amplitudes of the PS variations were well over a factor of 2 and much more if the V and R RV curves actually crossed. Whether, during the single-line stages, such a crossing did happen or whether the two emission components swapped their identity but kept the sign of their RVs with regard to the systemic velocity, was debated. The interpretation as a crossing was advocated by Lockyer (1935), who quite carefully described the way he arrived at this conclusion. Cleminshaw (1936) and Baldwin (1939b, 1942) disagreed and interpreted the violet and the red RV curves as merely approaching one another and after their separation having swapped their strengths. This critical matter is discussed in Sect. 7.3.1.
In 1937, Baldwin (1938) observed that, within -5 weeks, the single-line stage was first reached by hydrogen, then by He I, next by Fe II, and finally by Si II. During the single-line stage in 1933/34 and the largest peak separation in 1936, such a spread was not seen (Baldwin 1939b).
Baldwin (1939b) also noticed an interesting difference in the behavior of the two emission-peak RV variations at the end of 1936: ‘After the date of maximum width both components gradually approached one another more or less smoothly except for an oscillation on the velocity-curve of the red component around JD 2428500. This fluctuation was real and was shown with differing degrees of strength by the corresponding curves of all elements. It was least marked for hydrogen and Fe II. In no case did the violet component show a corresponding change’.
Toward the end of the second shell phase, in 1940 Sept./Oct., strong departures from double-peaked emission lines developed. Burbidge (Peachey 1943) found up to five superposed emission components with irregular night-to-night variability. Because these features appeared close to the positions of the broad emission components, it is intuitive to consider them emission components. However, the structure might also have been caused by multiple absorptions. If they were due to self-absorption, a similarly large volume would be involved as for multiple emission components. In the case of absorption of stellar light, the rapid variability could be easier to understand owing to the much more confined volume.
4.2.3 Shell absorptions
The second conspicuous difference between the behavior of γ Cas and all other Be stars known at the time was the occurrence of one shell phase with narrow absorptions in each of the two high-amplitude V/R cycles, namely from the 3rd quarter in 1935 through the 3rd quarter in 1936 and from the 1st quarter in 1939 through the 3rd quarter in 1940, respectively. Because the shell lines appeared and went away during phases of persistent line emission, this variability is fundamentally different from normal Be-shell stars in which the presence of line emission and shell absorption is tightly correlated. In both instances, the emissionline separations were around their respective maximum. The first shell phase attained its maximum strength in 1936 April, that is two months before the strong photometric brightening. Only Baldwin (1941c, 1942) commented on slightly deepened central depressions between the Balmer emission peaks in 1933, which he attributed to another shell phase.
As only relatively few spectra covered Ha, the strongest shell line was typically He I /3889, which is a blend with H8 (Hζ) at 388.91 nm, arises from a metastable lower level, and was the first to exhibit shell properties. In the first shell phase, only H and He lines acquired shell attributes. In the second shell phase, the central extra absorption components were much stronger and occurred in a vast number of lines of all common ionic species including Ca II H and K (Baldwin 1941c) so that the shell character of γ Cas was as pronounced as in the persistent shell stars known at that time. But the prevalence of higher-excitation lines such as from Fe III was higher in γ Cas. The second shell phase in γ Cas faded more slowly but under strong fluctuations (sometimes from night to night, Hase 1942; Peachey 1943; Edwards 1956, see especially Fig. 1 in the first reference). The shell components were described as very narrow and mostly not resolved (Baldwin 1941c).
In persistent shell stars, the RVs of the narrow absorptions are typically relatively close to the stellar RV. Already in the first shell phase of γ Cas shell RVs down to −65 km s−1 or even more negative developed with time5. The most negative velocities were displayed by He I λ3889 in which line the shift to negative velocities happened very abruptly (Baldwin 1939b) while some other He lines moved into the opposite direction. The blueshifting of Balmer and other lines was smoother. In 1940, that is the second half of the second shell phase, the measured RVs were close to the systemic velocity (Smith & Struve 1950).
4.2.4 Emission-line strengths and shapes
Owing to the sparse coverage by the observations of Hα, the He I line at 587.56 nm was sometimes the most prominent emission line in the observed spectra. First observations of it go back to the time around the detection of line emission by Secchi in 1866 (Edwards 1944).
While Balmer lines had been in emission for years, first new He I line emission formed around 1933 April. A first maximum in strength was seen at the time of the following single-line stage. All emission lines dropped below visibility in the early to mid-1940s. Interestingly, the strong brightening in 1936 June (Sect. 4.2.5) was not accompanied by major changes in the emission lines. However, just two months before, in 1936 April, the first shell phase reached its maximum (Sect. 4.2.3) and the emission strength a local minimum.
The other variations in emission-line strength were integral parts of the two high-activity cycles and fell into three categories, namely (a) one in E/C coupled to the peak separations (Sect. 4.2.2), (b) one in EW (with the mean of the V and R E/C values as a proxy), and (c) one in V/R. The Hδ profiles (calibrated in units of the continuum flux) published by Baldwin (1941b) conveniently visualize the verbal descriptions below. They cover the time from the end of 1928 until 1940 August and include both shell phases (in 1935/36 and 1939/40, Sect. 4.2.3) and both single-line stages (in 1933/34 and 1937, Sect. 4.2.2). The original observers did not correct their EW and E/C measurements for variations in the continuum flux, and the present study does not attempt such renormalizations retroactively.
When the pairs of emission peaks were blended, their fluxes added up, and the combined peak intensity was higher than before or after; this is category (a) above. As Baldwin (1939b) reported, around these single-line stages, the two emission peaks got sharper and were finally unresolved; this was particularly pronounced in blue Si II lines, where the prismatic dispersion was largest. As the result, many weaker emission lines appeared only during these phases. The Balmer discontinuity also increased in emission (Baldwin 1939a; Edwards 1956).
The original observers (e.g., Cleminshaw 1936) were undecided whether there was any additional enhancement in flux (decreasing EW) during the single-line stages. Several of them (e.g., Baldwin 1939b) tended to support the idea. Perhaps, this was due to the sharpening of the two components before they blended in the single-line stage (Baldwin 1939b) which might have increased their E/C values. The situation was much clearer when the peaks were at their maximum separation and shell absorptions were present: both peaks were substantially reduced in strength compared to the times before and after.
Weak cyclic V/R activity (category (c) above) in Balmer lines was already observed starting in 1924 (Lockyer 1933b; Edwards 1944). It seemed indistinguishable from similar variability in many other Be stars (cf. Sect. 3.2). However, without any obvious phase discontinuity in the cyclicity, the V/R amplitude quickly increased in 1932 to substantial levels (Lockyer 1933b). The variations were largest in hydrogen but nearly undetectable in helium (Baldwin 1939b). Many characterizations of the V/R amplitudes depended on eye estimates (e.g., Cleminshaw 1936), and some observers also used nonnumerical scales (Lockyer 1935). Maxima in V/R occurred around 1933 December (≲2.5 in Hγ, Hδ) 1937 June (≲3.5) and maxima in R/V near 1935 October (≲2.3) and 1938 October (≲3); it is noteworthy that the V/R curve prepared by Harmanec et al. 2002, their Fig. 5, only shows the first V/R cycle (the second one is missing). Also, Near both shell phases, log(V/R) changed sign, and the extrema appeared close to the single-line stages.
In the spectroscopic variability of γ Cas in the 1930s/40s, several indications of a spiral disk structure developed. Baldwin (1939b) measured V/R phase lags, which in Hγ – Ηδ and Hβ – Hγ amounted to 60 and 80 days, respectively. Presumably the same phenomenon was seen in 1936 when, in the Balmer lines, the V/R ratio increased toward higher series members (Heard 1937).
Apparently, the differences were not only between different ions. For Fe II, Baldwin (1939b) described differences (seemingly not reported by other observers) between different multiplets: ‘The V/R-curve for the average of all lines visible in the b4P – z4D0 multiplet6 was similar to those of hydrogen, although of lesser amplitude. It preceded the Hδ-curve by about 150 days. The average curve for the b4F – z4F0 multiplet7 was in phase with the hydrogen-curves but was peculiar in that the two components tended to be equal. The b4F – z4D0 curve8 was similar to that for the b4P – z4D0F multiplet but showed a tendency to approach unity just before the single-line stage. The lines of the first multiplet thus behaved like the hydrogen lines; those of the second resembled the He I lines in behavior; while those of the third were similar in their changes to the Si II lines’.
4.2.5 Continuum flux
The published eye estimates of the magnitude probably suffer from systematic differences between the magnitude scales used, personal equations of the observers, variable comparison stars, and annual variations (Howarth 1979; Harmanec 2002). The only early series of photoelectric measurements is from Huffer (1939) and has a different spectral sensitivity.
The photometric coverage of the first high-amplitude V/R cycle of γ Cas is patchy. Rigollet (1936) published two dozen estimates from mid-1928 through mid-1935 but with a gap from the last quarter of 1931 to the end of 1934; the last 22 of them have a value of 2.20 mag. In 1936, that is around the beginning of the second high-amplitude V/R cycle, Baize (1936) reported that γCas appeared as the visually brightest star in the W of the constellation Cassiopeia; from July through October, the brightness increased from 1.85 mag to 1.65 mag. Later, Cherrington (1937) mentioned prediscovery plates from 20 June 1936 in which Nassau measured magnitudes of 1.24 and 1.35 mag, respectively. Visual light curves (covering different time intervals) are available from Cherrington (1938), Huffer (1939, photoelectric measurements), Ashbrook (1940), Baldwin & Torp-Smith (1941), the AAVSO database9, and the compilations by Pottasch (1959), Howarth (1979), and Harmanec (2002). After a steep drop between 1937 May and December by more than 0.5 mag, photoelectric photometry found a very broad, much shallower maximum around ~1.6mag in 1938 August (Huffer 1939). Thereafter, the decline continued at a roughly constant lower rate, and in 1940 attained a minimum brightness of ≳2.8 mag about which value it kept hovering through the late 1940s (with a shallow maximum in 1941/1942).
Some of the light curves in the cited references seem to be schematic sketches rather than data diagrams. They are qualitatively consistent but quantitatively only in a limited way (for instance, the zero point of the time axis in Pottasch’s Fig. 2 appears to be shifted). These uncertainties will have propagated into Table 1 and Fig. 1.
A unified set of a long series of spectrophotometric gradient measurements was published by Baldwin (1941a). The absolute temperatures derived from them are no longer of much interest, but the relative changes with time are. Especially Baldwin (1939b, 1941a, Baldwin 1942) stressed that visual brightness and color temperature were anticorrelated, that is the star was brighter when redder. In the Gaia DR2, Be stars are the only stars that get brighter when redder (Gaia Collaboration 2019). This is well explained by the VDD model (Haubois et al. 2012). In γ Cas, elevated reddening was seen already in the year before the visual maximum (Baldwin 1942). Edwards (1943) reported that, during the peak of the 1939/1940 shell phase, the color temperature reached a minimum. Thereafter, there were ‘various fluctuations’ that roughly corresponded with the color changes. He also found that the larger the color temperature was, the fewer Balmer lines were seen in emission. Between late 1939 and late 1941, the number of Balmer lines observed in emission was lower than even in 1932. However, this may at least partly be due to the much reduced emission strength.
4.2.6 Visibility of the stellar spectrum
All observers described the lines of the stellar spectrum as very broad and diffuse and, therefore, well distinguished from the circumstellar features. There is no report on variable stellar lines.
However, observers frequently mentioned changes in the visibility and contrast of the stellar lines. This concerned especially the line wings that disappeared, but sometimes the entire stellar spectrum was hardly seen. The observers called this effect ‘veiling’.
The variability of the veiling seen in γ Cas was comprehensively described by Edwards (1956) and the following description relies on his review unless indicated otherwise. He found that the veiling increased as the star approached the first single-line stage in 1934 and that the visibility of the stellar spectrum improved thereafter. During the second single-line stage of γ Cas in 1937, the broad absorption lines were very faint or absent, except for He I λ3820, ‘showing nearly complete veiling of the photosphere in the longer wavelengths’. In 1935, near the beginning of the 1935/36 shell phase, the veiling reached a sharp minimum. Around the second shell phase in 1939/40, when the emission strength had faded strongly, ‘the broad absorptions were stronger and wider than at any previous period’. This was seconded by Baldwin (1941b) who noted for the same time ‘a clearing of the atmosphere to such an extent that the broad underlying hydrogen absorption lines appeared about 10 times as strong as in 1927–1932’, that is before the strong V/R activity and much increased line emission.
Figures 2 and 3 of Baldwin (1940) illustrate a strong positive correlation between the width of the photospheric absorptions and the separation of the Hδ emission peaks. Therefore, the veiling was strong during the single-line stages (Baldwin 1940; Edwards 1956) and weaker when shell lines were present.
4.3 The fourth V/R-active episode (from 2018 to 2023)
Around 2018, a fourth V/R-active episode commenced in γ Cas. Up to the end of the 2021/22 observing season, all amplitudes were lower than in the second and third V/R-active episodes. The first years of this latest V/R variability are comprehensively documented and discussed in Paper II. The activity seen so far is close to the main-stream V/R variability of Be stars, except for (i) the unusually short V/R cycle length of ~3 yr, which rapidly further decreased to the orbital period (~200 d), and (ii) the temporary appearance of sharp emission components on top of the regular ones. Such sharp emission components also appeared in the second V/R-active episode (Sect. 4.4). However, while in the fourth V/R-active episode these components led to temporary decreases in the overall PS, this was not the case in the second V/R-active episode when they were noticed for the first and – until recently – only time.
4.4 Temporary sharp emission components
While all main characteristics described above of the variations of the circumstellar lines are common to both γ Cas and 59 Cyg, one phenomenon developed in γ Cas in the 1930s/40s that seems unique in the entire literature on Be stars. Curiously, the corresponding observations were apparently not referenced in any of the many later studies of γ Cas, with the sole exception of Pottasch (1959). But a new transient instance was discovered recently (Paper II).
It is useful to cite verbatim the two most detailed original descriptions of the phenomenon in the 1930s/40s. There seems to be almost no quantitative information. Burbidge & Burbidge (1955) reported the following: ‘In γ Cas, during a time of rapid spectral variations, the emission lines had appeared as very strong single lines in 1937, after which they separated again into two components. In 1938, shortly after this separation, a second pair of emission peaks developed in the space between the normal pair. This happened not only in the H lines, but also in the lines of He I, Si II, and probably Fe II and Mg II as well’. The same features were also noticed by Baldwin (1939b) who mentioned that they were hardly wider than the instrumental profile and ultimately merged with the main components. They were best visible between 1938 April and August but perhaps even 2 months later. In some of his diagrams, Baldwin sketched in the RVs of the sharp components during the third quarter of 1939, when they were less separated than the main components but the V+R means were about the same in both sets of lines.
Edwards (1956) wrote: ‘Some interesting changes in the H-emission lines began on 21 October, 1940, when a new pair of components appeared, lying outside the original pair. They were faint and very narrow, with a wide separation, and were visible down to Hγ or Hδ. They persisted for some months, with varying intensity and V/R, while the original (inner) pair appeared to merge into a single line and gradually faded out by June, 1942’. This fading marked the end of the second V/R-active episode. The light curves sketched by Baldwin & Torp-Smith (1941) and Edwards (1956) do not contain features clearly coincident with the time intervals when the secondary emission components were present.
The observations with the highest time resolution of sharp components are available from Burbidge (Peachey 1942) and concern the year 1940:
“October 14. A pair of narrow emission lines on the red side of each of the lines He I 4471 and 4026, in the place of the broad emission, are just apparent”.
“October 24, 25, 29; November 7, 10, 12. The pair of narrow emission lines beside He I 4471 and 4026 strengthening, and then dying away again”.
According to Burbidge (Peachey 1943), the two pairs of sharp emission components seem to have each developed from single broad, faint, and not always visible emission features. The separation of the two sharp emissions fluctuated between ~2.5 and ~ 4Å (~170 to ~300 km s−1), accompanied by strong changes in strength. The redshift of their common center was 4.81 Å (~360 km s−1) for He I /4026 and 4.13 Å (~280 km s−1) for He I / 4471. That is, the most extreme redshifts were of order +500 km s−1. After a month, the two features no longer appeared significantly displaced. Hase (1942) also reported broad offset emission but only mentioned He I 4471.
The descriptions by Burbidge (Peachey 1943) and Hase (1942) of the sharp components are consistent with that by Edwards (1956) if his wordings ‘lying outside the original pair’ and ‘original (inner) pair’ exclude that the sharp lines formed an outer pair bracketing the original (‘normal’) one. If so, it is not clear whether the sharp lines seen in 1938 and 1940 are of a comparable physical nature. Since in both 1938 and 1940 the sharp components were well offset from the regular ones, measured separations of the regular components will not have been strongly affected by the sharp components (unlike during the fourth V/R-active episode; Sect. 4.3). Moreover, on both occasions, the sharp components were a transient phenomenon existing for a few months only so that they are not the cause of the overall pattern of the variations in PS (Sect. 4.2.2).
Inspection of archival and new spectra from 2013 to 2022 (when emission levels were near a historical high; Paper II) found no indication of emission lines slightly redward of the two helium lines. Therefore, confusion of the 1940 sharp components with some other double-peaked emission appears unlikely.
Notes. Where applicable, the data mainly pertain to Hβ, Hγ, and/or Hδ. Exceptionally, the sign is dropped from the EW so that higher EW means stronger line emission. ‘emiss. width’ stands for the width of emission lines in general, not just peak separations. ‘H’ and ‘HH’ denote high and very high values, ℓ and ℓℓ low and very low values, respectively; both on scales applicable to 59 Cyg during this period. ‘Y’/‘y’ means that a feature was present (clearly / weakly). n is the number of Balmer lines seen in emission (E) or absorption (A). Fields were filled with ellipses when there was no extremum, no detection or no observation. From Europe and North America, 59 Cyg is visible at an airmass of less than two between March and January.
Time dependence of absolute values of main observables of 59 Cyg during its high-activity episode in 1972–1976 and shortly before and after.
5 The historical V/R-active episodes of 59 Cyg
5.1 The first V/R-active episode (1972–1976)
A few scattered Hβ profiles from the 1960s reproduced by Herman & Hubert (1976) and Hubert-Delplace & Hubert (1981) clearly show V/R asymmetries. In 1964 and 1967, Hβ was hardly visible at all, neither in emission nor in absorption. The Balmer emission of 59 Cyg returned significantly starting in 1971 and was attributed to an ‘explosion’ (Duval et al. 1975). Doazan et al. (1975) discovered shell absorption components in lines from hydrogen, He I, and various singly ionized metals in 1973 June. They had not been observed a year before, and by 1973 December relatively strong emission had developed in Hβ, which was asymmetric but not resolved into two peaks (Hubert-Delplace & Hubert 1981). A second shell episode occurred in 1974 October and reached its maximum 2 months later (Barker 1982). By 1975 June, the shell spectrum had again mostly vanished and the Balmer emission was slightly enhanced. The first Hα E/C measurement shown by Harmanec et al. (2002, their Fig. 4) is from 1974, that is between the two shell phases, and had the highest recorded value (~3.7). Two years later, line emission in Hα had become very faint but soon began to recover steadily.
Hβ and He I λλ4026,4471 profiles and tracings of the Balmer series starting at H15 are available from the work of Hubert-Delplace & Hubert (1981; note that Herman & Hubert 1976 showed a subset of the Hβ profiles but the indicated direction of the wavelength axis is wrong). Additional Balmer and He I profiles as well as tracings of representative optical spectra between ~465 nm and the atmospheric cutoff were published by Barker (1982). In the tracings of spectra near the single-line stage, the Balmer discontinuity appeared in emission but less strongly than in γ Cas (Sect. 7.3.5).
The observations of 59 Cyg by optical spectroscopy around the shell events as subjectively extracted from verbal descriptions, figures, and measurements by Doazan et al. (1975), Herman & Hubert (1976), Hubert-Delplace & Hubert (1981), and Barker (1982) are compiled in Table2 and Fig. 2. Whenever possible, preference was given to the lowest Balmer lines. Table 2 is much more sparsely populated than Table 1 for yCas and so has a different structure. It probably brackets the event but the beginning and end of the activity can only be crudely guessed.
Apart from the transient shell absorptions, the second anomaly during the active phase of 59 Cyg in the 1970s is a deep minimum in 1974 May (that is between the two shell phases) in the separation of the two peaks in all emission lines (Barker 1982). At this time, Hδ consisted of a single peak even in the higher-dispersion spectra of Hubert-Delplace & Hubert (1981). If the profiles shown by these authors are in units of relative flux as opposed to plate density, which is probably the case, the single peak was higher than the sum of the peaks in any double-peaked profile of the series. Six months earlier, V/R was greater than unity, 4 months later less than unity. A third conspicuous observation concerns RVs found by Barker (1982) in the shell absorption as negative as −70 to −80 km s−1 with regard to the star in 1974 September to November. The measurements by Hubert-Delplace & Hubert (1981) from December are 20–30 km s−1 less negative and in 1975 January were close to the near-stellar shell RV in the shell-discovery spectrum in 1973 June.
Table 2 and Fig. 2 suggest that the V/R variations were slow and had a timescale of years. However, it is not excluded that this is merely an artifact due to the poor temporal sampling of the V/R variability locked to the 28.2-day orbit (Sect. 5.3). In any event, unlike in γ Cas, there is no indication that the changes in emission-peak separation were phase-coupled to V/R cycles.
Contrary to y Cas, the shell phases of 59 Cyg could be, and were, also observed in the space UV. Marlborough & Snow (1980) gave a chronology of the main events between 1972 and 1975 and compared two Copernicus U2 scans (wavelength range: 95–145 nm, spectral resolution: ~0.02 nm) from the beginning of the first shell event (1972 October) and the late stage of the second one (1975 November), respectively. It should be noted that these data are of much higher technical quality than the ground-based photographic spectra. The flux level of the first Copernicus observation was lower everywhere, by more than 10% in some regions. Since from 1972 June to 1973 June (when the shell was discovered in an optical spectrum) there had been a drop by more than a magnitude in UV flux (Beeckmans 1976), the variability seems to be part of the shell event. In agreement with this, Hubert-Delplace & Hubert (1981) cite a private communication from Gilra that in 1974 December (during the second shell phase) the UV flux measured with the Astronomical Netherlands Satellite was about 1 mag lower than in 1975 November and December (when there was no shell).
Similarly to the optical wavelength range, the first Copernicus UV shell spectrum included many narrow Fe III lines. A second class of exophotospheric lines are due to highly ionized species and have very broad blue wings, signifying a fast wind that is typical of Be stars (Grady et al. 1987, 1989) but much less pronounced than in more evolved hot stars. In the second Copernicus spectrum, the Si III wind lines had disappeared, those due to Si IV were much weaker, and Ni V lines had became much stronger.
This simultaneous presence of photospheric, shell, and wind lines has powered one of the most intense historical disputes about the nature of Be stars. It led to the formulation of the dogma by some that the regions of formation of these three types of lines correspond to radially distinct zones in a roughly spherical envelope. Interferometry (Quirrenbach et al. 1997) has proven this (quasi)spherical notion wrong. But there is concern that this fierce controversy has prevented the proper exploitation of the substantial archive of observations with IUE of Be stars at large. Nevertheless, this database established that, on average, winds from Be stars are stronger than from main-sequence non-Be stars, and the UV observations of 59 Cyg constitute one of the strongest empirical arguments in support of radiative ablation of the disk as a contributor to winds from Be stars (see Sect. 7.1). The results of coordinated monitoring of UV wind lines and the Ha emission in 59 Cyg some years after the shell phase (Doazan et al. 1980, 1985, 1989) are an important pillar on which this conclusion is based (see Sects. 5.2 and 7.1).
Most remarkably, Marlborough & Snow (1980) found the shell lines substantially broadened, namely to around 200 km s−1 (full width at half maximum) in the first Copernicus spectrum and probably ~80km s−1 in the second one, when the shell features were much weaker. These numbers are about an order of magnitude larger than measured in Fe II λ5169 (which is intrinsically narrower) by Rivinius et al. (2006) in some persistent shell stars. Doazan et al. (1975) and Hubert-Delplace & Hubert (1981) did not report measured widths of the optical shell lines observed by them in the first shell episode. But their (possibly hand-drawn) line profiles appear consistent with the above unusually high values. (The tracings by Barker 1982 from the second shell episode have a coarser wavelength scale but the width of the shell features may also have been high.) Marlborough & Snow considered turbulence as the explanation, which would have been highly supersonic. For the wind lines, they report structural changes that do not seem uncommon in Be stars and so cannot with any certainty be attributed to the shell events. A relation to the latter is more likely for the partly drastic drops with shell prominence in the absorption EWs of some wind lines and would be in agreement with the lower wind strength in persistent Be-shell stars (Grady et al. 1987).
Several observations of the continuum polarization exist; all measurements below are uncorrected for interstellar polarization:
1975 May, λλ 6510-6525 Å: polarization degree p = 0.83%, polarization angle PA = 24.9° (Poeckert & Marlborough 1976)
1975 August, λ3440 Å: p = 0.35%, PA = 13.6° (Poeckert et al. 1979)
1975 August, λ4060 Å: p = 0.49%, PA = 21.9° (Poeckert et al. 1979)
1976 September, λ7800 Å: p = 0.05%, PA = 151.7° (Poeckert et al. 1979)
1976 September, λ8490 Å: p = 0.03%, PA = 146.0° (Poeckert et al. 1979)
1983 August, V band: p = 0.57%, PA = 103.6° (Huang et al. 1989)
1992 May to 1994 August (six measurements), V band: p = 0.33–0.42% PA = 107.3° – 115.0° (Draper et al. 2014)10
1995 July to 2004 September, V band (five measurements): p = 0.32–0.44% PA = 114.7° – 122.4° (Draper et al. 2014)11.
The vanishingly low polarization in 1976 September is consistent with the low and probably declining Hα emission a month before (Table 2 and Fig. 2); it also implies that the then measured PA carries no information. By contrast, the line emission was higher in mid-1975, such that then (and at all other times) the measured polarization was (mostly) intrinsic to 59 Cyg. In view of the different wavelength ranges, a change in PA between 1975 May and August, i.e., during the high-activity phase, cannot be inferred with confidence. The observations obtained between 1992 (if not already 1983) and 2004, i.e., long after the high-activity phase, also form a consistent set but the PAs differ by ~90° from the earlier measurements (comparison of data obtained with the same instrumentation for other Be stars at the above and other epochs found them to be consistent among all four publications involved).
The optical light and color curves by Harmanec et al. (2002) show no data between the beginning of 1967 and the end of 1976 (this time window includes the two shell phases) and again between mid-1980 and mid-1982. Probably the star was bluest and faintest around mid-1976, that is at the end of this V/R-active episode, when the Hα emission strength seems to have been lowest. Underhill et al. (1982) report the minimum in Hα emission strength for the end of 1977, Harmanec et al. (2002) for the beginning of 1977. This coupling between color and magnitude is in agreement with the VDD model (Haubois et al. 2012). According to Underhill et al. (1982), the previous time that 59 Cyg was observed without emission lines was 1917 so that 1917 and 1977 bracket a long stellar activity cycle similar to those in γ Cas (Sect. 4.2.1). The descent in Hα emission strength to the minimum in 1977 was not only steep but from a much higher level than ever observed at other times (see Fig. 4 of Harmanec et al. 2002). The maximum in E/C of ~3.75 was around mid-1974, i.e., roughly half a year after the middle of the second shell phase, but there are no earlier measurements.
 |
Fig. 2 Graphical rendition of Table 2. The thumbnails at the top schematically indicate the inclination of the disk. Any changes in PA due to precession are not included. Exceptionally, the sign is dropped from the EW so that higher EW means stronger line emission. |
5.2 The second V/R-active episode (1979–1987)
The long-term spectroscopic variability between 1978 and 2001 was documented by Doazan et al. (1985) and Harmanec et al. (2002). V/R variability began ~1979; after ~3 cycles, the Hα emission returned to symmetry in 1987 (Doazan et al. 1989). As part of the line-profile variability, the entire emission-line complex shifted to the red when V/R > 1 and to the blue when V/R < 1 (Doazan et al. 1985) and so exhibited the typical m = 1 signature (Sect. 3.2).
During the three V/R cycles, observations with IUE between 1978 and 1987 (Doazan et al. 1989) revealed a very strong correlation of the Hα V/R ratio with the EW of the C IV λλ1548.2,1550.8 resonance-line doublet formed in the wind. In the latter lines, the high-velocity range was affected most with drastic changes in the overall line profiles which also exhibited strong transient DACs. The extrema of both quantities occurred at about the same time. Changes in the wind structure on hourly to daily timescales were only marginally detected. At the end of the 1978–1987 interval, both the Hα emission and the C IV absorption were stronger than before. The behavior of the N V λλ1238.8, 1242.8 doublet was mostly similar to that of the C IV lines.
Barker (1983) obtained Hα profiles in 17 nights between 1980 April and November. In the V/R ratio, he considered a 28-day period (consistent with the later discovered orbital period, see Sect. 2.2) but discarded it on account of apparent phase shifts. This description is supported by his Fig. 1. According to Fig. 1 in Doazan et al. (1985), the underlying long-term V/R variability was in a roughly symmetric phase during Barker’s observations but may nevertheless be responsible for the apparent phase shifts. A series of 17 Hα profiles from two consecutive nights in 1980 August and characterized by a symmetric flat-topped profile did not reveal any significant short-term variations.
This second V/R-active episode of 59 Cyg has not been mapped by photometry. From their literature search, Harmanec et al. (2002) found that there may have been brightness fluctuations by up to a few tenths of a magnitude.
5.3 Orbitally locked disk variations
From spectra probably all obtained in the mid-1990s, that is after the slow variability in the first V/R-active phase had ceased, Harmanec et al. (2002) confirmed Rivinius & Štefl (2000) who had found sinusoidal V/R variability with the orbital period of 28.2 d in He I λ6678. The Hα profiles shown by Harmanec et al. suffer from telluric absorption and are either flat-topped or single-peaked and as such quite different from those in 1980 (Barker 1983). But in this line, too, symmetry variations with the orbital period were present in the 1990s. After prewhitening for other variabilities, Harmanec et al. also detected photometric variability with the orbital period in data spanning the time from 1982 to 2001. The peak-to-valley amplitude in V was about 0.015 mag.
Maintz et al. (2005) analyzed 116 echelle spectra (including the 48 spectra studied by Rivinius & Štefl 2000) that were observed between 1990 and 2002. According to the V-band photometry collected by Harmanec et al. (2002), most of the spectra happened to be obtained during a broad dip of the light curve. The coverage by color data is less complete but suggests a quiescent phase. A 28.2-day binary period was unambiguously present in the He I λ6678 emission and relatively emission-free absorption lines. The emission variability was dominated by a single emission peak moving across the line profiles with the orbital period. The phasing suggests that this peak is formed in a region facing the companion and heated by it. The presented He I λ6678 double-peaked emission line profiles and the Hα and Hβ EWs do not indicate any major long-term variability. Most importantly, the separation of the – not considering the small orbital Doppler shifts – quasi-stationary double-peaked emission lines appears roughly constant.
The BeSS spectra between 1992 July and 2021 October show that no new m = 1 mode of appreciable amplitude developed, nor did any shell features. Figure 3 presents the observations since 2003 August phased to the orbital period. The small range between ~1.8 and ~2.2 of the E/C ratio in Hα agrees with that in earlier years (Harmanec et al. 2002). Although the data are noisy, because the emission is weak, the V/R variability in He I λ6678 due to the irradiation by the hot companion (Maintz et al. 2005) is visible, but variations in amplitude may have occurred. Because of this effect, it is very difficult to diagnose any orbitally locked m = 2 oscillation in this star, although Hβ may have been undergoing asymmetry variations with half the orbital period. Neither type of short-term variability provides intuition for the understanding of the high-activity phase of 59 Cyg in the 1970s.
 |
Fig. 3 Hα (left panel, 188 original BeSS spectra), Hβ (middle panel, 110 original BeSS spectra), and He I (right panel, 57 original BeSS spectra) profiles of 59 Cyg folded with the orbital period of 28.192 d. The Hα profiles are sampled in bins 0.02 wide in phase. Phase 0 corresponds to the RV minimum as in Maintz et al. (2005). In addition to orbital phase, the scale of the ordinate also indicates the flux in units of the ambient continuum level. For the Ha (Hβ) profiles it was reduced by a factor of 7 (2), and the helium lines were not rescaled. These observations are from 2003 August through 2021 October. |
6 Variability patterns
At one time or another, both γ Cas and 59 Cyg have exhibited variabilities that are indistinguishable from the ubiquitous slow V/R activity of Be stars at large. This concerns the beginning of the second V/R-active episode (Sect. 4.2), all of the third episode (Sect. 4.1), and at least the onset of the still on-going fourth one (Paper II) in γ Cas, and in 59 Cyg it is the second V/R-active episode (Sect. 5.2). In all four cases, roughly parallel shifts of pairs of emission peaks and the central depression between them toward the respective weaker emission component have been observed; this means that an m = 1 density wave was excited. Outside these episodes, but when the disks were also well developed, the Hα emission profiles typically had a flat top in γ Cas while there was no such distinction in 59 Cyg.
In either star, orbitally locked variations have also been observed. In γ Cas, a persistent m = 2 mode is resonantly excited (Borre et al. 2020). The same may be true for 59 Cyg. But, in the presence of strong irradiation effects by the much closer hot companion (Sect. 5.3), this could be difficult to ascertain. The signature of phase-locked changes in the emission lines of 59 Cyg undergoes long-term variations but may be persistent (Sect. 5.3).
For the high-activity phases of γ Cas and 59 Cyg (Sects. 4.2 and 5.1, respectively), a number of commonalities and correlations, either between both stars, between the two cycles of γ Cas or between all, emerge from the analysis of Tables 1 (γ Cas) and 2 (59 Cyg) and the underlying literature:
There were up to two directly consecutive cycles of anomalous activity (γ Cas and 59 Cyg).
The lengths of these cycles were ≲2 (59 Cyg) and ≲4 yr (γ Cas).
Each cycle alternated between a single-line (when pairs of emission lines were not resolved) and a shell stage separated by time periods without these features (γ Cas and 59 Cyg).
During shell phases, the visibility of the stellar absorption lines was increased (the veiling was at a minimum); the visibility was reduced during single-line stages (γ Cas [and 59 Cyg?]).
Near (but obviously not at) single-line stages, the peaks of emission-line pairs were narrower (γ Cas and 59 Cyg).
Single-line stages happened close to, but not exactly at, V/R maxima (γ Cas).
During single-line stages, the Balmer discontinuity appeared in emission (strongly in γ Cas, more weakly in 59 Cyg).
Shell phases occurred when the peak separations were at maximum (γ Cas and 59 Cyg) and V/R ≈ 1 (γ Cas).
RVs of shell lines were variable and reached high negative velocities (γ Cas [first high-activity cycle only] and 59 Cyg [second V/R cycle only?]).
Around shell phases, emission lines were weaker (higher EW and/or lower E/C; γ Cas and 59 Cyg).
V/R and R/V ratios varied between 0.5 and 2 (59 Cyg) or more (γ Cas).
Not-cyclic variations in common to both stars include:
At the beginning of the high-amplitude V/R variations, the Hα emission was high (γ Cas and 59 Cyg), after decades of growth (γ Cas [and 59 Cyg?]).
After these V/R-active episodes, the line emission largely disappeared (γ Cas and 59 Cyg).
Only for 59 Cyg could it be established that the UV flux was significantly diminished during shell phases. Space observations were not possible for γ Cas.
Some observables exhibited variations that were not shared by the two stars and/or the two cycles of γ Cas include:
Contrary to γ Cas, log(V/R) had different signs during the two shell phases of 59 Cyg.
It is not clear whether the V/R cycle length in 59 Cyg was roughly the same as the time difference between the two shell phases.
Any cyclic component of the photometric variability of γ Cas only accounted for a small fraction of the total range (photometry not available for 59 Cyg).
Only the V/R variability appears in both lists. It is striking that, with the exception of the V/R activity and phenomena only observable in 59 Cyg from space, the variabilities during the high-activity phase of 59 Cyg are a full subset of those of γ Cas. However, the temporal sampling available for 59 Cyg is much worse.
7 Discussion
The phenomena during the second V/R-active episode in γ Cas (Sect. 4.2) and the first one in 59 Cyg (Sect. 5.1) are fundamentally different from their other V/R-active episodes, when m = 1 density waves prevailed that are standard in many other Be disks. (Paper II will report variations in the still on-going 4th V/R-active episode of γ Cas, see Sect. 4.3.) The peculiarities are the subject of this section which draws its main fact base from the compilation of the commonalities in Sect.6. In γ Cas, an m = 1 density wave probably existed also at the time of the onset of the high-activity phase in 1932 (Sect. 4.2). For 59 Cyg, there is a single observation of asymmetric Balmer emission from one year before the first shell, but it is not documented when the strong activity started and whether any transition to the high amplitude maintained the V/R phase as in γ Cas (Sect. 4.2.4).
The strong cyclic coupling of shell phases and drastically variable emission-peak separations observed in both γ Cas and 59 Cyg clearly is a hurdle that m = 1 and m = 2 density waves cannot overcome in spite of their success in explaining V/R variations at large. These phenomena are spectral symptoms, but changes in the continuum flux from the disk are an important complementary diagnostic. Comparing fully dissipated and fully developed disks, the VDD models of Haubois et al. (2012) predict a typical peak-to-valley amplitude in the V-band of ≤ 0.4 mag even for disks viewed face-on. This is consistent with the finding by de Wit et al. (2006) that, over a time interval of 5 yr, the flux excess of Be stars in the SMC did not exceed 0.8 mag in the EROS R band, which is close to the Johnson I band, where the flux excess is larger than in V. By contrast, the brightening of γ Cas in 1936, shortly after the beginning of the second cycle, reached about one magnitude (Sect. 4.2.5) from a moment when there already was a well-developed disk (Sect. 4.2.1), and the total decline until the (near-)disappearance of the emission lines amounted to ~1.5 mag. This large range does not invalidate the VDD model. But it signals that one or more elementary assumptions, on which the model is based, may not have been fulfilled by γ Cas in the 1930s/40s. Sect. 7.3.3 resumes the discussion of this matter.
The spectroscopic variations during the high-activity phase of γ Cas largely repeated, albeit at very different amplitudes, in two consecutive cycles but were not periodic. Cyclicity was much less documented and/or pronounced in 59 Cyg; the number of cycles was less than two, and not all observables may have varied with the same cycle length. Even with the hindsight of the later detections of their companions, there are no hints of orbital modulation although orbitally phase-locked variations were present at other times (γ Cas: Sect.2.1; 59Cyg: Sects. 5.2 and 5.3). However, this does not exclude that the companions had strong effects on the structure and dynamics of the disk in the case of any longer-term developments.
In the framework of m = 1 and m = 2 density waves in planar disks, a perspective for the understanding of the historical variations of γ Cas and 59 Cyg does not emerge. In a first step, the coupling of the strength of stellar wind lines to V/R phase observed in γ Cas (Sect. 4.1) and 59 Cyg (Sect. 5.2) suggests giving more attention to the third dimension of the disk. In a binary, a resonantly excited m = 2 density wave viewed close to the disk plane can lead to transient shell absorptions when one of the two arms crosses the sightline as is the case in HD 55606. In this star, two shell phases occur per orbit and are probably due to azimuthal modulation of the thickness of the disk (Chojnowski et al. 2018). For possible effects of m = 2 disk oscillations, Sect. 7.1 examines observations of optical emission lines and UV wind lines.
7.1 Correlations between optical V/R ratio and UV wind lines
The DACs observed by Telting & Kaper (1994) in the third V/R-active episode of γ Cas clustered around V/R maxima, i.e., they were more numerous and stronger. The same holds for the DACs in 59 Cyg (Doazan et al. 1989). A possibly related phenomenon is the occurrence in some shell stars of strongly perturbed Hα profiles with multiple components (often dubbed ‘triple-peak’ or ‘double-dip’; Rivinius et al. 2006, Escolano et al. 2015). Examples include HD 55606 (Chojnowski et al. 2018) and ζ Tau. ζ Tau develops such emission structures regularly, and Ruždjak et al. (2009) and Štefl et al. (2009) stressed that they only occur on the (lower) ascending branch of the V/R curve of ζ Tau; the latter authors additionally pointed out that double-dip Hα profiles seem to be restricted to shell stars, in which part of the volume of the disk can be viewed against the stellar photosphere. The V/R curve of ζ Tau was successfully modeled by Escolano et al. (2015) but they were unable to reproduce the perturbed Hα profiles and, therefore, concluded that the profile variations are not due to a canonical m = 1 density wave. Nevertheless, if the DACs in γ Cas and 59 Cyg and the double-dip Hα profiles in ζ Tau and other shell stars have the same origin, a vertical increase in disk thickness as part of an m = 1 density wave may be the smallest common denominator.
If the V/R ratio is governed by the viewing (phase) angle of the density wave pattern in the plane of the disk (Carciofi et al. 2009), the correlation found by Telting & Kaper (1994) implies that the line-of-sight wind-driven mass flow changes with the azimuth of the density-wave pattern. For a one-armed spiral (cf. Sect. 3.2) assumed by Telting & Kaper (1994), the mass-loss rate would be highest (lowest) when the highest density in the disk is roughly at quadrature and moving toward (away from) the observer. In a separate study, Telting et al. (1993) searched for a correlation between V/R and the infrared continuum flux which results from the entire disk. Since they did not detect a correlation, this is in agreement with the conclusion that the correlation between V/R and DACs is a line-of-sight effect. The incipient evidence reported by Draper et al. (2014) for changes in γ Cas of the V-band polarization with V/R phase would be a supporting circumstance. Theory finds that density perturbations due to m = 1 density waves are largest above and below the midplane of the disk (Okazaki 2016).
From the analysis of a sample of 62 classical B0.5 to B5 Be stars, Grady et al. (1987) derived that stellar wind lines only occur at intermediate and high inclination angles (υ sin i ≥ 150 km s−1). This may indicate that the matter carried away in the wind does not originate directly from the photosphere but from ablation of the disk (see also Kee et al. 2018, and references therein). This conclusion is corroborated by correlations between the strength of the C IV UV doublet and Hα line emission observed by Peters (2000) in λ Eri and 66 Oph. The EW of the Hα emission lagged the EW of the wind lines, which may be an opacity effect. Theoretical support derives from gravity darkening which, in rapidly rotating stars, would reduce the mass-loss rate with stellar colatitude, that is toward high disk inclination angles (Müller & Vink 2014). It would also explain that, in Be stars, stellar winds are found out to later spectral subtypes than in B stars without emission lines (Prinja 1989). If the suspected companion to the B8e star β CMi is an sdO star (Dulaney et al. 2017, but see also Harmanec et al. 2019), the presence of C IV λ1548 in this object (Klement et al. 2015) indicates that winds from hot companions can also be involved.
One way of producing the apparent coupling of the line-of-sight properties of the wind to the phase angle of the density wave in the disk of γ Cas would, therefore, be to invoke an azimuthally varying interaction of the stellar radiation with the disk. The vertical breathing modes in the models by Ogilvie (2008) may provide some theoretical underpinning. The azimuthally varying height of the disk above the stellar equatorial plane is discussed in more detail in Sect. 3.2. Since the line of sight to 59 Cyg is close to the equilibrium position of the disk, this can easily lead to variable ablation of matter from the disk, which manifests itself in enhanced UV wind lines. At the equilibrium inclination of 43° of γ Cas, the combination with the 35° swing of the high-density region in the disk as estimated in Sect. 3.2 requires more detailed modeling. The resulting relative phasing of V/R and wind variability was also as observed. At the m = 1 phases determined by Telting & Kaper (1994), the base of the m = 1 wave crosses the sightline. In the model developed by Telting & Kaper (1994, their Fig. 12), the wind streamlines from the high-density region at the base of the m = 1 wave cross the line of sight, where they produce DACs, when this region is moving toward the observer, that is when V > R.
Because radiative ablation is most effective closest to the star, the strength of DACs should be largest around that time. However, this concept cannot explain the shell phases and varying emission-peak separations, which, too, were coupled to the V/R phase in γ Cas (Sect. 4.1). A new ansatz seems wanted by the observations. As it turns out, two of them are needed (see Sect. 7.3 and Paper II).
7.2 Disk precession in a binary
Temporary shell phases as well as variable emission-peak separations could be due to a precessing disk in a binary (Hummel 1998; Hirata 2007). This concept has been successful in explaining Pleione (see Sect. 2) but this star’s timescales differ by more than an order of magnitude from those observed in γ Cas and 59 Cyg. Recently, Martin & Lepp (2022) concluded that the ~80-yr nodal precession of Pleione requires the precessing part of the disk to be detached from the inner one (as previously diagnosed by Marr et al. 2022). While for Pleione there is important supportive evidence from polarimetry, long-term polarimetric studies of stars like π Aqr and 60 Cyg (Wisniewski et al. 2010) have demonstrated that Be disks typically maintain their position angle in the sky. In the case of γ Cas, the combination of polarimetry with long-term interferometry data has particularly firmly established that the spatial orientation of the disk in its untilted ground state has been invariant for decades (Paper II). The polarization of 59 Cyg was fairly constant between 1992 (or even 1983) and 2004 (Sect. 5.1).
A special challenge posed by γ Cas is that its two shell phases occurred at about the same V/R phase (Table 1 and Fig. 1). There is no canonical model available that would predict such a coupling of V/R variability, which is an effect of gas motions within the disk, and precession of a disk as a whole. A qualitatively similar coupling was found by Schaefer et al. (2010) in interferometric observations of the shell star ζ Tau, where variations in the PA with a peak-to-valley amplitude of ~15° were probably correlated with the oscillatory behavior of the V/R ratio in Hα. Following Ogilvie (2008) and Oktariani & Okazaki (2009), the authors suggested that this may be due to a tilt of the disk that propagates with phase of the m = 1 density wave. The density enhancement would be near the node line defined by the planes of the disk and the equator of the Be star. The discussion of the precession model is resumed in Sect. 7.3.1.
7.3 Rotating disks with planes gyrating in space
Although probably not applicable to γ Cas and 59 Cyg, disk precession in a binary, that is the changing orientation in space of the disk, is still a critical conceptual step forward as it overcomes the restriction of canonical density waves to planar structures fixed in space. Ironically, the underlying restriction in thinking is the result of one of the most important breakthroughs in the understanding of Be stars, namely Struve’s law that established equatorial disks as a defining property of Be stars (Struve 1931). The extra degree of freedom resulting from the exceptional, temporary breaking of this law will be explored in the following. The discussion assumes that the position of the untilted disk of both stars is equatorial and that any changes in disk orientation only begin with the onset of the respective activity phases. (Roughly) Keplerian rotation is adopted for the motions of the particles in the untilted disk.
7.3.1 The evidence
The least model-dependent observation supporting a turning disk is the change by ~90° in the PA of the continuum polarization of 59 Cyg. The variation occurred within less than a decade after the star’s high-activity phase, and thereafter the new PA was roughly constant for more than a decade (Sect. 5.1). This, too, argues against pure precession as in Pleione.
Abstracting from all the bewildering details, the most remarkable fact by far (already pointed out by Hummel 1998) about the activity of γ Cas between 1932 and 1942 is that V/R variations, changes in emission-peak separation, and the occurrences of shell and single-peak emission lines were all synchronized with phase of the same instantaneous cycle (Sect. 4.2). That is, the three phenomena were not periodic but formed a pattern that was the same for both cycles: Shell phases developed around the times of maximum peak separation and shortly before V/R minima, and the differences in time between all three events were about the same in both cycles. In 59 Cyg, shell phases and varying PSs seem to have been similarly coupled but the V/R variability was not involved (Sect. 5.1).
The simplest idea to deal with temporary shell phases and variable peak separations is to consider changes in the disk inclination angle. Many people will have dropped it instantly because of the violation of angular-momentum conservation in a singlestar system. In a remarkable pathfinder paper, Hummel (1998) followed it through anyway at a time when the binary nature of γ Cas and 59 Cyg could only be suspected (and nearly a decade before the first proposal of a precessing disk in Pleione by Hirata 2007). Hummel limited his discussion to γ Cas and established that there is no evidence of gross variations in disk radius. For his analysis, he did not use the RVs of the peaks of the emission lines but of those of the emission edges, the nature of which he described in some detail. Fitting the published separations in edge velocity of various emission lines, he found that the tilt angle grew linearly with time, reaching 33° at the second single-peak stage. This would have increased the disk inclination angle of 43° (Paper II) by this amount so that shell absorption becomes a possibility. In his combined analysis of line-width and V/R variations, Hummel also found a solution with a tilt angle of ~ 70° which he considered unrealistically large.
Modeling the variability of the emission edges has the advantage that they do not blend as the emission peaks did during the single-peak stages. However, this choice excludes a priori the possibility that the disk could temporarily be seen face-on. If a disk is passing through a face-on orientation, the RV curves of the two emission components cross and the RVs relative to their mean change sign. Because emission-edge RV curves cannot cross by definition, this choice automatically implies that the negative velocities before and after the single-line stage are attributed to one and the same region of the disk (ditto for the positive velocities but in a different region). This is Cleminshaw’s (1936) as well as Baldwin’s (1939b) interpretation of the observations, which was de facto also adopted by Hummel (1998). On the basis of the available RV measurements alone, it cannot be excluded. The single-line stage is a singularity, in which two identical emission components could have swapped their identity.
However, the single-line stages happened to be close to V/R extrema of non-He lines which, on the one hand, because of the blending, complicates the separate analysis of the two components. On the other hand, the unequal emission strengths give the two emission peaks distinguishable identities. Lockyer (1935) saw in the data a discontinuity which jumped from V/R ≪ 1 to V/R ≫ 1 (see his Fig. 2), that is the much stronger peak remained much stronger, and the much weaker peak remained much weaker, but they swapped the sign of their RVs. The situation is well illustrated in a drawing by Heard (1938), which is reproduced in Fig. 4. By contrast, as Baldwin (1939b) pointed out, his (Baldwin’s) interpretation implies that the peak that entered the single-line stage as the (much) stronger one emerged from it as the (much) weaker one. That is, the two peaks would probably have swapped not just their strengths but also their identities. He did not offer an explanation, and there does not seem to be a simple one whereas a flip in sign of the RV becomes a possibility as soon as it is accepted that the disk can change its inclination such that during the single-line stage it is viewed face-on. In this case, the volumes in the disk producing the stronger and the weaker emission peaks, respectively, would retain their identity through the single-peak stages.
The resolution of the described degeneracy of the emissionline-profile variations is the pivotal point for the interpretation of the peculiar variability observed in γ Cas and 59 Cyg. This study adopts the position that, during single-line stages, the RV curves of the two emission components did not touch one another and then separated again but crossed one another as strongly suggested by Heard’s drawing. Given the inclination angle of 43° of γ Cas (Paper II) and the much larger one of 59 Cyg (Sect. 2.2), this immediately implies a very large swing in disk inclination, up to and beyond a full flip. Both disks have passed through all inclination angles between 0 and 90° sketched out by Slettebak (1979) in his Fig. 3 (see also Fig. 1 in Rivinius et al. 2013) and schematically visualized at the top of Fig. 1. Since the crossing occurred around the systemic velocity, gas moving toward earth before the crossing moved away from it afterwards, and vice versa.
Although the temporary appearance of shell absorption lines is more spectacular than that of merged, single emission lines and, therefore, has found much more attention in the literature, the single-line stage provides the more important diagnostics. This emerges from the above discussion. But the diagnostics are also more robust and less ambiguous. While shell lines could result not only from a tilting disk but also from warping or flaring, the merging of double-peaked emission lines in spectra of sufficient resolution leaves less room for alternatives to rotation of the disk plane.
At first sight, it might appear a curiosity that, in their high-activity phases, both γ Cas and 59 Cyg exhibited about two consecutive cycles. However, in one full turn of the disk, two face-on and two edge-on configurations occur. That is, the two cycles correspond to one full turn. Section 7.3.2 investigates stability aspects.
For an observer, a tilting disk only changes its inclination and its position angle (for special orientations only one of them). In the case of a precessing disk, the normal to the disk plane moves along the surface of a cone. Depending on the orientation of the cone axis in space and the cone opening angle, face-on configurations may also occur in the case of a purely precessing disk. Since tilting as well as precessing disks can be viewed both edge-on and pole-on, both shell and single-line phases are possible in either case. Without interferometry and/or linear polarimetry, it is difficult to discriminate between purely tilting and purely pre-cessing disks if the change in aspect angle is so large that both single-line (face-on) and shell (edge-on) stages are produced.
The remainder of this paper assumes that during single-line stages the disks of the stars were viewed pole-on, and they were seen edge-on when shell absorptions were present. Owing to various indications that the disks got (increasingly) distorted, this nomenclature is only approximately valid, and there will have been additional precession. In both binaries, the orbit and spin axes of the two component stars remained unaffected for all practical purposes.
For the disk to be viewed roughly from both pole-on positions, it is necessary that the axis, about which the disk is tilted, is close enough to the plane of the sky that at the intermediate position the sightline intersects the disk and shell lines can form. Contrary to first intuition, this condition is not anthropocentric because y Cas and 59 Cyg were selected on account of their shell phases.
The observing methods of choice for an unambiguous check on the tilting-disk idea are interferometry and linear polarimetry. The latter is implied because, from the direction of rotation in Stokes QU loops across emission lines, information on the direction in space of the rotation of disks may be inferred (Poeckert & Marlborough 1977). Given the rarity of the events in question, it may appear elusive to hope for such observations. However, spectroscopic monitoring of well-resolved doubly peaked emission lines like Hγ or Hβ with monthly cadence will detect strong variations in peak separation. Such events will enable convenient and timely alerts for more complex follow-up observations.
 |
Fig. 4 RV curves of pairs of emission peaks from different ions in γ Cas as labeled. Initially, the peaks were widely separated. Later, they approached each other until they became unresolved in the single-line stage, after which they split again. If the curves crossed during the single-line stage, the peaks retained their relative strengths (which during that time were very different) but the signs of the RVs were swapped, which means that matter initially moving toward the observer moved away from them after the crossing (and vice versa). If the curves merely temporarily touched one another, the relative strengths were swapped whereas the signs of the RVs remained the same (figure reproduced from Heard 1938). |
7.3.2 Related geometric-dynamic symptoms
A first simple geometric health check on the changing-disk-inclination hypothesis can be ticked off quickly. Shell phases should occur at times of maximum peak separation (when the disk is viewed edge-on): according to Tables 1 and 2, this condition is satisfied. Similarly, in single-line stages, the emission lines should appear near the stellar systemic velocity. This seems to be fulfilled for γ Cas (Baldwin 1939b) as well as for 59 Cyg (Barker 1982).
In order to explain shell phases but not make γ Cas a persistent shell star, the maximum peak separation and, by canonical implication, the maximum disk inclination angle, between 1932 and 1942 should have been larger than that during V/R-quiescent times. In ~30 spectra of γ Cas from the period 1914-1926, when V ≈ R, Cleminshaw (1936) measured mean peak separations of 152 and 166kms−1 for Hγ and Hδ, respectively. For the time between 1928 October and 1933 October, when the V/R amplitude was low, Heard (1935) obtained very similar values, also for Si II. They are also well compatible with the Balmer peak separations from 2013 through 2016 (PaperII). Miroshnichenko et al. (2002) found the peak separations of Fe and He lines to be approximately constant at 220–230 km s−1 between 1994 and 2002, that is during the third V/R-active episode. These lines form in regions that are closer to the star than where the bulk of the Balmer emission does and therefore rotate more rapidly. In the first half of 1936, peak separations around 200 kms−1 or slightly higher were measured by Heard (1937, 1938) in H, He I, and Fe II lines and by Baldwin (1939b) also in Si II and Mg II. Therefore, in summary, the above requirement is marginally satisfied. However, for a meaningful comparison, the unknown differences in the density and velocity profile of the disk would have to be taken into account. Also, the data available from the 1930s do not permit one to decide whether the largest measured peak separation is the true maximum attained by γ Cas. Similar observations are not available for 59 Cyg.
In 59 Cyg, the cycle length was only about half of that in γ Cas (2 vs. 4 yr). This may be related to the much smaller Roche lobe and probably also smaller disk size (cf. Sect. 2.2).
According to Baldwin (1939b), during the second high-activity cycle, the two peaks of pairs of emission lines in γ Cas were sharpest around the time of their merger (second singleline stage in 1937). This is qualitatively plausible if differential gas motions perpendicular to the plane of the disk are smaller than within it. Baldwin’s observation that this sharpening was the least pronounced in hydrogen, strongest in Si II, and probably intermediate in Fe II lines invites for numerical modeling.
Three years later (1940), toward the end of the second shell phase, Hase (1942) and Burbidge (Peachey 1943) observed narrow absorption components disappear and return within very few days. If these changes were caused by gas moving into and out of the line of sight, the velocity of this gas perpendicular to the line of sight must have been a few tens of km s−1. This may have been due to rotation within whatever was left of the disk that was being heavily viscously drained or due to motions perpendicular to it or both. In any event, the circumstellar matter must have been highly clumpy, in strong contrast to Be disks near equilibrium.
The two phases with a second set of emission lines that were persistently sharp (in γ Cas only; Sect. 4.4) are not obviously related to properties of the main, broad emission components (see Table 1 and Fig. 1). For the pair of sharp emission components between the main one in 1938, a thin ring that was somehow detached from the main disk and dispersed after a while seems capable of reproducing all other observations of sharp emission components in γ Cas (Paper II). The sharp emission components seen at velocities up to +500kms−1 in 1940, i.e. probably well above the stellar υ sin i, are even more likely to have formed in a structure not connected to the disk. A rather energetic ejection/separation process must have been responsible for their formation.
The above symptoms preceded what looks like the final dissipation of the disk and perhaps were precursors of the destruction. A reduction in mass injection in the disk may be needed so that gravity can overcome viscosity to initiate a major tilt of the disk as a whole as indicated by the participation of the He I lines in the PS variations. After half a turn, i.e., one cycle in γ Cas and 59 Cyg, the disk will be counterrotating with regard to the star.
If at this moment the mass injection rate is significant, matter in the disk with negative angular momentum and freshly ejected matter with positive angular momentum will interact and, as the result, fall back to the star.
7.3.3 Variations in continuum flux
There is no light curve of 59 Cyg during its high-activity phase, and that of γ Cas is difficult to interpret because of the timing and large amplitude of the singular peak in the early phase of the second cycle and the small cyclic component of the variability. If that high peak is due to a mass-loss outburst (discussed in Sect. 7.3.7), the subsequent drop should be caused by the partial dissipation of the ejecta. The elevated broad plateau following thereafter could be the result of the (old) disk rotating away from a more edge-on perspective and processing the excess flux from the new ejecta. This little (pseudo-)discussion shows that it is not straightforward to credibly integrate a major mass-loss outburst into the global understanding of the activity of γ Cas in the 1930s although, owing to the strong and relatively short brightening, it is known as the ‘Great Outburst’ in the literature. An alternate concept based on rotation and distortion of the disk plane is developed below.
During the high-activity period of γ Cas, color and brightness were anticorrelated. This behavior is almost a defining characteristic of Be stars not viewed equator-on and perhaps the most prominent symptom of viscous decretion disks (Haubois et al. 2012). Therefore, even under the unusual circumstances of these variations, the VDD model provides a reasonable qualitative description. The strong dependence on disk inclination of the excess flux predicted by the VDD model leads to two basic expectations.
Firstly, when a disk is viewed face-on, that is during the single-line stages in γ Cas and 59 Cyg, the continuum excess from the disk should have been largest because a maximum of light was emitted into the line of sight (Haubois et al. 2012). This is crudely true for γ Cas, but the scatter of the brightness estimates is large. For 59 Cyg, there is no photometry that can be used for such a comparison. However, the UV spectra of 59 Cyg show clearly that close to a shell phase the UV flux was significantly reduced (Sect. 5.1), in agreement with Haubois et al. (2012). In the latter models, the maximum V-band magnitude difference between a fully developed disk and a diskless state is around 0.6 mag (depending on inclination), which is much less than observed in γ Cas, especially considering that in 1932, when the activity started, the disk was well developed. But, if the plane of the disk is turning in space, model calculations by Marr et al. (2018, their Fig. 8) found an additional V-band amplitude of 0.7 mag or more.
Secondly, the extra flux during face-on phases should diminish the contrast of the stellar absorption lines (as also illustrated by Iwamatsu & Hirata 2008; in the historical literature, veiling was instead attributed to reduced transparency of the envelope). In fact, during single-line stages of γ Cas (face-on view) the veiling was largest whereas it was lowest near shell phases (edge-on view; Table 1 and Fig. 1). When the wings of absorption lines weaken, the apparent line width decreases. The so expected correlation between photospheric absorption-line width and emission peak separation was very clearly detected (Sect. 4.2.5) and, under the turning disk hypothesis, confirmed that the excess flux from the disk was the stronger the more nearly face-on the disk was viewed. Perhaps, Edwards (1956) did even detect the wavelength dependence of this extra flux (Sect. 4.2.6). The visibility of the stellar spectrum of γ Cas was maximized when the emission lines finally disappeared in the 1940s and there was no appreciable disk left: the star was bluest and faintest with a minimum of circumstellar contamination.
There is no clear report of veiling in 59 Cyg. Photospheric lines were best visible when the line emission was weak. But this may also be due to the reduced filling in by line emission of the absorption profiles.
The simultaneous agreement between the VDD-driven expectations, the spectroscopically inferred disk orientation, and the continuum-flux related observations of γ Cas (and partly of 59 Cyg) is an important confirmation of the robustness of all three components. The idea of a disk with a plane turning in space seems qualitatively supported also on these grounds. The large photometric amplitude seen in γ Cas may require modification of the geometry from a disk to a vertically much more extended – perhaps fanned-up – structure. Then, the solid angle subtended by the circumstellar matter could be much larger, and a larger fraction of the stellar flux could be intercepted and a larger part of the flux received by the disk could be emitted toward the observer. (In principle, a drastically grown flux excess could also be due to a much increased mass-injection rate but, during the photometric maximum, the disk was viewed nearly edge-on and accompanying spectroscopic changes were not reported.)
7.3.4 Equivalent-width variations of emission lines
In V/R-active episodes characterized by m = 1 density waves, γ Cas and 59 Cyg exposed different behavior. While during the third V/R-active episode of γ Cas (1969–2003) large-amplitude variations with V/R phase unfolded in Hα EW, when the disk was well developed (Miroshnichenko et al. 2002), the much weaker disk around 59 Cyg only showed smaller and incoherent fluctuations during its second V/R-active episode (1979–1987; Harmanec et al. 2002). That is, EW variations may be associated with an m = 1 disk oscillation but do not develop necessarily.
In a flat and thin disk, m = 1 density waves cannot produce large EW variations (Sect. 3.2). Paper II develops an explanatory concept based on the oscillatory behavior in Hα of its EW and of the RV of its peak, for which there are no equivalent observations from earlier times. It is based on the revolution in an optically thick disk of the overdense region of an m = 1 density wave which cyclically exposes regions of enhanced emissivity at the rim of a geometrically thick disk. If the disk is also tilting, additional EW variations may result.
7.3.5 Variations of highest Balmer line visible in emission
Pottasch (1959) used the Inglis-Teller formula to calculate the electron density from the highest Balmer series member, n, visible in emission between mid-1932 and late 1938. His Fig. 5 suggests a reduction with time of the electron density by three orders of magnitude. However, Table 1 contains more data points than used by him, and fluctuations are more pronounced. More importantly, in the conventional picture of Be stars, there is no obvious physical reason to expect such a drastic drop in electron density, and a geometric explanation may also here be preferred.
Edwards (1943) found the highest Balmer emission line to correlate with color temperature, the redder the star the higher n was. In the tilting-disk context, this means that n was highest when the disk was viewed face-on (cf. Sect. 7.3.3). Because the line emission scales strongly with projected area, this makes sense within the VDD framework. This reasoning can be further anchored to the size of the Balmer discontinuity. In the scan of the spectrum from Sept. 22, 1937 plotted by Baldwin (1939a), the Balmer series can be traced through n ≈ 30, and the Balmer continuum appears strongly in emission. The latter is a symptom of a dense disk viewed face-on. In fact, in that year, the Balmer lines were single, that is the disk was seen face-on, from May through November (Baldwin 1938).
7.3.6 Comparison to simulations of possibly related cases
Since this is still a very young field, there do not seem to be numerical simulations closely matching the historical unusual variations of γ Cas and 59 Cyg (Sects. 4.2 and 5.1, respectively). Nevertheless, comparison to simulations of possibly related cases can inspire further thoughts. But the limitations of such comparisons need to be noted because the extent simulations do not yet deliver observables.
Recently, Suffak et al. (2020) published simulations of the evolution of strongly misaligned disks in binaries. This being a first reconnaissance study, its coverage of the parameter space is still relatively coarse. But six conclusions possibly relevant to the understanding of γ Cas and 59 Cyg seem to be emerging already: (i) For major effects, the disk-orbit misalignment should be several tens of degrees. (ii) Variations in disk inclination of also several tens of degrees are, then, possible. (iii) Precession is only observed when the disk is dissipating or after the tearing event (item (vi) below), i.e., when viscosity does not couple the disk to the star. (iv) During build-up phases, the disk is only seen to tilt and not to precess. (v) Timescales can be ~20 binary orbits. (vi) An outer ring can temporarily be torn off from the main disk (if the star actively decretes matter so that the inner disk is viscously anchored to the star). Furthermore, oscillatory patterns can develop during disk build-up, disk dissipation, or not at all. At some moment after the mass injection into the disk had been shut off, the disk mass dropped in some cases rather abruptly, that is after less than ten orbits, the disk was substantially damaged or even largely destroyed. The simulations used circular orbits with periods of 300 and 30 days, which well match the cases of γ Cas and 59 Cyg. However, the assumption of two equal main-sequence stars with masses of 8 M⊙ lies outside the conventional domain of Be binaries (Sect. 2). Therefore, it is not clear to what extent these simulations can be compared to γ Cas and 59 Cyg.
Hummel (1998) suggested to check BeXRBs with misaligned orbits for similar phenomena because, at that time, BeXRBs presented the most clearly established population of binary Be stars. BeXRBs comprise two subpopulations, one of which has roughly vanishing orbital eccentricities (Pfahl et al. 2002) whereas in the other one the orbits are significantly eccentric (Townsend et al. 2011). This is attributed to different supernova explosion processes. Electron-capture supernovae arising from lower-mass progenitors eject matter roughly spherically symmetrically, leaving the orbits intact that have been strongly circularized in the intensive pre-explosion interaction in the binary (Podsiadlowski et al. 2004). Higher-mass progenitors may release neutrinos and eject matter very anisotropically, and the recoil explains eccentric orbits and misalignments of orbit and spin (Podsiadlowski et al. 2004; Wongwathanarat et al. 2013) as well as the high space velocities of many pulsars (Janka 2012). If the surviving companion of the exploding star is a Be star (previously spun up by mass and angular-momentum transfer), the plane of the circumstellar disk may be misaligned with the orbital plane. Strongly misaligned disks can be subject to von Zeipel-Lidov-Kozai (ZLK) oscillations (Ito & Ohtsuka 2019). They are characterized by an oscillatory exchange of the orbital inclination of test particles and the eccentricity of their orbits. In Be stars, the disks consist of many such particles. Martin & Franchini (2019) recently studied the dynamical behavior of BeXRBs in detail. They found that the giant (Type II) X-ray outbursts, the timing of which is unrelated to orbital phase, can be caused by strong ZLK-driven increases in disk ellipticity and Roche-lobe overflow, resulting in enhanced mass accretion and X-ray emission by the neutron star.
ZLK oscillations are also important in a variety of other situations. The concept was originally developed for satellites and minor bodies in the Solar System and later also applied to other planetary systems (Shevchenko 2017, for a review). Some of the simulations by Suffak et al. (2020) also developed ZLK oscillations. ZLK oscillations may furthermore occur in misaligned circumbinary disks (Smallwood et al. 2021; Martin et al. 2022), and, perhaps, the twisted structure around the binary protostar BHB2007 in the dark nebula Barnard 59 (Alves et al. 2019) is a real-sky snapshot in an accretion context of a disk that is affected in a similar but probably not long-term oscillatory fashion, like in γ Cas and 59 Cyg.
The simulations assume spin-orbit misalignments because a companion star orbiting in the plane of the disk cannot exert torque a flat disk. However, in the presence of an m = 1 disk oscillation, the density maximum of the disk does not lie in the equatorial plane of the primary (Sect. 3.2) so may provide for some seed torque even if the secondary’s orbit is not misaligned.
7.3.7 Challenges
While the broad qualitative agreement between the concept of a tilting disk (which may additionally precess) and the observations of shell phases and variations in peak separation is appealing (Sect. 7.3), many other aspects of the historical activity phases in γ Cas and 59 Cyg are still awaiting an explanation. They were partly already addressed in the rest of Sect. 7 and are bundled and expanded in the following.
The strong brightening of γ Cas. It was discovered in 1936 nearly four years after the beginning of the strong disk activity in 1932 (Sect. 2.1) when the disk was viewed roughly edge-on (Sect. 4.2.4) and photometric effects of a flat disk should have been lowest. The event does not fit into the cyclic activity. If it was triggered by stellar – as opposed to circumstellar – activity, the standard explanation would be a burst of circum-equatorial mass ejection. In principle, a simple, but strong increase in mass loss could, compared to a diskless state, cause a brightening by up to ~0.6 mag, depending on inclination angle (Haubois et al. 2012). However, the steep drop of the light curve (Baldwin & Torp-Smith 1941) would be atypical of viscous events in a well-developed disk such as that of γ Cas in 1936, which are characterized by short rise times (because they are dominated by the smaller volume of the inner disk) and slower fading (which is governed by the volume of the complete disk, Rímulo et al. 2018). For a disk with its plane turning in space at a constant rate, such asymmetry is not expected, and an additional amplitude of more than ~0.7 mag can arise (Marr et al. 2018). The concomitant changes in the emission lines expected from a mass-loss outburst were not reported (Sect. 4.2.4), but neither was the rise to the maximum observed. That is, there is no positive evidence of a major mass-loss event in γ Cas, and it is fully absent in the case of 59 Cyg so that comparisons to the outbursts of Luminous Blue Variables (Marlborough 1997) appear unsupported by these observations. A stellar outburst would also require an explanation of the close coincidence of a major stellar event with the strong circumstellar activity (see below). If the disk did not turn in space similar to a solid body but, for example, fanned out to subtend a much increased solid angle, it could reemit a much larger fraction of the stellar flux toward the observer than a planar disk can, leading to a substantial brightening.
The terminal dissipation of the disks. It is conspicuous that, following decades-long disk growth, both stars had strong line emission at the beginning of their high-activity episodes, the emission continued to grow, and, at the end of these phases, both lost their disk within very few years. Conceivably, both disks had expanded such that the interaction between disk and companion star had substantially intensified and the disks were dynamically destroyed. An indicator of violent dynamics may be the very unusual, large widths of the shell lines in 59 Cyg (Sect. 5.1). Marlborough & Snow (1980) considered highly supersonic turbulence as a possible, but not very appealing, cause. Maybe, a strongly perturbed macroscopic velocity field is a better explanation. This notion seems supported by the similarly unusual large negative RVs of some shell lines in the two stars (Sects. 4.2 and 5.1), while, at the same times, other shell lines even had positive velocities (Sect. 4.2). It is further corroborated by the multitude of rapid irregular variations reported especially toward the end of the second cycle in γ Cas (Sect. 4.2). Observations of dissipating massive disks, for instance in 66 Oph (Marr et al. 2021) and π Aqr (Bjorkman et al. 2002), show that this process can take a decade or more. Although this is the convolution of stellar and disk timescales, it highlights from a different perspective how unusual the behavior of γ Cas and 59 Cyg has been. ZLK oscillations can largely destroy a disk (Martin & Franchini 2019). The viscous coupling of the disk to the star can serve as a protection (Martin & Franchini 2019) that could have been lost if the quasi-diskless state, which in γ Cas may have lasted a few years, probably less in 59 Cyg, was partly due to a significant reduction in mass injection rate (Suffak et al. 2020). Through the, then, reduced viscous ‘gluing’ of the disk to the star, it would have allowed the companion to gain more leverage on the disk. Without such decoupling, the disk would, after half a turn, have gone through a dramatic phase when it was counterrotating to the star, leaving matter in the inner disk with negligible angular momentum. However, the resulting infall should have produced high positive RVs which have not been reported.
The possible coincidence of stellar and circumstellar activities. If the high-activity episodes in γ Cas and 59 Cyg were the result of independent stellar and circumstellar activities, their coincidence would remain unexplained and be unrealistically rare. This could be avoided by a transient reduction in mass injection rate and the resulting decoupling of disk and star (and, perhaps, disk tearing). However, this breath-catching of the star may need to occur when the disk is large enough to experience a strong gravitational effect from the companion. As another effect of the companion, additional matter may accumulate in the disk within the secondary’s orbit (cf. Sect. 3.1) which is corroborated by the exceptionally large E/C value exhibited by 59 Cyg around its shell phases (Sect. 5.1).
The need for misaligned disks. For strong variations in disk inclination, extent simulations (Sect. 7.3.6) and analytic solutions (Lubow 2021) require a strong initial disk-orbit misalignment. Among the closer Be binaries with subluminous companions, ϕ Per is, apart from Pleione, the only Be binary with published estimates of the degree of disk-orbit misalignment, and it is very small (Mourard et al. 2015). Among the wider systems with main-sequence secondaries, such misalignments may be less rare as suggested by δ Sco (Baade et al., in prep.) and Achernar (Kervella et al. 2008), for which Kervella et al. (2022) found that the angle between the equatorial plane of the rotation-ally distorted Be star (Carciofi et al. 2008) and the orbital plane is  deg. In both γ Cas and 59 Cyg the misalignment angle is not observationally constrained but, if they are the products of mass transfer in a binary, it is expected to be small. Resonant tilt instabilities (Lubow 1992; Martin et al. 2020) may perhaps lead to seed misalignments, enabling the processes simulated by Suffak et al. (2020). The continuity in phase and cycle length from the standard V/R variability in the 1920s to the two high-active cycles in γ Cas suggests that the preexisting ellipticity of the disk due to the m = 1 density wave may be another seed parameter, leading to an exchange of ellipticity and inclination similar to ZLK processes. For geometrically thick disks, Lubow & Ogilvie (2017) find that ZLK oscillations may also develop if disk and orbit are coplanar, because, in thick disks, the orbits of the particles are individually misaligned, so that they can move to large distances from the midplane of the disk. But the stellar mass ratio needs to be near unity, and the growth rates are low. Finally, in a hierarchical application of the ZLK mechanism, it may also be conceivable that the distant companions to γ Cas (Sect. 2.1) and 59 Cyg (Sect. 2.2) caused the disk-orbit misalignment and so enabled the respective inner binary to turn the Be disk. Some Be stars are, in fact, members of triple systems. Again, for only one of them, namely ν Gem, interferometric observations (Klement et al. 2021) have been published, and they do not indicate any major misalignment. However, in this system, the Be star orbits the inner binary so that the proposed hierarchical ZLK-like process is not applicable.
The role of the V/R mechanism. In the two cycles of γ Cas in the 1930s/40s, V/R, peak separation, and shell phases were tightly correlated. The apparent lack of such coupling in 59 Cyg (Table 2 and Fig. 2) would abolish the need for a global explanation and perhaps even render V/R a nuisance factor in attempts to understand the high-activity phases in both stars. The coupling of these parameters is not expected because the variable peak separation is the result of the rotation of the disk plane whereas m = 1 density waves as the canonical cause of V/R variations propagate within the disk plane. Section 7.4 returns to this matter and also discusses how the 3-D properties of one-armed disk oscillations might account for the observations. If, for example, a warp of the disk has developed (Okazaki 2016) and is locked to the V/R variations, such distortion might couple to the turning in space of the disk. The observation by Baldwin (1939b, see Sect. 4.2.2 and) of possible dynamical differences internal to the regions contributing to the V and R peaks may indicate some asymmetry in such distortions. The restriction of the observed V/R variations to lines other than helium shows that the inner disk did not participate in whatever caused the V/R variations, whereas the PS of the helium lines did vary. This, too, suggests that the V/R mechanism is not critical part of the disk-tilting process. Furthermore, the large V/R ratios of ≲4 observed in γ Cas (Sect. 4.2) may be outside the scope of m = 1 density waves alone. Franchini & Martin (2019) found that, in the case of extreme mass ratios like in γ Cas and 59 Cyg, 3:1 Lindblad resonances in the disk can strongly increase the eccentricity of the disk which might help to push the V/R ratio and also couple motions in the disk plane to changes of the disk plane.
The rapid excitation and damping. The rapid dissipation of the two disks probably explains the rapid damping of the variations. But their equally or even more rapid excitation remains stunning. This may suggest some kind of resonance, and there are quite a few timescales: the orbital period of the binary, the orbital periods of the disk particles, the precession period of the particle orbits in the disk, resonant disk responses to the stellar orbit, orbital disk truncation, cyclic mass injection into the disk, Lindblad resonances in the disk, etc.
The range in disk tilt angle. Sections 7.1 to 7.3.5 have discussed the disks as frisbee-like structures. This is an approximation at best, and multiple indications of rapid variations, large velocity spreads, and the ultimate dissipation of the disks suggest that the validity of this assumption became increasingly more stretched with time. For instance, if the disk structure remained fully preserved while its plane turned, the peak separation during the shell phases of γ Cas should have been larger by a factor of 1/sin43°, that is ~40% than that during the steady state. The available observations (which may not cover the full range in phase) only show a change by ~20% (Sect. 4.2.2). The small spread between different ions concerning the times of shell and single-line stages (Sect. 4.2.2) suggests that any warping of the disk with regard to the plane of the sky was also small.
Disk truncation. The simulations by Suffak et al. (2020) led to the conclusion that strongly tilted disks should suffer less from truncation by the companion. However, the SED of γ Cas (Klement et al. 2017, 2019) does suggest significant truncation while it was in its equilibrium position. Perhaps, this means that, in its equilibrium state, the disk is not strongly misaligned with the binary orbit. The disk in 59 Cyg is likely similarly truncated, since, with the remarkable exception of the high-activity phase between 1972 and 1976 (Sect. 5.1), the Hα E/C seems to possess an asymptotic limit ~2.2 (Sects. 2.2, 5, and 5.3). In other early-type Be stars without close companions, long periods of disk growth often result in E/C values higher than this level.
Flung-off rings and high-velocity structures. The qualitative agreement of the simulated torn-off ring (Suffak et al. 2020) and the observationally driven idea of a flung-off ring in γ Cas in 1940 (to potentially explain the short-lived noncyclic sharp emission components) encourage more tailored numerical investigations. A transient reduction in mass injection may lower the required energy to overcome the viscous forces. Velocities in excess of 500 km s−1 suggest that high energies were released and may have been available for other processes, too.
7.4 m = 1 disk oscillations as a possible alternative to the tilting or warping of the disk
The historical variations of the disks around γ Cas and 59 Cyg were not confined to the stars’ equatorial planes. Apart from misaligned orbits of companion stars, the only known property of Be disks that routinely produces a 3D structure are m = 1 disk oscillations. Section 7.3.7 has briefly discussed the challenges of coupling the V/R variability to the tilting of a disk. This subsection first investigates whether this problem vanishes if the entire variability is due to one-armed disk oscillations (cf. Sect. 7.1).
One could imagine how the oscillation mode might produce a large-amplitude local density enhancement that creates a strong V/R variation as the mode precesses in azimuth in the disk. Then, in some circumstances of favorable geometry, this higher density zone would transit the line of sight to the star and create a shell phase spectrum. Ogilvie (2008) discovered that disk oscillations can introduce vertical motions that can lead to significant gas perturbations away from the disk mid-plane. This process has yet to be fully explored in the literature, but one example appears in the work of Okazaki (2016) for the case of ζ Tau. In his Fig. 3, he shows how the disk oscillation can produce a large density perturbation both close to the star and well above the equatorial plane. It is, therefore, possible (see Sect. 3.2) that such a high density region could be seen projected against the star even in a case like that of γ Cas with a mid-range inclination for the disk (and stellar spin). Because these oscillations are associated with the V/R variations, this suggests that the shell episodes could result from off-plane density enhancements that transit across the face of the star.
There are several lines of evidence that seem to support this idea. Okazaki (2016)’s Fig. 3 shows that an oscillation can produce an outflow in the inner part of the disk as is observed in the shell episodes described in Sects. 4.2 and 5.1 for γ Cas and 59 Cyg, respectively. The PS sometimes attains a minimum after V/R > 1 (and around the time of V/R = 1) when the density enhancement would appear in inferior conjunction (in front of the star). The V/R and shell-phase timescales are similar to estimates of the precession of an oscillation mode for γ Cas and 59 Cyg (see Ogilvie 2008).
By construction, this concept couples the shell phases to the V/R variability. However, even if the PSs were so small that the two emission components merged in spectra resolving them well, no inspiration seems to be emerging for the explanation of their observed crossing, wwhich implies a change in the direction of the gas motions from toward Earth to away from it and vice versa (Fig. 4). Moreover, although the He I lines did not participate in the V/R activity, their PS variations were as in the lines of other ionic species (Baldwin 1939b; see Sect. 4.2.2).
A second alternative model is disk warping due to misalignment of the companion orbit and Be star spin axis (Martin et al. 2011; Okazaki 2016; Suffak et al. 2022). Okazaki (2016) mentioned γ Cas and 59 Cyg as examples of Be stars that may have experienced disk warping and precession. The models by Suffak et al. (2022, cf. Sect. 7.3.6) show that the disk inclination can oscillate by a relatively large angle once mass injection into the disk ceases, and it is possible that such swings in inclination could cause the observed shell phases. Marr et al. (2022) describe the disk tearing that may result in such misalignment cases. A second outer torn disk could help explain the appearance of two sets of V and R emission peaks (from two disks) and also the very narrow emission width seen when the emission strength is large. For example, disk gas moved into a torn outer disk would have a small orbital velocity (for either the Keplerian or angular-momentum-conserving cases) and could create a narrow (low orbital velocity) and strong emission peak (large projected area in the sky) before expanding and dissipating.
Warping is an obvious way to produce direct transitions between Be and Be-shell phases and vice versa. In fact, Baade et al. (in prep.) recently inferred several such cases from differences in the shell characteristics of lines formed in the inner and the outer disk. Such differences have not been observed in γ Cas, and 59 Cyg has probably not exhibited them, either. The same is true for the single-line stages of the two stars whereas warping would not affect the entire disk alike unless the pivotal point of the warping is within the star when disk warping becomes equivalent to disk tilting. As for the turning-disk model, the coupling to the V/R variability remains unexplained. The tearing of the disk into an inner and a disconnected outer disk would in the Keplerian as well as the angular-momentum-conserving produce very different emission PSs. But, in γ Cas, the sharp components varied over about the same range in RV as the main, broad components (Sect. 4.4).
Any model for the explanation of the historical, extreme variability of γ Cas and 59 Cyg must explain that (i) all cir-cumstellar lines alternated twice between shell and single-line profiles and (ii), during the single-line stage, the direction of the gas motion changed between toward and away from the observer. A disk rotating over the poles is the qualitatively simplest way to reproduce these observations. The resulting challenges are considerable (Sect. 7.3.7).
8 Conclusions
Although Cleminshaw’s and Baldwin’s probably wrong interpretation of the RV curves of γ Cas (Sect. 7.3.1) proved quantitatively misleading, Hummel (1998) broke an important mental barrier by considering a Be disk with a nonstationary orientation in space. As anticipated by Hummel, binarity opens the door to the physics of such changes (Sect. 7.3.6). Once this concept is extended to the notion of disks at different times being viewed edge-on as well as face-on and accepted as an explanation of the extreme historical variations of γ Cas and 59 Cyg, there will be encouraging evidence that this assumption reproduces a fair part of the complex network of variabilities of the observables. Although the V/R ratio is the most conspicuous observable, it may be of only secondary importance for the understanding of the unusual high-amplitude variations of γ Cas and especially 59 Cyg.
The linking of earlier qualitative explanations of the correlated variations of V/R ratios in optical emission lines and UV wind lines has strengthened the conclusion that it is caused by the radiative ablation of density humps above the plane of the disk. The difference in the wind and mass-loss properties of B and Be stars should also be sought in the removal of matter that remains at low gravity in the disk.
The term ‘disk’ should not be taken to mean a structure that is flat at all times. In disks around isolated stars, disk-deforming effects are not expected to easily overcome the significant viscous forces. However, the large width of shell-like absorptions in 59 Cyg, high velocities of shell absorptions in both stars, and, in γ Cas, with time increasing frequency of rapid variations in absorption and emission lines, differences in the dynamics of the disk regions contributing to the V and R peaks, and the temporary appearance of sharp emission components suggest that strong forces did act on the disk, distorted it, made it clumpy, and ultimately perhaps even tore it apart. A fanned-up disk may additionally be a way to produce the large brightening of γ Cas in 1936.
Three-body interactions offer an explanation of the apparent violation of the conservation of angular momentum in the disk and the breakage of Struve’s law for the correlation between stellar υ sin i and emission-peak separation. However, it is not known if the conditions prevailing in the disks of γ Cas and 59 Cyg at the times of their special variations matched the configurations simulated for Be disks so far. This critically concerns the need in these simulations for a strong initial misalignment between the planes of the Be disk and the orbit of the companion which is not expected from close binary evolution.
The variations in γ Cas were at the fast end of the simulations by Suffak et al. (2020) and in both stars probably attained higher amplitudes. This may motivate searches for resonances. As additional parameters, future modeling efforts could possibly consider the seed ellipticity imposed on particle orbits by a preexisting m = 1 density wave, the pileup of matter in a strongly developed disk, and an accompanying suspension of the feeding of the disk. A seed torque results from the offset of the density maximum of the disk from the primary’s equatorial plane (Sect. 3.2). Interferometric detection of the companions would answer the questions about the misalignment and its variation, especially since the orbital periods of many Be binaries are convenient. Additional companions may offer another mechanism leading to disk-orbit misalignments. Large changes in disk aspect angles can also be detected by linear polarimetry. Timely announcements result from major variations in the separation of optical emission peaks.
The activity in γ Cas in the 1930s and 1940s is often referred to as the star’s ‘Great Outburst’. However, scrutiny of the historical observations could not uncover clear symptoms of an outburst in the sense of a mass-loss event. On the contrary, the mass injection rate into the disk may have been temporarily reduced, at least at the end of the high-activity phases of both stars. A reduced mass-injection rate would lower the viscous coupling of the disk to the B star so that the disk could be tilted – or even rotated – by the companion. On the other hand, the disk must be extended enough for the companion to exert a strong gravitational effect on it. In both stars, this second condition was very probably fulfilled because the line emission was strong at the onset of the high-amplitude variations.
Tilting and turning disks add to the menagerie of phenomena observable in Be stars. However, since it seems that the high-activity phases of γ Cas and 59 Cyg can be described along this added dimension of the Be-star parameter space, this unification of γ Cas and 59 Cyg with the other Be stars would actually reduce the diversity of Be stars. In particular, understanding (or not) the tilting of Be disks has no impact on the understanding of the Be phenomenon. A welcome side effect would be that the permitted diversity of explanations of the Be phenomenon would shrink. The downside of tilting disks is that it cannot automatically be trusted that, at the epoch of a given observation, the disk of a Be star was equatorial.
Between spatially stationary disks and disk planes making a full turn, there should be a continuum of intermediate cases. A first search for such events has been undertaken in the literature and databases (Baade et al., in prep.). The cases found are not statistically representative but suggest that major disk tilting events (i) are rare, (ii) are not generally linked to V/R activity, (iii) can have accelerations that are as fast and timescales that are as short as those observed in γ Cas and 59 Cyg, and (iv) can lead to both shell and single-line stages in one and the same star. Warping disks have also been identified. As have been cases, in which 3D effects of one-armed disk oscillations probably dominate. The results may provide a first glimpse of whether tilting Be disks are merely interesting or convey information about physical processes that are worth learning more about.
Hardly any of the early ideas to elucidate the nature of the extreme variations of γ Cas and 59 Cyg have survived. But the carefully documented observations have, and new ideas can still be tried on them, as a tribute to the scientific method.
Acknowledgements
We warmly thank Professor Douglas Gies, whose referee report enabled us to clarify and correct various aspects of the paper. We especially acknowledge the motivation he provided for the discussion in Sect. 7.4. D.B. sincerely thanks Mrs. Sarah Burbidge for providing him with a copy of her mother’s PhD thesis; we appreciate her generous permission to reproduce Appendix A from that thesis. D.B. is grateful to Prof. Ian Howarth for having established the contact with Mrs. Burbidge. We acknowledge with gratitude the permission by the editors of the Journal of the Royal Astronomical of Canada to reproduce the figure in Heard (1938) as our Fig. 4. This work has made use of NASA’s Astrophysics Data System (ADS) bibliographic services, the SIMBAD database, operated at CDS, Strasbourg, France, and the Be Star Spectra (BeSS) database, operated at LESIA, Observatoire de Meudon, France (http://basebe.obspm.fr). The authors warmly thank the BeSS observers, most notably Eric Bruyssinck, Christian Buil, Bertrand de Batz, Joan Guarra Flo, Keith Graham, Benjamin Mauclaire, Coralie Neiner, and Carl Sawicki, for obtaining and publicly sharing their spectra, and they acknowledge with thanks the variable star observations from the AAVSO International Database contributed by observers worldwide and used in this research. This work makes use of observations from the Las Cumbres Observatory global telescope network with the NRES instruments at the Cerro Tololo Interamer-ican Observatory, McDonald Observatory, and Wise Observatory. This paper includes data collected by the TESS mission, which are publicly available from the Mikulski Archive for Space Telescopes (MAST). Funding for the TESS mission is provided by NASA’s Science Mission directorate. This research made use of Lightkurve, a Python package for Kepler and TESS data analysis (Lightkurve Collaboration 2018). This research made use of Astropy (http://www.astropy.org), a community-developed core Python package for Astronomy (Astropy Collaboration 2013, 2018). J.L.-B. acknowledges support from FAPESP (grant 2017/23731-1). A.C.C. acknowledges support from CNPq (grant 311446/2019-1) and FAPESP (grants 2018/04055-8 and 2019/13354-1).
Appendix A Burbidge’s comparison of her and V. Hase’s observations (1940 August - November)
The following text (in italics) forms an addendum to Burbidge’s PhD thesis (Peachey 1943). A summary of her own observations was published a year before (Peachey 1942).
On 1943 March 8 the writer’s attention was drawn to an interesting paper by V. Hase, in the Bulletin of the Academy of Sciences of the Georgian S.S.R. V. III, no. 1, 194212, which describes changes he13 observed in the spectrum of γ Cas-siopeiae between 1940 August 5 and November 20. It will be noted that the whole of this period is covered by the observations recorded in the present paper. Both sets of observations and their discussions were entirely independent and thus provide mutual corroboration which both the observers very naturally desired but hardly hoped to obtain. The almost complete agreement in the results will be seen to be striking.
Hase observed a sudden change in the appearance of the lines, occurring between September 4 and 7. The hydrogen lines, which had been sharp absorptions, became diffuse, excepting Hß and Ha (the latter being still strong in emission). He observed that HeI 4471 and 4026 were also broadened, and only the line Hζ+HeI 3889 remained unchanged. The changes became more marked on September 10, and then on September 13 all lines again appeared as on September 4. Hase observed these lines to become diffuse again on October 6, and then to narrow and become sharp once more on November 20, although much weaker than they had been before October 6.
Hase observed short period changes occurring in the appearance of individual lines, notably Hβ, Hα, and the HeI lines, and noted that HeI 3965 sometimes had a faint emission on its violet side. On September 10, he observed Hβ for the first time as a strong double emission, with the central absorption hardly seen. He says: “Hβ looks different almost on every plate. This phenomenon being seen also, although without certainty, on previous dates, we may suspect that Hβ is subject to temporary variations of very short duration, a suggestion, which needs to be proved. “(Hß does not come within the range covered by the Mill Hill14 plates, and it is interesting that short-period changes have been established in this line also.)
Hase observed a broad diffuse emission on the side of longer wavelength of HeI 4471; it was very faint and not always visible. He mentioned that if this were ascribed to HeI, it would indicate anomaly, since the lower member of that series,λ5876, had only very faint emission components, not always visible, and traces ofan absorption companion. (Apparently, he did not observe a broad emission accompanying HeI 4026.)
He observed the emission borders of the hydrogen lines, and noted that while the absorption lines were strong and sharp, the violet emissions were stronger than the red, and after the lines had become diffuse, shallow absorptions, the emissions became vanishingly faint, with the red stronger than the violet. He observed the weakening of the emission borders to begin on September 21.
Hase found wavelength changes which he attributed to a sudden increase of negative velocity of 15 km/sec. when the lines
became diffuse. As regards the magnitude of the change, there is no disagreement, for if the wavelength changes for the six lines given on p. 53 are converted to km/secs and the mean taken, a value of 17 km/sec is obtained, which is in good agreement with Hase’s value. As regards the date of the change, however, there appears to be a small discrepancy. Hase observed the change to occur with the broadening of the lines whereas in the present paper the change was found to occur at about September 21, and the lines did not broaden until after October 2.
References
- Alves, F. O., Caselli, P., Girart, J. M., et al. 2019, Science, 366, 90 [NASA ADS] [CrossRef] [Google Scholar]
- Andrillat, Y., & Fehrenbach, C. 1982, A & AS, 48, 93 [NASA ADS] [Google Scholar]
- Ashbrook, J. 1940, AJ, 49, 29 [NASA ADS] [CrossRef] [Google Scholar]
- Astropy Collaboration (Robitaille, T. P., et al.) 2013, A & A, 558, A33 [NASA ADS] [CrossRef] [EDP Sciences] [Google Scholar]
- Astropy Collaboration (Price-Whelan, A. M., et al.) 2018, AJ, 156, 123 [Google Scholar]
- Baade, D., & Rivinius, T. 2020, in Proceedings of the Conf. Stars and their Variability Observed from Space, 35 [Google Scholar]
- Baade, D., Rivinius, T., Pigulski, A., et al. 2018, in 3rd BRITE Science Conf., 8, 69 [NASA ADS] [Google Scholar]
- Baize, P. 1936, L’Astronomie, 50, 395 [Google Scholar]
- Baldwin, R. B. 1938, ApJ, 87, 573 [NASA ADS] [CrossRef] [Google Scholar]
- Baldwin, R. B. 1939a, ApJ, 90, 204 [NASA ADS] [CrossRef] [Google Scholar]
- Baldwin, R. B. 1939b, ApJ, 89, 255 [NASA ADS] [CrossRef] [Google Scholar]
- Baldwin, R. B. 1940, ApJ, 92, 82 [NASA ADS] [CrossRef] [Google Scholar]
- Baldwin, R. B. 1941a, Popular Astron., 49, 419 [NASA ADS] [Google Scholar]
- Baldwin, R. B. 1941b, ApJ, 94, 283 [NASA ADS] [CrossRef] [Google Scholar]
- Baldwin, R. B. 1941c, ApJ, 93, 333 [NASA ADS] [CrossRef] [Google Scholar]
- Baldwin, R. B. 1942, Sky Telesc., 1, 5 [NASA ADS] [Google Scholar]
- Baldwin, R. B., & Torp-Smith, R. 1941, Popular Astron., 49, 127 [NASA ADS] [Google Scholar]
- Barker, P. K. 1979, PhD thesis, University of Colorado Boulder, USA [Google Scholar]
- Barker, P. K. 1982, ApJS, 49, 89 [NASA ADS] [CrossRef] [Google Scholar]
- Barker, P. K. 1983, AJ, 88, 72 [NASA ADS] [CrossRef] [Google Scholar]
- Beeckmans, F. 1976, A & A, 52, 465 [NASA ADS] [Google Scholar]
- Belorizky, D., & Fehrenbach, C. 1947, Annales d'Astrophysique, 10, 39 [NASA ADS] [Google Scholar]
- Berio, P., Stee, P., Vakili, F., et al. 1999, A & A, 345, 203 [NASA ADS] [Google Scholar]
- Bernhard, K., Otero, S., Hümmerich, S., et al. 2018, MNRAS, 479, 2909 [NASA ADS] [CrossRef] [Google Scholar]
- Bjorkman, K. S., Miroshnichenko, A. S., McDavid, D., & Pogrosheva, T. M. 2002, ApJ, 573, 812 [Google Scholar]
- Bodensteiner, J., Shenar, T., & Sana, H. 2020, A & A, 641, A42 [NASA ADS] [CrossRef] [EDP Sciences] [Google Scholar]
- Bondar’, N. I. 2018, Res. Astron. Astrophys., 18, 099 [CrossRef] [Google Scholar]
- Borre, C. C., Baade, D., Pigulski, A., et al. 2020, A & A, 635, A140 [NASA ADS] [CrossRef] [EDP Sciences] [Google Scholar]
- Burbidge, E. M., & Burbidge, G. R. 1951, ApJ, 113, 84 [NASA ADS] [CrossRef] [Google Scholar]
- Burbidge, E. M., & Burbidge, G. R. 1955, The Observatory, 75, 256 [NASA ADS] [Google Scholar]
- Burbidge, E. M., Burbidge, G. R., & Wang, S. K. 1952, ApJ, 115, 66 [NASA ADS] [CrossRef] [Google Scholar]
- Carciofi, A. C. 2011, IAU Symp., 272, 325 [NASA ADS] [Google Scholar]
- Carciofi, A. C., Domiciano de Souza, A., Magalhães, A. M., Bjorkman, J. E., & Vakili, F. 2008, ApJ, 676, L41 [NASA ADS] [CrossRef] [Google Scholar]
- Carciofi, A. C., Okazaki, A. T., Le Bouquin, J.-B., et al. 2009, A & A, 504, 915 [NASA ADS] [CrossRef] [EDP Sciences] [Google Scholar]
- Chauville, J., Zorec, J., Ballereau, D., et al. 2001, A & A, 378, 861 [NASA ADS] [CrossRef] [EDP Sciences] [Google Scholar]
- Cherrington, E. J., 1937, PASP, 49, 91 [NASA ADS] [CrossRef] [Google Scholar]
- Cherrington, E. J., 1938, Popular Astron., 46, 183 [NASA ADS] [Google Scholar]
- Chojnowski, S. D., Labadie-Bartz, J., Rivinius, T., et al. 2018, ApJ, 865, 76 [NASA ADS] [CrossRef] [Google Scholar]
- Cleminshaw, C. H. 1936, ApJ, 83, 495 [NASA ADS] [CrossRef] [Google Scholar]
- Cowley, A., & Gugula, E. 1973, A & A, 22, 203 [NASA ADS] [Google Scholar]
- Cowley, A. P., & Marlborough, J. M. 1968, PASP, 80, 42 [NASA ADS] [CrossRef] [Google Scholar]
- Cowley, A. P., Rogers, L., & Hutchings, J. B. 1976, PASP, 88, 911 [NASA ADS] [CrossRef] [Google Scholar]
- Curtiss, R. H. 1916, Pub. Michigan Observ., 2, 1 [NASA ADS] [Google Scholar]
- Cyr, R. P., Jones, C. E., & Tycner, C. 2015, ApJ, 799, 33 [NASA ADS] [CrossRef] [Google Scholar]
- Cyr, I. H., Jones, C. E., Panoglou, D., Carciofi, A. C., & Okazaki, A. T. 2017, MNRAS, 471, 596 [NASA ADS] [CrossRef] [Google Scholar]
- Cyr, I. H., Jones, C. E., Carciofi, A. C., et al. 2020, MNRAS, 497, 3525 [NASA ADS] [CrossRef] [Google Scholar]
- de Roy, F. 1936, L’Astronomie, 50, 513 [Google Scholar]
- de Wit, W. J., Lamers, H. J. G. L. M., Marquette, J. B., & Beaulieu, J. P. 2006, A & A, 456, 1027 [NASA ADS] [CrossRef] [EDP Sciences] [Google Scholar]
- Doazan, V., Briot, D., & Bourdonneau, B. 1975, A & A, 42, 161 [NASA ADS] [Google Scholar]
- Doazan, V., Kuhi, L. V., & Thomas, R. N. 1980, ApJ, 235, L17 [NASA ADS] [CrossRef] [Google Scholar]
- Doazan, V., Franco, M., Rusconi, L., Sedmak, G., & Stalio, R. 1983, A & A, 128, 171 [NASA ADS] [Google Scholar]
- Doazan, V., Grady, C. A., Snow, T. P., et al. 1985, A & A, 152, 182 [NASA ADS] [Google Scholar]
- Doazan, V., Rusconi, L., Sedmak, G., Thomas, R. N., & Bourdonneau, B. 1987, A & A, 182, L25 [NASA ADS] [Google Scholar]
- Doazan, V., Barylak, M., Rusconi, L., et al. 1989, A & A, 210, 249 [NASA ADS] [Google Scholar]
- Draper, Z. H., Wisniewski, J. P., Bjorkman, K. S., et al. 2014, ApJ, 786, 120 [NASA ADS] [CrossRef] [Google Scholar]
- Dulaney, N. A., Richardson, N. D., Gerhartz, C. J., et al. 2017, ApJ, 836, 112 [NASA ADS] [CrossRef] [Google Scholar]
- Duval, M., Lacoarret, M., Herman, R., & Hubert, H. 1975, Académie des Sciences Paris Comptes Rendus Série B Sciences Physiques, 280, 193 [Google Scholar]
- Edwards, D. L. 1942, MNRAS, 102, 246 [NASA ADS] [CrossRef] [Google Scholar]
- Edwards, D. L. 1943, MNRAS, 103, 222 [NASA ADS] [CrossRef] [Google Scholar]
- Edwards, D. L. 1944, MNRAS, 104, 283 [NASA ADS] [CrossRef] [Google Scholar]
- Edwards, D. L. 1956, Vistas Astron., 2, 1470 [NASA ADS] [CrossRef] [Google Scholar]
- Eggleton, P. P. 1983, ApJ, 268, 368 [Google Scholar]
- Escolano, C., Carciofi, A. C., Okazaki, A. T., et al. 2015, A & A, 576, A112 [NASA ADS] [CrossRef] [EDP Sciences] [Google Scholar]
- Franchini, A., & Martin, R. G. 2019, ApJ, 881, L32 [NASA ADS] [CrossRef] [Google Scholar]
- Frémat, Y., Zorec, J., Hubert, A.-M., & Floquet, M. 2005, A & A, 440, 305 [CrossRef] [EDP Sciences] [Google Scholar]
- Gaia Collaboration 2018, VizieR Online Data Catalog: I/345 [Google Scholar]
- Gaia Collaboration (Eyer, L., et al.) 2019, A & A, 623, A110 [NASA ADS] [CrossRef] [EDP Sciences] [Google Scholar]
- Gaia Collaboration 2020, VizieR Online Data Catalog: I/350 [Google Scholar]
- Gerhartz, C. J. 2017, PhD thesis, The University of Toledo, USA [Google Scholar]
- Gies, D. R. 2000, ASP Conf. Ser., 214, 668 [NASA ADS] [Google Scholar]
- Gies, D. R., Lester, K. V., Wang, L., et al. 2020, AJ, 902, 25 [NASA ADS] [CrossRef] [Google Scholar]
- Gies, D. R., Wang, L., & Klement, R. 2023, ApJ, 942, L6 [NASA ADS] [CrossRef] [Google Scholar]
- Gontcharov, G. A., Andronova, A. A., & Titov, O. A. 2000, A & A, 355, 1164 [NASA ADS] [Google Scholar]
- Grady, C. A., Bjorkman, K. S., & Snow, T. P. 1987, ApJ, 320, 376 [NASA ADS] [CrossRef] [Google Scholar]
- Grady, C. A., Bjorkman, K. S., Snow, T. P., et al. 1989, ApJ, 339, 403 [NASA ADS] [CrossRef] [Google Scholar]
- Hamaguchi, K., Oskinova, L., Russell, C. M. P., et al. 2016, ApJ, 832, 140 [NASA ADS] [CrossRef] [Google Scholar]
- Hanuschik, R. W. 1987, A & A, 173, 299 [NASA ADS] [Google Scholar]
- Hanuschik, R. W. 1996, A & A, 308, 170 [NASA ADS] [Google Scholar]
- Hanuschik, R. W., Hummel, W., Dietle, O., & Sutorius, E. 1995, A & A, 300, 163 [NASA ADS] [Google Scholar]
- Hanuschik, R. W., Hummel, W., Sutorius, E., Dietle, O., & Thimm, G. 1996, A & AS, 116, 309 [NASA ADS] [Google Scholar]
- Harmanec, P. 2002, ASP Conf. Ser., 279, 221 [NASA ADS] [Google Scholar]
- Harmanec, P., Habuda, P., Štefl, S., et al. 2000, A & A, 364, L85 [NASA ADS] [Google Scholar]
- Harmanec, P., Bozić, H., Percy, J. R., et al. 2002, A & A, 387, 580 [NASA ADS] [CrossRef] [EDP Sciences] [Google Scholar]
- Harmanec, P., Švanda, M., Korčáková, D., et al. 2019, ApJ, 875, 13 [NASA ADS] [CrossRef] [Google Scholar]
- Hase, V. 1942, Bull. Acad. Sci. Georgian SSR, III, 15 [Google Scholar]
- Haubois, X., Carciofi, A. C., Rivinius, T., Okazaki, A. T., & Bjorkman, J. E. 2012, ApJ, 756, 156 [Google Scholar]
- Heard, J. F. 1935, ApJ, 81, 341 [NASA ADS] [CrossRef] [Google Scholar]
- Heard, J. F. 1937, J. R. Astron. Soc. Can., 31, 60 [NASA ADS] [Google Scholar]
- Heard, J. F. 1938, J. R. Astron. Soc. Can., 32, 353 [NASA ADS] [Google Scholar]
- Herman, R., & Hubert, H. 1976, IAU Symp., 70, 95 [NASA ADS] [Google Scholar]
- Hiltner, W. A. 1941, ApJ, 93, 505 [NASA ADS] [CrossRef] [Google Scholar]
- Hirata, R. 1995, PASJ, 47, 195 [NASA ADS] [Google Scholar]
- Hirata, R. 2007, ASP Conf. Ser., 361, 267 [NASA ADS] [Google Scholar]
- Hirata, R., Hubert-Delplace, A. M., & Groupe Étoiles Variables de l’Observatoire de Nice 1981, in Pulsating B-Stars, ed. C. Sterken (Nice: Nice Observatory), 217 [Google Scholar]
- Horaguchi, T., Kogure, T., Hirata, R., et al. 1994, PASJ, 46, 9 [NASA ADS] [Google Scholar]
- Howarth, I. D. 1979, J. British Astron. Assoc., 89, 378 [NASA ADS] [Google Scholar]
- Howarth, I. D., & Prinja, R. K. 1989, ApJS, 69, 527 [NASA ADS] [CrossRef] [Google Scholar]
- Huang, L., Hsu, J. C., & Guo, Z. H. 1989, A & AS, 78, 431 [NASA ADS] [Google Scholar]
- Hubert-Delplace, A. M., & Hubert, H. 1981, A & AS, 44, 109 [NASA ADS] [Google Scholar]
- Huffer, C. M. 1939, ApJ, 89, 139 [NASA ADS] [CrossRef] [Google Scholar]
- Hummel, W. 1998, A & A, 330, 243 [NASA ADS] [Google Scholar]
- Hummel, W., & Štefl, S. 2001, A & A, 368, 471 [NASA ADS] [CrossRef] [EDP Sciences] [Google Scholar]
- Hutchings, J. B., & Stoeckley, T. R. 1977, PASP, 89, 19 [NASA ADS] [CrossRef] [Google Scholar]
- Hutter, D. J., Tycner, C., Zavala, R. T., et al. 2021, ApJS, 257, 69 [NASA ADS] [CrossRef] [Google Scholar]
- Ito, T., & Ohtsuka, K. 2019, Monographs Environ. Earth Planets, 7, 1 [CrossRef] [Google Scholar]
- Iwamatsu, H., & Hirata, R. 2008, PASJ, 60, 749 [NASA ADS] [CrossRef] [Google Scholar]
- Jackson, B. V., Buffington, A., Hick, P. P., et al. 2004, Sol. Phys., 225, 177 [NASA ADS] [CrossRef] [Google Scholar]
- Janka, H.-T. 2012, Ann. Rev. Nucl. Part. Sci., 62, 407 [Google Scholar]
- Johnson, M. 1958, Liege Intern. Astrophys. Coll., 8, 219 [NASA ADS] [Google Scholar]
- Katahira, J.-I., Hirata, R., Ito, M., et al. 1996, PASJ, 48, 317 [NASA ADS] [CrossRef] [Google Scholar]
- Kee, N. D., Owocki, S., & Kuiper, R. 2018, MNRAS, 479, 4633 [CrossRef] [Google Scholar]
- Kervella, P., Domiciano de Souza, A., & Bendjoya, P. 2008, A & A, 484, L13 [NASA ADS] [CrossRef] [EDP Sciences] [Google Scholar]
- Kervella, P., Borgniet, S., Domiciano de Souza, A., et al. 2022, A & A, 667, A111 [NASA ADS] [CrossRef] [EDP Sciences] [Google Scholar]
- Klement, R., Carciofi, A. C., Rivinius, T., et al. 2015, A & A, 584, A85 [NASA ADS] [CrossRef] [EDP Sciences] [Google Scholar]
- Klement, R., Carciofi, A. C., Rivinius, T., et al. 2017, A & A, 601, A74 [NASA ADS] [CrossRef] [EDP Sciences] [Google Scholar]
- Klement, R., Carciofi, A. C., Rivinius, T., et al. 2019, ApJ, 885, 147 [Google Scholar]
- Klement, R., Hadrava, P., Rivinius, T., et al. 2021, ApJ, 916, 24 [NASA ADS] [CrossRef] [Google Scholar]
- Klement, R., Baade, D., Rivinius, T., et al. 2022a, ApJ, 940, 86 [NASA ADS] [CrossRef] [Google Scholar]
- Klement, R., Schaefer, G. H., Gies, D. R., et al. 2022b, ApJ, 926, 213 [NASA ADS] [CrossRef] [Google Scholar]
- Kogure, T., Asada, Y., Ichimoto, K., & Suzuki, M. 1981, Inf. Bull. on Variable Stars, 1952, 1 [Google Scholar]
- Labadie-Bartz, J., Pepper, J., McSwain, M. V., et al. 2017, AJ, 153, 252 [NASA ADS] [CrossRef] [Google Scholar]
- Labadie-Bartz, J., Chojnowski, S. D., Whelan, D. G., et al. 2018, AJ, 155, 53 [NASA ADS] [CrossRef] [Google Scholar]
- Labadie-Bartz, J., Baade, D., Carciofi, A. C., et al. 2021, MNRAS, 502, 242 [NASA ADS] [CrossRef] [Google Scholar]
- Labadie-Bartz, J., Carciofi, A. C., Henrique de Amorim, T., et al. 2022, AJ, 163, 226 [NASA ADS] [CrossRef] [Google Scholar]
- Langer, N., Baade, D., Bodensteiner, J., et al. 2020, A & A, 633, A40 [NASA ADS] [CrossRef] [EDP Sciences] [Google Scholar]
- Lightkurve Collaboration (Cardoso, J. V. d. M., et al.) 2018, Astrophysics Source Code Library [record ascl:1812.813] [Google Scholar]
- Lockyer, W. J. S. 1933a, MNRAS, 93, 619 [NASA ADS] [CrossRef] [Google Scholar]
- Lockyer, W. J. S. 1933b, MNRAS, 93, 362 [NASA ADS] [CrossRef] [Google Scholar]
- Lockyer, W. J. S. 1935, MNRAS, 95, 520 [NASA ADS] [CrossRef] [Google Scholar]
- Lubow, S. H. 1992, ApJ, 398, 525 [NASA ADS] [CrossRef] [Google Scholar]
- Lubow, S. H. 2021, MNRAS, 507, 367 [NASA ADS] [CrossRef] [Google Scholar]
- Lubow, S. H., & Ogilvie, G. I. 2017, MNRAS, 469, 4292 [NASA ADS] [CrossRef] [Google Scholar]
- Maintz, M., Rivinius, T., Stahl, O., Stefl, S., & Appenzeller, I. 2005, Pub. Astron. Inst. Czechoslovak Acad. Sci., 93, 21 [Google Scholar]
- Marlborough, J. M. 1997, A & A, 317, L17 [NASA ADS] [Google Scholar]
- Marlborough, J. M., & Snow, T. P. J., 1980, ApJ, 235, 85 [NASA ADS] [CrossRef] [Google Scholar]
- Marr, K. C., Jones, C. E., & Halonen, R. J. 2018, ApJ, 852, 103 [NASA ADS] [CrossRef] [Google Scholar]
- Marr, K. C., Jones, C. E., Carciofi, A. C., et al. 2021, ApJ, 912, 76 [NASA ADS] [CrossRef] [Google Scholar]
- Marr, K. C., Jones, C. E., Tycner, C., Carciofi, A. C., & Silva, A. C. F. 2022, ApJ, 928, 145 [NASA ADS] [CrossRef] [Google Scholar]
- Martin, R. G., & Franchini, A. 2019, MNRAS, 489, 1797 [NASA ADS] [CrossRef] [Google Scholar]
- Martin, R. G., & Lepp, S. 2022, MNRAS, 516, L86 [NASA ADS] [CrossRef] [Google Scholar]
- Martin, R. G., Pringle, J. E., Tout, C. A., & Lubow, S. H. 2011, MNRAS, 416, 2827 [NASA ADS] [CrossRef] [Google Scholar]
- Martin, R. G., Zhu, Z., & Armitage, P. J. 2020, ApJ, 898, L26 [Google Scholar]
- Martin, R. G., Lepp, S., Lubow, S. H., et al. 2022, ApJ, 927, L26 [NASA ADS] [CrossRef] [Google Scholar]
- Matson, R. A., Gies, D. R., Guo, Z., et al. 2015, ApJ, 806, 155 [NASA ADS] [CrossRef] [Google Scholar]
- McLaughlin, D. B. 1932, Pub. Michigan Observ., 4, 175 [NASA ADS] [Google Scholar]
- McLaughlin, D. B. 1936, ApJ, 84, 235 [NASA ADS] [CrossRef] [Google Scholar]
- McLaughlin, D. B. 1961, J. R. Astron. Soc. Can., 55, 73 [NASA ADS] [Google Scholar]
- McLaughlin, D. B. 1962, AJ, 67, 581 [CrossRef] [Google Scholar]
- Mennickent, R. E., & Vogt, N. 1991, A & A, 241, 159 [NASA ADS] [Google Scholar]
- Mennickent, R. E., Vogt, N., Barrera, L. H., Covarrubias, R., & Ramirez, A. 1994, A & AS, 106, 427 [NASA ADS] [Google Scholar]
- Mennickent, R. E., Sterken, C., & Vogt, N. 1997, A & A, 326, 1167 [NASA ADS] [Google Scholar]
- Miroshnichenko, A. S., Bjorkman, K. S., & Krugov, V. D. 2002, PASP, 114, 1226 [NASA ADS] [CrossRef] [Google Scholar]
- Mon, M., Suzuki, M., Moritani, Y., & Kogure, T. 2013, PASJ, 65, 77 [NASA ADS] [Google Scholar]
- Mourard, D., Monnier, J. D., Meilland, A., et al. 2015, A & A, 577, A51 [NASA ADS] [CrossRef] [EDP Sciences] [Google Scholar]
- Müller, P. E., & Vink, J. S. 2014, A & A, 564, A57 [CrossRef] [EDP Sciences] [Google Scholar]
- Nazé, Y., Rauw, G., & Pigulski, A. 2020, MNRAS, 498, 3171 [CrossRef] [Google Scholar]
- Nazé, Y., Rauw, G., Czesla, S., Smith, M. A., & Robrade, J. 2022, MNRAS, 510, 2286 [CrossRef] [Google Scholar]
- Neiner, C., de Batz, B., Cochard, F., et al. 2011, AJ, 142, 149 [Google Scholar]
- Nemravová, J., Harmanec, P., Kubát, J., et al. 2010, A & A, 516, A80 [CrossRef] [EDP Sciences] [Google Scholar]
- Nemravová, J., Harmanec, P., Koubský, P., et al. 2012, A & A, 537, A59 [CrossRef] [EDP Sciences] [Google Scholar]
- Ogilvie, G. I. 2008, MNRAS, 388, 1372 [NASA ADS] [Google Scholar]
- Okazaki, A. T. 1993, Ap & SS, 210, 369 [NASA ADS] [CrossRef] [Google Scholar]
- Okazaki, A. T. 1996, PASJ, 48, 305 [NASA ADS] [CrossRef] [Google Scholar]
- Okazaki, A. T. 1997, A & A, 318, 548 [NASA ADS] [Google Scholar]
- Okazaki, A. T. 2016, ASP Conf. Ser., 506, 3 [NASA ADS] [Google Scholar]
- Okazaki, A. T., & Negueruela, I. 2001, A & A, 377, 161 [NASA ADS] [CrossRef] [EDP Sciences] [Google Scholar]
- Oktariani, F., & Okazaki, A. T. 2009, PASJ, 61, 57 [NASA ADS] [Google Scholar]
- Oktariani, F., Okazaki, A. T., Kunjaya, C., & Aprilia. 2016, MNRAS, 459, 4440 [NASA ADS] [CrossRef] [Google Scholar]
- Panoglou, D., Carciofi, A. C., Vieira, R. G., et al. 2016, MNRAS, 461, 2616 [Google Scholar]
- Panoglou, D., Faes, D. M., Carciofi, A. C., et al. 2018, MNRAS, 473, 3039 [NASA ADS] [CrossRef] [Google Scholar]
- Panoglou, D., Borges Fernandes, M., Baade, D., et al. 2019, MNRAS, 486, 5139 [NASA ADS] [CrossRef] [Google Scholar]
- Papaloizou, J. C., Savonije, G. J., & Henrichs, H. F. 1992, A & A, 265, L45 [NASA ADS] [Google Scholar]
- Peachey, E. M. 1942, MNRAS, 102, 166 [NASA ADS] [CrossRef] [Google Scholar]
- Peachey, E. M. 1943, PhD thesis, University of London, University College, UK Peters, G. J. 2000, ASP Conf. Ser., 214, 212 [Google Scholar]
- Peters, G. J., Pewett, T. D., Gies, D. R., Touhami, Y. N., & Grundstrom, E. D. 2013, ApJ, 765, 2 [Google Scholar]
- Peters, G. J., Wang, L., Gies, D. R., & Grundstrom, E. D. 2016, ApJ, 828, 47 [Google Scholar]
- Pfahl, E., Rappaport, S., Podsiadlowski, P., & Spruit, H. 2002, ApJ, 574, 364 [Google Scholar]
- Podsiadlowski, P., Langer, N., Poelarends, A. J. T., et al. 2004, ApJ, 612, 1044 [NASA ADS] [CrossRef] [Google Scholar]
- Poeckert, R., & Marlborough, J. M. 1976, ApJ, 206, 182 [NASA ADS] [CrossRef] [Google Scholar]
- Poeckert, R., & Marlborough, J. M. 1977, ApJ, 218, 220 [NASA ADS] [CrossRef] [Google Scholar]
- Poeckert, R., Bastien, P., & Landstreet, J. D. 1979, AJ, 84, 812 [NASA ADS] [CrossRef] [Google Scholar]
- Postnov, K., Oskinova, L., & Torrejón, J. M. 2017, MNRAS, 465, L119 [Google Scholar]
- Pottasch, S. R. 1959, Nat. Bureau Standards, Technical Note, 21, 1 [Google Scholar]
- Prinja, R. K. 1989, MNRAS, 241, 721 [NASA ADS] [CrossRef] [Google Scholar]
- Quirrenbach, A., Bjorkman, K. S., Bjorkman, J. E., et al. 1997, ApJ, 479, 477 [NASA ADS] [CrossRef] [Google Scholar]
- Rappaport, S., Podsiadlowski, P., & Horev, I. 2009, ApJ, 698, 666 [NASA ADS] [CrossRef] [Google Scholar]
- Rauw, G. 2022, in Handbook of X-ray and Gamma-ray Astrophysics, eds. C. Bambi., & A. Santangelo (Berlin: Springer), 108 [Google Scholar]
- Reig, P. 2011, Ap & SS, 332, 1 [NASA ADS] [CrossRef] [Google Scholar]
- Reig, P., Nersesian, A., Zezas, A., Gkouvelis, L., & Coe, M. J. 2016, A & A, 590, A122 [NASA ADS] [CrossRef] [EDP Sciences] [Google Scholar]
- Ricker, G. R., Winn, J. N., Vanderspek, R., et al. 2015, J. Astron. Teles. Instrum. Syst., 1, 014003 [Google Scholar]
- Rigollet, R. 1936, L’Astronomie, 50, 572 [Google Scholar]
- Rímulo, L. R., Carciofi, A. C., Vieira, R. G., et al. 2018, MNRAS, 476, 3555 [Google Scholar]
- Rivinius, T., & Štefl, S. 2000, ASP Conf. Ser., 214, 581 [NASA ADS] [Google Scholar]
- Rivinius, T., Baade, D., Štefl, S., et al. 1998, A & A, 333, 125 [NASA ADS] [Google Scholar]
- Rivinius, T., Štefl, S., & Baade, D. 2006, A & A, 459, 137 [NASA ADS] [CrossRef] [EDP Sciences] [Google Scholar]
- Rivinius, T., Carciofi, A. C., & Martayan, C. 2013, A & A Rev., 21, 69 [NASA ADS] [Google Scholar]
- Roberts Lewis C. J., Turner, N. H., & ten Brummelaar, T. A. 2007, AJ, 133, 545 [NASA ADS] [CrossRef] [Google Scholar]
- Ruždjak, D., Božić, H., Harmanec, P., et al. 2009, A & A, 506, 1319 [CrossRef] [EDP Sciences] [Google Scholar]
- Schaefer, G. H., Gies, D. R., Monnier, J. D., et al. 2010, AJ, 140, 1838 [NASA ADS] [CrossRef] [Google Scholar]
- Secchi, A. 1866, Astron. Nachr., 68, 63 [Google Scholar]
- Semaan, T., Hubert, A. M., Zorec, J., et al. 2018, A & A, 613, A70 [NASA ADS] [CrossRef] [EDP Sciences] [Google Scholar]
- Shevchenko, I. I. 2017, The Lidov-Kozai Effect - Applications in Exoplanet Research and Dynamical Astronomy (Cham: Springer), 441 [Google Scholar]
- Slettebak, A. 1979, Space Sci. Rev., 23, 541 [NASA ADS] [CrossRef] [Google Scholar]
- Slettebak, A. 1982, ApJS, 50, 55 [NASA ADS] [CrossRef] [Google Scholar]
- Smallwood, J. L., Martin, R. G., & Lubow, S. H. 2021, ApJ, 907, L14 [NASA ADS] [CrossRef] [Google Scholar]
- Smith, B., & Struve, O. 1950, ApJ, 112, 192 [NASA ADS] [CrossRef] [Google Scholar]
- Smith, M. A., Lopes de Oliveira, R., & Motch, C. 2016, Adv. Space Res., 58, 782 [Google Scholar]
- Stee, P., Delaa, O., Monnier, J. D., et al. 2012, A & A, 545, A59 [NASA ADS] [CrossRef] [EDP Sciences] [Google Scholar]
- Štefl, S., Hummel, W., & Rivinius, T. 2000, A & A, 358, 208 [Google Scholar]
- Štefl, S., Okazaki, A. T., Rivinius, T., & Baade, D. 2007, ASP Conf. Ser., 361, 274 [Google Scholar]
- Štefl, S., Rivinius, T., Carciofi, A. C., et al. 2009, A & A, 504, 929 [CrossRef] [EDP Sciences] [Google Scholar]
- Struve, O. 1931, ApJ, 73, 94 [Google Scholar]
- Struve, O., & Elvey, C. T. 1940, PASP, 52, 140 [NASA ADS] [CrossRef] [Google Scholar]
- Suffak, M. W., Jones, C. E., Tycner, C., et al. 2020, ApJ, 890, 86 [NASA ADS] [Google Scholar]
- Suffak, M., Jones, C. E., & Carciofi, A. C. 2022, MNRAS, 509, 931 [Google Scholar]
- Sundqvist, J. O., Owocki, S. P., & Puls, J. 2018, A & A, 611, A17 [NASA ADS] [CrossRef] [EDP Sciences] [Google Scholar]
- Tanaka, K., Sadakane, K., Narusawa, S.-Y., et al. 2007, PASJ, 59, L35 [NASA ADS] [Google Scholar]
- Tarasov, A. E., & Tuominen, I. 1987, Pub. Astron. Inst. Czechoslovak Acad. Sci., 5, 127 [Google Scholar]
- Telting, J. H., & Kaper, L. 1994, A & A, 284, 515 [NASA ADS] [Google Scholar]
- Telting, J. H., Waters, L. B. F. M., Persi, P., & Dunlop, S. R. 1993, A & A, 270, 355 [NASA ADS] [Google Scholar]
- Telting, J. H., Heemskerk, M. H. M., Henrichs, H. F., & Savonije, G. J. 1994, A & A, 288, 558 [NASA ADS] [Google Scholar]
- Townsend, R. H. D., Owocki, S. P., & Howarth, I. D. 2004, MNRAS, 350, 189 [Google Scholar]
- Townsend, L. J., Coe, M. J., Corbet, R. H. D., & Hill, A. B. 2011, MNRAS, 416, 1556 [NASA ADS] [CrossRef] [Google Scholar]
- Tsujimoto, M., Morihana, K., Hayashi, T., & Kitaguchi, T. 2018, PASJ, 70, 109 [NASA ADS] [Google Scholar]
- Underhill, A. B., Doazan, V., Lesh, J. R., Aizenman, M. L., & Thomas, R. N. 1982, B Stars with and without Emission Lines. Monograph Series on Nonthermal Phenomena in Stellar Atmospheres (USA: NASA), 456 [Google Scholar]
- Vanderkerkhove, E. 1947, The Observatory, 67, 228 [NASA ADS] [Google Scholar]
- van Leeuwen, F. 2007, A & A, 474, 653 [NASA ADS] [CrossRef] [EDP Sciences] [Google Scholar]
- Vieira, R. G., Carciofi, A. C., Bjorkman, J. E., et al. 2017, MNRAS, 464, 3071 [NASA ADS] [CrossRef] [Google Scholar]
- Wade, G. A., Petit, V., Grunhut, J. H., Neiner, C., & MiMeS Collaboration. 2016, ASP Conf. Ser., 506, 207 [NASA ADS] [Google Scholar]
- Wade, G., Shultz, M., & Petit, V. 2021, in OBA Stars: Variability and Magnetic Fields, 23 [Google Scholar]
- Wang, L., Gies, D. R., & Peters, G. J. 2017, ApJ, 843, 60 [Google Scholar]
- Wang, L., Gies, D. R., Peters, G. J., et al. 2021, AJ, 161, 248 [Google Scholar]
- Weiss, W. W., Rucinski, S. M., Moffat, A. F. J., et al. 2014, PASP, 126, 573 [Google Scholar]
- Wenger, M., Ochsenbein, F., Egret, D., et al. 2000, A & AS, 143, 9 [NASA ADS] [Google Scholar]
- Wisniewski, J. P., Kowalski, A. F., Bjorkman, K. S., Bjorkman, J. E., & Carciofi, A. C. 2007, ApJ, 656, L21 [NASA ADS] [CrossRef] [Google Scholar]
- Wisniewski, J. P., Draper, Z. H., Bjorkman, K. S., et al. 2010, ApJ, 709, 1306 [NASA ADS] [CrossRef] [Google Scholar]
- Wongwathanarat, A., Janka, H. T., & Müller, E. 2013, A & A, 552, A126 [NASA ADS] [CrossRef] [EDP Sciences] [Google Scholar]
- Zorec, J., & Briot, D. 1997, A & A, 318, 443 [NASA ADS] [Google Scholar]
Be star disks are also radial outflows, as the ejected material expands radially owing to viscous forces. Therefore, orbits in Be disks are not closed (Carciofi 2011).
The systemic velocity determined in Paper II is −8.5 km s−1, in agreement with Harmanec et al. (2000) From observations before 1928, Pottasch (1959) adopted −7.0 km s−1.
The strongest lines were λλ 4173, 4233, 4303, 4352, 4385, and 4417 (part of multiplet 27 in https://nvlpubs.nist.gov/nistpubs/Legacy/NSRDS/nbsnsrds48.pdf).
Data not corrected for interstellar polarization downloaded from http://www.sal.wisc.edu/~meade/beatlas/59cyg.html
Data not corrected for interstellar polarization downloaded from http://www.sal.wisc.edu/~meade/beatlas/Table2.ccd
Probably, Bondar’ (2018) was referring to the same author when she wrote: “Vera Fedorovna Gaze (or V.Th. Hase) (1899–1954) was a researcher at Crimean Astrophysical Observatory”.
All Tables
Time dependence of very broadly defined local extrema (MAX/min) of main observables of γ Cas during its high-activity episode in 1932–1942.
Time dependence of absolute values of main observables of 59 Cyg during its high-activity episode in 1972–1976 and shortly before and after.
All Figures
|
Fig. 1 Graphical rendition of Table 1. The thumbnails at the top schematically indicate the inclination of the disk. Any changes in PA due to precession are not included. Exceptionally, the sign is dropped from the EW so that higher EW means stronger line emission. |
| In the text | |
|
Fig. 2 Graphical rendition of Table 2. The thumbnails at the top schematically indicate the inclination of the disk. Any changes in PA due to precession are not included. Exceptionally, the sign is dropped from the EW so that higher EW means stronger line emission. |
| In the text | |
|
Fig. 3 Hα (left panel, 188 original BeSS spectra), Hβ (middle panel, 110 original BeSS spectra), and He I (right panel, 57 original BeSS spectra) profiles of 59 Cyg folded with the orbital period of 28.192 d. The Hα profiles are sampled in bins 0.02 wide in phase. Phase 0 corresponds to the RV minimum as in Maintz et al. (2005). In addition to orbital phase, the scale of the ordinate also indicates the flux in units of the ambient continuum level. For the Ha (Hβ) profiles it was reduced by a factor of 7 (2), and the helium lines were not rescaled. These observations are from 2003 August through 2021 October. |
| In the text | |
|
Fig. 4 RV curves of pairs of emission peaks from different ions in γ Cas as labeled. Initially, the peaks were widely separated. Later, they approached each other until they became unresolved in the single-line stage, after which they split again. If the curves crossed during the single-line stage, the peaks retained their relative strengths (which during that time were very different) but the signs of the RVs were swapped, which means that matter initially moving toward the observer moved away from them after the crossing (and vice versa). If the curves merely temporarily touched one another, the relative strengths were swapped whereas the signs of the RVs remained the same (figure reproduced from Heard 1938). |
| In the text | |
Current usage metrics show cumulative count of Article Views (full-text article views including HTML views, PDF and ePub downloads, according to the available data) and Abstracts Views on Vision4Press platform.
Data correspond to usage on the plateform after 2015. The current usage metrics is available 48-96 hours after online publication and is updated daily on week days.
Initial download of the metrics may take a while.