Fig. 5
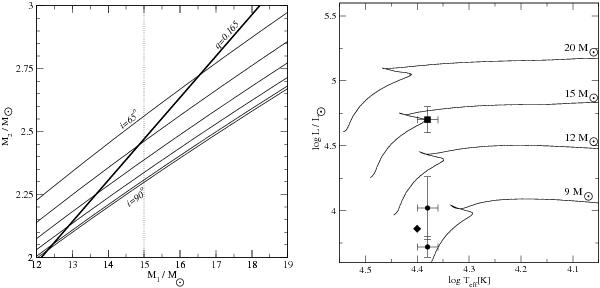
Left panel: M2 vs.
M1 relationships for different inclination
i of the system orbital plane obtained from the mass function
 . The inclination
range is of 65°−90° with a step of 5° from top to
bottom. The solid-line corresponds to a companions mass ratio of
q = 0.165. Main-sequence stars with
Teff = 24 000 K are located to the left from the
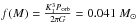
dotted-line. Right panel: a Hertzsprung-Russell diagram with recent
determinations of fundamental parameters of π Aqr. Solid lines show
evolutionary tracks of stars with rotation from Ekström
et al. (2012). Initial masses are indicated by numbers at the corresponding
track. Filled circles show the positions based on the luminosity calculated using the
two Hipparcos distances (see text), the diamond shows data from Hohle et al. (2010), and the filled square shows
parameters adopted here.
. The inclination
range is of 65°−90° with a step of 5° from top to
bottom. The solid-line corresponds to a companions mass ratio of
q = 0.165. Main-sequence stars with
Teff = 24 000 K are located to the left from the
dotted-line. Right panel: a Hertzsprung-Russell diagram with recent
determinations of fundamental parameters of π Aqr. Solid lines show
evolutionary tracks of stars with rotation from Ekström
et al. (2012). Initial masses are indicated by numbers at the corresponding
track. Filled circles show the positions based on the luminosity calculated using the
two Hipparcos distances (see text), the diamond shows data from Hohle et al. (2010), and the filled square shows
parameters adopted here.
Current usage metrics show cumulative count of Article Views (full-text article views including HTML views, PDF and ePub downloads, according to the available data) and Abstracts Views on Vision4Press platform.
Data correspond to usage on the plateform after 2015. The current usage metrics is available 48-96 hours after online publication and is updated daily on week days.
Initial download of the metrics may take a while.