| Issue |
A&A
Volume 558, October 2013
|
|
|---|---|---|
| Article Number | A50 | |
| Number of page(s) | 5 | |
| Section | Stellar structure and evolution | |
| DOI | https://doi.org/10.1051/0004-6361/201322231 | |
| Published online | 03 October 2013 | |
Research Note
Stellar core collapse with hadron-quark phase transition
1
Department of PhysicsFaculty of Science & Technology, Tokyo
University of Science,
2641 Yamazaki, Noda, 278-8510
Chiba,
Japan
e-mail: This email address is being protected from spambots. You need JavaScript enabled to view it.
2
Numazu College of Technology, Ooka 3600, Numazu, 410-8501
Shizuoka,
Japan
3
Department of Physics, Faculty of Science & Engineering,
Waseda University, 3-4-1 Okubo,
Shinjuku, 169-8555
Tokyo,
Japan
4
Advanced Research Institute for Science & Engineering,
Waseda University, 3-4-1 Okubo,
Shinjuku, 169-8555
Tokyo,
Japan
Received: 9 July 2013
Accepted: 7 September 2013
Abstract
Context. Hadronic matter undergoes a deconfinement transition to quark matter at high temperature and/or high density. It would be realized in collapsing cores of massive stars.
Aims. In the framework of the MIT bag model, the ambiguities of the interaction are encapsulated in the bag constant. Some progenitor stars that invoke the core collapses explode as supernovae, and other ones become black holes. The fates of core collapses are investigated for various cases.
Methods. Equations of state including the hadron-quark phase transition are constructed for the cases of the bag constant B = 90, 150, and 250 MeV fm-3. To describe the mixed phase, the Gibbs condition is used. Adopting the equations of state with different bag constants, the core collapse simulations are performed for the progenitor models with 15 and 40 M⊙.
Results. If the bag constant is small, for example B = 90 MeV fm-3, the interval between the bounce and black hole formation is shortened drastically for the model with 40 M⊙, and the second bounce revives the shock wave leading to explosion for the model with 15 M⊙.
Key words: black hole physics / dense matter / equation of state / hydrodynamics / methods: numerical / supernovae: general
© ESO, 2013
1. Introduction
Massive stars with main-sequence mass M ≳ 10 M⊙ are known to cause core collapse at the end of their lives, leading to supernova explosions or black hole formations (e.g., Nomoto et al. 2006). During the collapse, some sort of phase transition such as a quark deconfinement, hyperon appearance, or meson condensation may occur and affect the dynamics (e.g., Takahara & Sato 1985). In this paper, we investigate the hadron-quark phase transition. Recently, Sagert et al. (2009) and Fischer et al. (2011) found that, if the critical density for the transition is low enough, the proto-neutron star collapses to a more compact quark star in hundreds of milliseconds after the first bounce. The second collapse and the following bounce leads to the formation of a shock wave and a successful supernova explosion. In contrast, according to our previous studies (Nakazato et al. 2008, 2010), the second collapse of very massive stars to black holes is triggered by the transition even if the critical density is not low. In this study, we extend these works to other cases.
2. Equation of state and numerical setups
The hadron-quark phase transition affects the dynamics of core collapses through the equation of state (EOS). To construct the EOS, we follow the methods in Nakazato et al. (2008). First, we prepare two types of EOSs, hadronic EOS and quark EOS. In this study, we utilize a table constructed by Shen et al. (1998a,b) based on relativistic mean field theory for the hadronic EOS. The MIT bag model of the deconfined three-flavor strange quark matter is used for the quark EOS (Chodos et al. 1974). We note that both EOSs include the effects of finite temperature, which is important for dealing with the stellar core collapse. As a next step, we describe the phase transition and EOS for the mixed phase assuming the Gibbs conditions between the hadronic and quark EOSs (Glendenning 1992).
In the MIT bag model, free quarks are confined in the bag with a positive potential energy per unit volume, B. This parameter is called the bag constant and characterizes the EOS. For instance, the models with larger value of B have higher transition density and temperature. It is known that, in the high temperature regime, the transition line has an end point called the critical point. Although Nakazato et al. (2008) have shown that the EOS with B = 250 MeV fm-3 (in another unit B1/4 = 209 MeV) can reproduce the temperature of critical point (Tc ~ 170 MeV), the bag constant may not be a constant. Namely, the bag constant for such a high temperature regime may effectively differ from that for the temperatures of our interest (tens of MeV). Therefore, we examine the cases with B = 90 MeV fm-3, 150 MeV fm-3, and 250 MeV fm-3 (B1/4 = 162 MeV, 184 MeV, and 209 MeV, respectively) for a systematic study. In particular, the value of B1/4 = 162 MeV is adopted in Sagert et al. (2009) and Fischer et al. (2011).
We show the mass-radius relation of compact stars for our EOSs in Fig. 1. The maximum masses for the cases with B = 90, 150, and 250 MeV fm-3 are 1.54, 1.36, and 1.80 M⊙, respectively, while that for the case without quarks (pure hadronic EOS, Shen et al. 1998a,b) is 2.17 M⊙. The trajectories of B = 150 and 250 MeV fm-3 align with that of pure hadronic EOS for low-mass stars. In these cases, even for the maximum-mass stars, quark matter at the central region is surrounded by hadronic matter inside the core. Stars with a structure of this kind are called hybrid stars. On the other hand, the trajectory of B = 90 MeV fm-3 is quite different from others. Stars in this sequence are almost pure quark stars while the thin hadronic crust is accompanied. Because of the transition from the hybrid stars to the quark stars, the maximum mass is not monotonic with respect to B. We note that the mass of the binary millisecond pulsar J1614-2230 was recently evaluated as 1.97 ± 0.04 M⊙ from a strong Shapiro delay signature (Demorest et al. 2010), and that our quark models cannot account for it. To support its large mass, a much larger bag constant is needed in our framework, for example B ≳ 400 MeV fm-3 (Nakazato et al. 2008). According to Sagert et al. (2012), the inclusion of the strong coupling constant with large value (αs = 0.7) can increase the maximum mass of EOS with B ~ 50 MeV fm-3 up to ≥2 M⊙. Alternatively, since the bag model dealt with here is a basic model for the quark-gluon-plasma, we may need to consider other phases for zero-temperature such as a color-flavor locking or color superconductors (e.g., Fukushima & Hatsuda 2011).
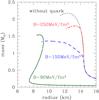 |
Fig. 1 Mass-radius relations of the compact stars for the cases with B = 90 MeV fm-3 (solid), 150 MeV fm-3 (dashed), and 250 MeV fm-3 (dot-dashed), and for the case without quark transition (dotted). |
Using the EOSs described above, we perform the core-collapse simulation as in Nakazato et al. (2010). We adopt the general relativistic implicit Lagrangian hydrodynamics code, which simultaneously solves the neutrino Boltzmann equations under spherical symmetry (Yamada 1997; Yamada et al. 1999; Sumiyoshi et al. 2005). For the hadronic phase, we follow the neutrino distribution functions from the reactions and transports, while, for the mixed phase and quark phase, we set them to be Fermi-Dirac functions because our EOS is constructed assuming that neutrinos are fully trapped and in equilibrium with other particles. As for the cases of black hole formation, we judge it by the appearance of the apparent horizon (Nakazato et al. 2006), which is a sufficient condition for the existence of the event horizon. Results of evolutionary calculations for progenitor stars with M = 15 M⊙ and 40 M⊙ by Woosley & Weaver (1995) are chosen as the initial models of our simulations.
3. Collapse of a 40 M⊙ star
It was confirmed in a previous study (Sumiyoshi et al. 2007) that the collapse of the 40 M⊙ star adopted in this paper results in the formation of a black hole for the spherical case without the hadron-quark phase transition. While this conclusion holds for models with quarks, the dynamics is affected. We show the time profiles of the central baryon mass density in Fig. 2. The bounce due to the nuclear force corresponds to the spikes at t = 0, which is defined as the time of the bounce. The density at the bounce of the model of B = 90 MeV fm-3 is 6.9 × 10¹⁴ g cm-3 while those of other models are 3.2 × 10¹⁴ g cm-3. In Fig. 3, we show the profiles of the particle fractions and the baryon mass density of the models of B = 90 and 250 MeV fm-3. As seen in this figure, deconfined quarks appear even at the bounce for the model of B = 90 MeV fm-3. Thus, the EOS gets softer and the bounce density becomes higher. On the other hand, the phase transition does not occur for the models of B = 150 and 250 MeV fm-3 and their bounce densities do not differ from that of the model without quarks.
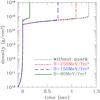 |
Fig. 2 Time evolutions of the central baryon mass density for the collapse of 40 M⊙ star. The line notation is the same as in Fig. 1. |
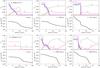 |
Fig. 3 Profiles of the particle fractions Yi ≡ ni/nB (upper plots) and baryon mass density ρB (lower plots) for the collapse of a 40 M⊙ star, where ni represents the number density of particle i, and nB the baryon mass number density. For the upper plots of all panels, dotted, dot-dashed, long-dashed, short-dashed, and solid lines correspond to neutron, proton, u quark, d quark, and s quark, respectively. The panels in the top row are for the case with B = 90 MeV fm-3, and left, central, and right plots, respectively, show the profiles at 0 ms, 100 ms, and 142.19 ms after the bounce. The panels in the bottom row are for the case with B = 250 MeV fm-3, and left, central, and right plots, respectively, show the profiles at 0 ms, 1085.45 ms, and 1085.52 ms after the bounce. We note that, the upper-right and lower-right panels correspond to the moment of black hole formation for each case, and thin dotted vertical lines show the location of the apparent horizon. |
After the bounce, a shock wave is launched outward and a proto-neutron star is formed at the center. The shock wave stalls on the way and does not go out from the core. The proto-neutron star contracts gradually owing to the accretion of shocked matter and, finally, collapses to a black hole, which corresponds to the blow-ups of the central density in Fig. 2. For the cases with B = 150 and 250 MeV fm-3, quarks do not appear until just before the black hole formation and the transition triggers the second collapse. These features have already been reported in Nakazato et al. (2010). For the case with B = 90 MeV fm-3, we find that quarks exist even at the early stage. The shortening of the interval between the bounce and black hole formation is drastic in this case.
The intervals between the bounce and black hole formation are 142.19 ms, 717.83 ms, and 1085.52 ms for the models with B = 90, 150, and 250 MeV fm-3, respectively, while it is 1345.40 ms for the model without quarks. This order is different from the order for the maximum masses of cold neutron stars. The proto–neutron star is not zero temperature and the maximum mass is increased by the thermal pressure. For the case with B = 90 MeV fm-3, the proto–neutron star is compressed adiabatically and the quark matter region gets larger. If the hadron-quark phase transition occurs adiabatically, the temperature decreases because we assume that the transition is a first-order where the release of latent heat occurs (Nakazato et al. 2010). We note that, in this case, the low-density (hadron) phase has the lower entropy, which is opposite to an ordinary liquid-vapor transition (e.g., water vapor has lower density and higher entropy than liquid water in the liquid-vapor transition of H2O). As a result, the thermal pressure is insufficient owing to the temperature decrease and the proto-neutron star collapses quickly for the case with B = 90 MeV fm-3. On the other hand, for the cases with B = 150 and 250 MeV fm-3, quarks do not appear until just before the black hole formation and the maximum mass is sufficiently increased by the thermal pressure.
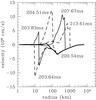 |
Fig. 4 Snapshots of velocity profiles of the model with 15 M⊙ for the case with B = 90 MeV fm-3. The thick solid line corresponds to the onset of the second collapse (200.54 ms after the first bounce); the second bounce occurs at 203.64 ms after the first bounce. |
According to Nakazato et al. (2010), the hadron-quark phase transition only affects the duration of neutrino emission and does not change the neutrino luminosity and spectrum before the black hole formation for the case with B = 250 MeV fm-3. This is true even for the case with B = 90 MeV fm-3. While the phase transition occurs inside the core, neutrinos are emitted from outer region. Therefore, the phase transition is not reflected in the neutrino signal very much within the timescale of the black hole formation for this model.
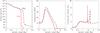 |
Fig. 5 Profiles of density (left), temperature (center), and entropy per baryon (right) for the case with B = 90 MeV fm-3. Solid lines are for the model with 15 M⊙ at 200.54 ms after the first bounce and dashed lines are for the model with 40 M⊙ at 139.23 ms after the first bounce. Both of them correspond to the onset of the second collapse. |
4. Collapse of a 15 M⊙ star
It was shown in a previous study (Sumiyoshi et al. 2005) that the 15 M⊙ star adopted in this paper fails to explode for the spherical case without the hadron-quark phase transition, as is the case for most of the other spherical simulations. This result would hold for the cases with B = 150 and 250 MeV fm-3 because the density and temperature are not high enough for the phase transition to occur at least up to 1000 ms after the bounce (Sumiyoshi et al. 2005). For the case with B = 90 MeV fm-3, Sagert et al. (2009) and Fischer et al. (2011) found that the phase transition causes the second collapse and bounce leading to the successful supernova explosion with different progenitor models. Here, we verify this scenario for the model with 15 M⊙ by Woosley & Weaver (1995) for the first time.
We find that the second collapse starts at 200.54 ms after the first bounce and the second bounce occurs at 203.64 ms after the first bounce. The shock wave formed by the second bounce reaches a radius of 1000 km within 10 ms, and the explosion is successful. In Fig. 4 the snapshots of velocity profile for this stage are shown. We estimate the baryonic mass of the remnant neutron star Mb,NS and supernova explosion energy Eexp with the data at 213.61 ms after the first bounce. First of all, we calculate the sum of kinetic energy and gravitational potential, ek + g, for each mass element in the shocked region. We assume that the elements with ek + g < 0 fall back to the central neutron star. Then we get Mb,NS = 1.42 M⊙. As a next step, we integrate ek + g and the internal energy over the region with ek + g > 0 and a positive radial velocity. Adding the gravitational potential of the outer pre-shocked region, we estimate as Eexp = 1.54 × 1051 erg. This is the same order of magnitude as the canonical value. We note that a part of the internal energy would be carried by the neutrino radiation. If we integrate only ek + g, we get Eexp = 1.7 × 1050 erg. The real value of the explosion energy should reside between two estimations and this result is consistent with Fischer et al. (2011).
In Fig. 5, the profiles of a 15 M⊙ star and a 40 M⊙ star at the onset of the second collapse are compared. We can recognize that their profiles are similar for the innermost 0.5 M⊙ where the phase transition to quark matter occurs. For the outer hadronic region, the 40 M⊙ star has higher temperature and entropy than the 15 M⊙ star. Therefore, the core of the 40 M⊙ star (1.68 M⊙ in baryonic mass) is larger than that of the 15 M⊙ star (1.44 M⊙ in baryonic mass). After the second collapse, all of the core converts to quark matter. While the thermal pressure is inefficient in the mixed phase, it is restored in the pure quark phase again. In particular, the collapse of 15 M⊙ star, whose core is less massive than the maximum masses for B = 90 fm-3, bounces. On the other hand, a black hole is formed by the second collapse of 40 M⊙ star. We note that the masses shown in Fig. 1 are gravitational masses, which are different from baryonic masses in general. In fact, the maximum-mass star for B = 90 fm-3 is 1.54 M⊙ in gravitational mass and 1.81 M⊙ in baryonic mass. Thus, we cannot predict the fate of the second collapse from a simple comparison of masses. Nevertheless, it is clear that whether the second core bounce occurs or not depends on the core mass.
Sagert et al. (2009) and Fischer et al. (2011) reported that the burst emission of electron type anti-neutrino accompanies the second bounce. Because of the stalled first shock, the shocked matter is deleptonized and becomes neutron-rich. When the second shock passes through the deleptonized region, the creation of electron-positron pairs occurs. Since this region is neutron-rich, positrons are well captured and copious electron type anti-neutrinos are produced. However, the electron capture is inadequate. The created electron-positron pairs also interact via the pair annihilation contributing to all neutrino species. Therefore, the amount of emitted neutrinos has a hierarchy  , where
  . In this paper, the light curve of neutrino signals is not shown because we do not follow the long term evolution after the second bounce. However, in our computations, we confirm this hierarchy for the neutrinos produced by the second shock. These neutrinos would propagate outward and we would observe the burst emission of electron-type anti-neutrinos on Earth.
5. Summary
We have performed a series of core-collapse simulations taking into account the hadron-quark phase transition within the framework proposed by Nakazato et al. (2008). For the quark phase, we have used the MIT bag model and examined three cases for the bag constant, B = 90, 150, and 250 MeV fm-3. First, we have found that the collapse of a 40 M⊙ star results in black hole formation for the all cases investigated and the phase transition accelerates the formation. In particular, for the case with B = 90 MeV fm-3, the shortening of the interval between the first bounce and black hole formation is drastic because quarks exist even at the early stage. Second, we have confirmed that the second collapse of a 15 M⊙ star bounces back and leads to explosion for the case with B = 90 MeV fm-3. While this scenario had already been suggested by Sagert et al. (2009), we have shown it independently in this study for the different stellar models.
Acknowledgments
In this work, numerical computations were partially performed on the supercomputers at Research Center for Nuclear Physics (RCNP) in Osaka University, Center for Computational Astrophysics (CfCA) in the National Astronomical Observatory of Japan (NAOJ), Yukawa Institute for Theoretical Physics (YITP) in Kyoto University, Japan Atomic Energy Agency (JAEA), High Energy Accelerator Research Organization (KEK), and The University of Tokyo. This work was partially supported by Grants-in-Aid for Scientific Research (Nos. 22540296, 23840038, 24244036) and Scientific Research on Innovative Areas (Nos. 20105004, 24105008) from the Ministry of Education, Culture, Sports, Science and Technology (MEXT) in Japan.
References
- Chodos, A., Jaffe, R. L., Johnson, K., Thorn, C. B., & Weisskopf, V. F. 1974, Phys. Rev. D, 9, 3471 [NASA ADS] [CrossRef] [EDP Sciences] [MathSciNet] [Google Scholar]
- Demorest, P. B., Pennucci, T., Ransom, S. M., Roberts, M. S. E., & Hesseles, J. W. T. 2010, Nature, 467, 1081 [NASA ADS] [CrossRef] [PubMed] [Google Scholar]
- Fischer, T., Sagert, I., Pagliara, G., et al. 2011, ApJS, 194, 39 [Google Scholar]
- Fukushima, K., & Hatsuda, T. 2011, Rept. Prog. Phys., 74, 014001 [NASA ADS] [CrossRef] [Google Scholar]
- Glendenning, N. K. 1992, Phys. Rev. D, 46, 1274 [NASA ADS] [CrossRef] [Google Scholar]
- Nakazato, K., Sumiyoshi, K., & Yamada, S. 2006, ApJ, 645, 519 [NASA ADS] [CrossRef] [Google Scholar]
- Nakazato, K., Sumiyoshi, K., & Yamada, S. 2008, Phys. Rev. D, 77, 103006 [NASA ADS] [CrossRef] [Google Scholar]
- Nakazato, K., Sumiyoshi, K., & Yamada, S. 2010, ApJ, 721, 1284 [Google Scholar]
- Nomoto, K., Tominaga, N., Umeda, H., Kobayashi, C., & Maeda, K. 2006, Nucl. Phys. A, 777, 424 [NASA ADS] [CrossRef] [Google Scholar]
- Sagert, I., Fischer, T., Hempel, M., et al. 2009, Phys. Rev. Lett., 102, 081101 [NASA ADS] [CrossRef] [PubMed] [Google Scholar]
- Sagert, I., Fischer, T., Hempel, M., et al. 2012, Acta Physica Polonica B, 43, 741 [Google Scholar]
- Shen, H., Toki, H., Oyamatsu, K., & Sumiyoshi, K. 1998a, Nucl. Phys. A, 637, 435 [NASA ADS] [CrossRef] [Google Scholar]
- Shen, H., Toki, H., Oyamatsu, K., & Sumiyoshi, K. 1998b, Prog. Theor. Phys., 100, 1013 [Google Scholar]
- Sumiyoshi, K., Yamada, S., Suzuki, H., Shen, H., & Chiba, S. 2005, ApJ, 629, 922 [NASA ADS] [CrossRef] [Google Scholar]
- Sumiyoshi, K., Yamada, S., & Suzuki, H. 2007, ApJ, 667, 382 [NASA ADS] [CrossRef] [Google Scholar]
- Takahara, M., & Sato, K. 1985, Phys. Lett. B, 156, 17 [NASA ADS] [CrossRef] [Google Scholar]
- Woosley, S. E., & Weaver, T. A. 1995, ApJS, 101, 181 [NASA ADS] [CrossRef] [Google Scholar]
- Yamada, S. 1997, ApJ, 475, 720 [NASA ADS] [CrossRef] [Google Scholar]
- Yamada, S., Janka, H.-Th., & Suzuki, H. 1999, A&A, 344, 533 [NASA ADS] [Google Scholar]
All Figures
|
Fig. 1 Mass-radius relations of the compact stars for the cases with B = 90 MeV fm-3 (solid), 150 MeV fm-3 (dashed), and 250 MeV fm-3 (dot-dashed), and for the case without quark transition (dotted). |
| In the text | |
|
Fig. 2 Time evolutions of the central baryon mass density for the collapse of 40 M⊙ star. The line notation is the same as in Fig. 1. |
| In the text | |
|
Fig. 3 Profiles of the particle fractions Yi ≡ ni/nB (upper plots) and baryon mass density ρB (lower plots) for the collapse of a 40 M⊙ star, where ni represents the number density of particle i, and nB the baryon mass number density. For the upper plots of all panels, dotted, dot-dashed, long-dashed, short-dashed, and solid lines correspond to neutron, proton, u quark, d quark, and s quark, respectively. The panels in the top row are for the case with B = 90 MeV fm-3, and left, central, and right plots, respectively, show the profiles at 0 ms, 100 ms, and 142.19 ms after the bounce. The panels in the bottom row are for the case with B = 250 MeV fm-3, and left, central, and right plots, respectively, show the profiles at 0 ms, 1085.45 ms, and 1085.52 ms after the bounce. We note that, the upper-right and lower-right panels correspond to the moment of black hole formation for each case, and thin dotted vertical lines show the location of the apparent horizon. |
| In the text | |
|
Fig. 4 Snapshots of velocity profiles of the model with 15 M⊙ for the case with B = 90 MeV fm-3. The thick solid line corresponds to the onset of the second collapse (200.54 ms after the first bounce); the second bounce occurs at 203.64 ms after the first bounce. |
| In the text | |
|
Fig. 5 Profiles of density (left), temperature (center), and entropy per baryon (right) for the case with B = 90 MeV fm-3. Solid lines are for the model with 15 M⊙ at 200.54 ms after the first bounce and dashed lines are for the model with 40 M⊙ at 139.23 ms after the first bounce. Both of them correspond to the onset of the second collapse. |
| In the text | |
Current usage metrics show cumulative count of Article Views (full-text article views including HTML views, PDF and ePub downloads, according to the available data) and Abstracts Views on Vision4Press platform.
Data correspond to usage on the plateform after 2015. The current usage metrics is available 48-96 hours after online publication and is updated daily on week days.
Initial download of the metrics may take a while.