Fig. 3
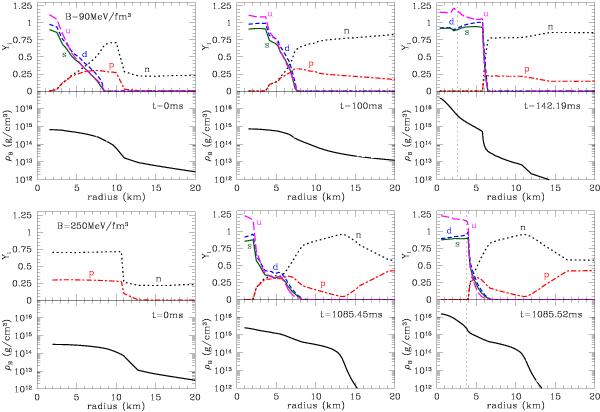
Profiles of the particle fractions Yi ≡ ni/nB (upper plots) and baryon mass density ρB (lower plots) for the collapse of a 40 M⊙ star, where ni represents the number density of particle i, and nB the baryon mass number density. For the upper plots of all panels, dotted, dot-dashed, long-dashed, short-dashed, and solid lines correspond to neutron, proton, u quark, d quark, and s quark, respectively. The panels in the top row are for the case with B = 90 MeV fm-3, and left, central, and right plots, respectively, show the profiles at 0 ms, 100 ms, and 142.19 ms after the bounce. The panels in the bottom row are for the case with B = 250 MeV fm-3, and left, central, and right plots, respectively, show the profiles at 0 ms, 1085.45 ms, and 1085.52 ms after the bounce. We note that, the upper-right and lower-right panels correspond to the moment of black hole formation for each case, and thin dotted vertical lines show the location of the apparent horizon.
Current usage metrics show cumulative count of Article Views (full-text article views including HTML views, PDF and ePub downloads, according to the available data) and Abstracts Views on Vision4Press platform.
Data correspond to usage on the plateform after 2015. The current usage metrics is available 48-96 hours after online publication and is updated daily on week days.
Initial download of the metrics may take a while.