Fig. 5
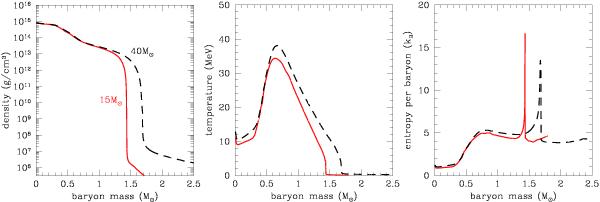
Profiles of density (left), temperature (center), and entropy per baryon (right) for the case with B = 90 MeV fm-3. Solid lines are for the model with 15 M⊙ at 200.54 ms after the first bounce and dashed lines are for the model with 40 M⊙ at 139.23 ms after the first bounce. Both of them correspond to the onset of the second collapse.
Current usage metrics show cumulative count of Article Views (full-text article views including HTML views, PDF and ePub downloads, according to the available data) and Abstracts Views on Vision4Press platform.
Data correspond to usage on the plateform after 2015. The current usage metrics is available 48-96 hours after online publication and is updated daily on week days.
Initial download of the metrics may take a while.