| Issue |
A&A
Volume 558, October 2013
|
|
|---|---|---|
| Article Number | A99 | |
| Number of page(s) | 5 | |
| Section | Stellar structure and evolution | |
| DOI | https://doi.org/10.1051/0004-6361/201321892 | |
| Published online | 10 October 2013 | |
The 54-day orbital period of AX J1820.5–1434 unveiled by Swift
1
INAF - Istituto di Astrofisica Spaziale e Fisica Cosmica di Palermo, via U.
La Malfa 153,
90146
Palermo,
Italy
e-mail:
This email address is being protected from spambots. You need JavaScript enabled to view it.
2
Dipartimento di Fisica e Chimica, Università di
Palermo, via Archirafi
36, 90123
Palermo,
Italy
3
INAF – Istituto di Astrofisica Spaziale e Fisica Cosmica di
Bologna, via Gobetti 101, 40129
Bologna,
Italy
4
INAF – Brera Astronomical Observatory,
via Bianchi 46, 23807 Merate
( LC), Italy
Received:
14
May
2013
Accepted:
11
August
2013
Abstract
Context. The hard X-ray survey that Swift Burst Alert Telescope (BAT) has been performing since late 2004 provides a considerable database for a large number of sources, whose hard X-ray emission are poorly known.
Aims. We exploit the BAT survey archive to improve the temporal and spectral characterization of the Galactic hard-X-ray sources. We focus here on the study of the high mass X-ray binary AX J1820.5–1434.
Methods. All the data relevant to AX J1820.5–1434 were extracted from the BAT survey archive and analyzed using a folding technique to search for periodical modulations. A broad-band spectral analysis was also performed, complementing the BAT spectrum with the available Swift X-Ray Telescope (XRT) and XMM-Newton pointed observations.
Results. A timing analysis revealed the detection of a coherent signal at P0 = 54.0 ± 0.4 d, which we interpret as the orbital period of the binary system. When folded with a period of P0, the light curve shows an asymmetric profile with a minimum roughly consistent with zero intensity. The broadband spectral analysis coupling Swift-XRT, XMM-Newton, and Swift-BAT spectra confirms that the source emission is well modeled with a strongly absorbed power law with no evidence of a high energy exponential cutoff.
Key words: X-rays: binaries / X-rays: individuals: AX J1820.5-1434 / stars: neutron
© ESO, 2013
1. Introduction
Since November 2004, the Burst Alert Telescope (BAT, Barthelmy et al. 2005) on board Swift (Gehrels et al. 2004) has been performing a continuous monitoring of the sky in the hard X-ray domain (15–150 keV). Thanks to its large field of view (1.4 steradian half-coded) and to its pointing strategy, BAT covers a fraction of the sky of 50% to 80% every day. This monitoring has been very successful in unveiling the binary nature of many Galactic sources (e.g., Corbet & Krimm 2009; Corbet et al. 2010a; Cusumano et al. 2010; La Parola et al. 2010; D’Aì et al. 2011).
In this paper, we present a temporal and spectral analysis of the Swift data collected on the AX J1820.5–1434, a high mass X-ray binary (HMXB) discovered during the ASCA Galactic plane survey at RAJ2000 = 18h20m29.5s, DecJ2000 = − 14°34′24′′ with an error radius of 0.5′ (Kinugasa et al. 1998). The timing analysis of the ASCA data allowed the detection of a coherent pulsation with a period of 152.26 ± 0.04 s. The spectrum was modeled with a strongly absorbed (NH = 9.8 ± 1.7 × 1022 cm-2) power-law with a photon index of Γ = 0.9 ± 0.2 and a 6.4 keV iron line with an equivalent width of ~100 eV. The average absorbed flux was 2.3 × 10⁻¹¹ erg s-1 cm-2 in the 2–10 keV energy band. The source was detected in the hard X-rays with INTEGRAL (Lutovinov et al. 2003) with an average 18–60 keV flux of ~9.3 × 10⁻¹¹ erg s-1 cm-2 between March and April 2003, while the non-detections in later observations indicated its transient nature (Filippova et al. 2005). An optical counterpart, the mid- or early B-type star USNO-B1.0 0754-0489829, was proposed by Negueruela & Schurch (2007). Thanks to a refinement of the X-ray position achieved through two later XMM-Newton and Chandra observations (RAJ2000 = 18h20m30.09s, DecJ2000 = −14°34′23.52′′ derived with Chandra with an error circle of 0.64′′, Kaur et al. 2010), this counterpart candidate was rejected because it is inconsistent with the new position. No optical counterpart is visible in the Digitized Sky Survey, while a bright near-infrared (NIR) counterpart was found in the Two Micron All Sky Survey (2MASS) at RAJ2000 = 18h20m30.10s, DecJ2000 = −14°34′22.9′′ (error radius 0.1′′). The J, H, and Ks magnitudes of the NIR source are 15.41, 13.25, and 11.75, respectively. The bright NIR counterpart could be either an early-type single star or a blend of a few nearby stars that are not resolved due to poor resolution of the 2MASS observations. As a consequence, the actual counterpart of AX J1820.5–1434 still remains uncertain (Kaur et al. 2010). The spectral parameters derived from the XMM-Newton observation are consistent with those reported by Kinugasa et al. (1998) with an absorbed flux lower than a factor of ~15. The timing analysis confirmed the pulse period reported by Kinugasa et al. (1998). An average spin-period derivative of (3.00 ± 0.14) × 10-9 s s-1 was determined using the previous spin-period measurement.
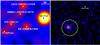 |
Fig. 1 Left panel: 15–60 keV BAT significance map of the sky region around AX J1820.5–1434. Right panel: 0.2–10 keV XRT image with superimposed BAT error box (1.08 arcmin, yellow circle) and the position of the NIR counterpart (black cross) as suggested by Kaur et al. (2010). |
2. Observations and data reduction
The Swift-BAT survey data (2004/11–2012/03) retrieved from the HEASARC public archive1 were processed using the BATIMAGER code (Segreto et al. 2010), which is dedicated to the processing of coded mask instrument data. The source AX J1820.5–1434 is detected with a statistical significance of 23.6 standard deviations in the 15–150 keV all-sky map and 24.9 standard deviations in the 15–60 keV all-sky map, where its signal-to-noise is maximized (Fig. 1, left panel). The latter energy band was used to extract the light curve with the maximum resolution allowed by the Swift-BAT survey data. The background subtracted spectrum averaged over the entire survey period was extracted in eight energy channels and analyzed using the BAT redistribution matrix available in the Swift calibration database2.
Two Swift X-ray Telescope (XRT) observations were used in this work to perform broadband spectroscopy: ObsID 00036168001, performed on 2007 February 24, with a CCD substrate voltage set at 0V and a net exposure of 6 ks, and ObsID 00044152001, performed on 2012 October 16, for ~500 s of exposure time (CCD substrate voltage set at 6V). Both pointings were in photon counting observing mode (Hill et al. 2004). A third observation (ObsID 00037882001, 2009 July 19) had an exposure time of only 170 s, and the source was not detected. The data were processed with standard procedures (XRTPIPELINE v.0.12.4) and filtering and screening criteria, which adopted a 0–12 grade selection. The source events were extracted from a circular region (20 pixel radius with 1 pixel = 2.36 arcsec) centered on the source centroid. This was determined using the task XRTCENTROID (RAJ2000 = 18h20m30.1s, DecJ2000 = −14°34′23.8′′, with 90% confidence region of 3.98′′ radius). Figure 1 (right panel) shows the XRT image with the position of the NIR counterpart, which is offset with respect to the XRT source of 0.9′′. The background for the spectral analysis was extracted from an annular region with inner and outer radii of 30 and 70 pixels, respectively. The XRT ancillary response files were generated with XRTMKARF3; we used the spectral redistribution matrix v011 for ObsID 00036168001 and v013 for ObsID 00044152001. The spectral analysis was performed using Xspec v.12.5. The event arrival times were corrected to the SSB using the task BARYCORR4.
We also extracted the XMM-Newton spectrum of the source from the same pointings whose analysis was performed in Kaur et al. (2010). We extracted both Epic-PN and MOS spectra, using standard pipelines of SAS tools. We selected a circular region with a 10 arcsec radius centered on the source position for source spectra and a similar region from a nearby source-free area for the background spectra. We checked the consistency of our analysis by successfully reproducing the best-fit model of Kaur et al. (2010).
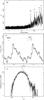 |
Fig. 2 a) Periodogram of Swift-BAT (15–60 keV) data for AX
J1820.5–1434. b) Light curve folded at a period
P0 = 54.0 d with 16 phase bins. The arrows mark the
orbital phase of the Swift-XRT and XMM-Newton
observations. c) Histogram distribution of the
|
3. Timing analysis
A folding timing analysis (Leahy et al. 1983) was
applied to the 15–60 keV Swift-BAT light curve searching for the presence
of modulations with periods between 0.5 and 500 d. The method consists of building a light
curve profile at different trial periods by folding the photon arrival times in
N phase bins. For each resulting light curve, the
χ2 with respect to the average count rate is evaluated: a
periodic pulsation corresponds to a large value of χ2. The
resolution of the period search is
ΔP = P2/(N ΔT),
where P is the trial period, N = 16 is the number of phase bins used to
build the trial profile, and ΔT = 228 Ms is the data time span. The profile
for each trial period was built by weighing the rates using the inverse square of the
corresponding statistical error (see Cusumano et al.
2010). This allows us to cope with the large spread of statistical errors that
characterizes the Swift-BAT survey data, which is mainly due to the wide
range of off-axis directions in which the source is observed. The resulting periodogram
(Fig. 2a) shows several features emerging over the
noise: the one with the shortest period is at P0 = 54.0 ± 0.4 d
(χ2 ~ 254), where P0 and its error
are the centroid and the standard deviation obtained by modeling this feature with a
Gaussian function, while the other features result from multiples of
P0. The intensity profile (Fig. 2b) obtained by folding the data at P0 with
Tepoch = 54 684.809 MJD shows a large asymmetric single peak
profile with a minimum that is marginally consistent with zero emission. For larger values
of the trial period, the periodogram shows the typical average
χ2 increase, which is expected when the source emission is
characterized by long term time variability (red noise). In presence of red noise, the
χ2 statistics cannot be applied and the significance of the
feature is to be evaluated with respect to the local noise fluctuation of the periodogram.
Thus, we fit the periodogram with a second order polynomial and subtract the best fit trend
from the χ2 values, obtaining a corrected periodogram
 . The value of
at
P0 is ~194. In Fig. 2c,
we show the histogram built from the corrected periodogram by selecting the values in the
period interval between 24 and 104 d (as this interval is characterized by a noise level
consistent with the noise level at P0) and by excluding those
falling in an interval of ± ΔP0 around
P0. We then use an exponential function to extrapolate the
right tail of the histogram and compute its area for
. The value of
at
P0 is ~194. In Fig. 2c,
we show the histogram built from the corrected periodogram by selecting the values in the
period interval between 24 and 104 d (as this interval is characterized by a noise level
consistent with the noise level at P0) and by excluding those
falling in an interval of ± ΔP0 around
P0. We then use an exponential function to extrapolate the
right tail of the histogram and compute its area for 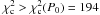 . Normalizing this value to the
total area of the histogram, we obtain 1.0 × 10⁻⁷, which represents the
probability of random occurrence for
. Normalizing this value to the
total area of the histogram, we obtain 1.0 × 10⁻⁷, which represents the
probability of random occurrence for  . This
corresponds to a statistical significance of 5.4 standard deviations in Gaussian statistics.
. This
corresponds to a statistical significance of 5.4 standard deviations in Gaussian statistics.
XRT and XMM-Newton observation log.
 |
Fig. 3 15–60 keV Swift-BAT light curve. Each point represents a time interval of P0/6 = 9.0 d. The vertical shaded bars mark the phase interval of 0.44–0.62 of the folded profile in Fig. 2b. The arrows mark the epoch of the Swift-XRT and XMM-Newton observations. The third Swift-XRT observation is later than the 88-month BAT survey data analysed in this paper. |
Figure 3 shows the 15–60 keV light curve of AX J1820.5–1434 with a bin time of P0/6 = 9.0 d. The vertical shaded bars mark the phase interval of 0.44–0.62 of Fig. 2b. In ~50% of the cycles, we observe a significant intensity enhancement in this phase interval. The source shows also a few episodes of significant intensity enhancements at different phases. The Swift-XRT observations correspond to a phase interval between 0.2 and 0.4 in Fig. 2b. The variations in the rate observed among the observations (Table 1) are in fair agreement with the shape of the Swift-BAT folded profile with the highest rate observation (ObsID 00044152001) corresponding to the profile peak. The statistical content of the Swift-XRT observations is too low (~70 counts in observations 1 and 3) to see the modulation of ~152 s reported by Kinugasa et al. (1998) and confirmed by Kaur et al. (2010) with the XMM-Newton data.
4. Spectral analysis
Before performing a broadband spectral analysis, we checked the range of spectral
variations observed in the available datasets. The spectra of the two
Swift-XRT pointed observations, where AX J1820.5–1434 is detected (see
Sect. 2), and the spectra of the XMM observation were fitted simultaneously with an absorbed
power law and constrained with an absorption column density and a photon index that are the
same for both datasets. The residuals resulting from the best fit model were consistent with
each other within the errors. The absorption column density was
 ,
while the photon index was
,
while the photon index was  .
The same check was done on the Swift-BAT spectra produced by dividing the
BAT data into four 22-month long time intervals and into three different orbit phase
intervals (0.375–0.4375 and 0.625–0.875; 0.4375–0.625; and 0.875–1.375 see Fig. 2b) that were fitted with a power law. As for the
Swift-XRT spectra, the photon index was the same in the three datasets.
The best fit residuals show the same trend for all the BAT datasets with a best fit photon
index of
.
The same check was done on the Swift-BAT spectra produced by dividing the
BAT data into four 22-month long time intervals and into three different orbit phase
intervals (0.375–0.4375 and 0.625–0.875; 0.4375–0.625; and 0.875–1.375 see Fig. 2b) that were fitted with a power law. As for the
Swift-XRT spectra, the photon index was the same in the three datasets.
The best fit residuals show the same trend for all the BAT datasets with a best fit photon
index of  .
.
The broadband spectral analysis was therefore performed, coupling the 15–150 keV BAT spectrum averaged over 88 months, the two Swift-XRT spectra, and the XMM-Newton spectra. To consider flux variations and intercalibration issues, we included a multiplicative normalization factor, fixed to 1 for the Swift-XRT spectrum of Obs ID 00044151001 and left free for all the other spectra, in the model. A strongly absorbed (NH ~ 1.7 × 1023 cm-2) power law was adequate to describe the data with an acceptable χ2 of 158.4 (182 d.o.f.). Figure 4 shows the data, best fit model, and residuals. Table 2 reports the best fit parameters (quoted errors are given at 90% confidence level for a single parameter.). We also fit a model consisting of an absorbed power-law with a high energy exponential cutoff (phabs*cutoffpl) without any significant fit improvement (χ2 = 145.4 with 181 d.o.f.).
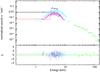 |
Fig. 4 AX J1820.5–1434 broadband (0.2–150 keV ) spectrum. Top panel: XRT (black and red data); EPIC-pn (cyan data); EPIC-MOS1 and EPIC-MOS2 (magenta and blue data); BAT data (green data) and best fit phabs*(powerlaw) model. The Swift data are marked with diamonds. Bottom panel: residuals in unit of standard deviations. |
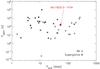 |
Fig. 5 Corbet diagram for HMXBs with known spin and orbital period. Diamond and star points represent the Be and supergiant systems, respectively. The red filled circle marks the position of AX J1820.5–1434. |
Best fit spectral parameters.
5. Conclusions
The entire dataset of Swift and XMM-Newton X-ray data on AX J1820.5–1434 was analyzed to explore the temporal and spectral properties of the source. The timing analysis performed on the 88-month BAT survey data unveiled a periodic intensity modulation at P0 = 54.0 ± 0.4 d with a statistical significance higher than 5.4 standard deviations in Gaussian statistics. Interpreting this long periodicity as the orbital period of the binary system and knowing the spin period (Kinugasa et al. 1998) of the compact star, we have located the source position on the Corbet diagram (Corbet 1986). The source lays in the plot region populated by Be/X-ray binaries (Fig. 5). The BAT light curve with a time bin of P0/6 shows periodic intensity enhancements that are mostly concentrated in a narrow phase interval (≲P/6). However, some have a longer time duration. With a few enhancement episodes that seem to be not related to the same phase interval, this explains the asymmetric triangular peak that spans about 50% of the orbital period in the BAT light curve folded at P0. This suggests that the accretion onto the compact object is not strictly related to the periastron passage, which is typical of highly eccentric Be/X ray binaries. The lack of information on the companion star type prevents us from further investigation on the orbital parameters of the system. If the counterpart of AX J1820.5−1434 proposed by Kaur et al. (2010) is not a blend of objects but rather a single source, we can consider its NIR magnitudes and assume the intrinsic colors typical of late O/early B-type stars (Wegner 1994): we find a color excess of E(J − K) ~ 3.5 mag, which implies a reddening AV ~ 21 mag using the Milky Way extinction law of Cardelli et al. (1989) and assumes the total-to-selective extinction ratio of Rieke & Lebofsky (1985). Although it is known that the NH can vary on short scales throughout the Galactic plane and the value of the gas-to-dust ratio is not universal in the Galaxy, we can nevertheless use this approach to get an (admittedly rough) estimate of the Galactic line-of-sight hydrogen column density toward AX J1820.5−1434. This large extinction naturally explains the lack of detection of an optical counterpart for this source, and as seen from the formula of Predehl & Schmitt (1995), it implies a column density of ~3.8 × 1022 cm-2, which is substantially lower than the value inferred from our X-ray spectral analysis and points to the presence of more absorbing material local to the system. Assuming this amount of reddening along the AX J1820.5−1434 line of sight and a B0 spectral type for the companion star in this system, we can infer its distance depending on the luminosity class of the star. We consider the main sequence and giant cases (luminosity classes V and III, respectively), since the location of the source in the Corbet diagram tends to rule out the presence of an early supergiant in this system. From the tabulated absolute magnitudes for this type of stars (Lang 1992), we find distances of ~3.5 and ~6.0 kpc for the main sequence and the giant companion case, respectively. This range of distance implies a 0.2–10 keV (15–150 keV) luminosity range of 3.2 × 1035−9.5 × 1035 erg s-1 (6.0 × 1034−1.8 × 1035 erg s-1).
The set of XMM-Newton, Swift-XRT, and Swift-BAT data allows for a broadband spectral analysis in the 0.2–150 keV energy band. The data can be described with a strongly absorbed (NH ~ 1.7 × 1023 cm-2) power law with photon index Γ ≃ 2.44. We have modified the power law by a high energy cutoff, but the cutoff energy we obtain is poorly constrained and the statistical improvement is not significant.
Acknowledgments
We thank the referee R. Walter whose comments helped to improve the paper. This work has been supported by ASI grant I/011/07/0.
References
- Barthelmy, S. D., Barbier, L. M., Cummings, J. R., et al. 2005, Space Sci. Rev., 120, 143 [NASA ADS] [CrossRef] [Google Scholar]
- Cardelli, J. A., Clayton, G. C., & Mathis, J. S. 1989, ApJ, 345, 245 [NASA ADS] [CrossRef] [Google Scholar]
- Corbet, R. H. D. 1986, MNRAS, 220, 1047 [NASA ADS] [CrossRef] [Google Scholar]
- Corbet, R. H. D., & Krimm, H. A. 2009, ATel, 2008, 1 [Google Scholar]
- Corbet, R. H. D., Krimm, H. A., & Skinner, G. K. 2010, ATel, 2559, 1 [NASA ADS] [Google Scholar]
- Cusumano, G., La Parola, V., Romano, P., et al. 2010, MNRAS, 406, L16 [NASA ADS] [Google Scholar]
- D’Aì, A., La Parola, V., Cusumano, G., et al. 2011, A&A, 529, A30 [NASA ADS] [CrossRef] [EDP Sciences] [Google Scholar]
- Filippova, E. V., Tsygankov, S. S., Lutovinov, A. A., & Sunyaev, R. A. 2005, Astron. Lett., 31, 729 [NASA ADS] [CrossRef] [Google Scholar]
- Gehrels, N., Chincarini, G., Giommi, P., et al. 2004, ApJ, 611, 1005 [NASA ADS] [CrossRef] [Google Scholar]
- Hill, J. E., Burrows, D. N., Nousek, J. A., et al. 2004, Proc. SPIE, 5165, 217 [NASA ADS] [CrossRef] [Google Scholar]
- Kaur, R., Wijnands, R., Paul, B., Patruno, A., & Degenaar, N. 2010, MNRAS, 402, 2388 [NASA ADS] [CrossRef] [Google Scholar]
- Kinugasa, K., Torii, K., Hashimoto, Y., et al. 1998, ApJ, 495, 435 [NASA ADS] [CrossRef] [Google Scholar]
- Lang, K. R. 1992, Astrophysical Data I. Planets and Stars, X (New York: Springer-Verlag) [Google Scholar]
- La Parola, V., Cusumano, G., Romano, P., et al. 2010, MNRAS, 405, L66 [NASA ADS] [CrossRef] [Google Scholar]
- Lebrun, F., Leray, J. P., Lavocat, P., et al. 2003, A&A, 411, L141 [NASA ADS] [CrossRef] [EDP Sciences] [Google Scholar]
- Lehay, D. A., Darbro, W., Elsner, R. F., et al. 1983, ApJ, 266, 160 [NASA ADS] [CrossRef] [Google Scholar]
- Lutovinov, A., Walter, R., Belanger, G., et al. 2003, ATel, 155, 1 [NASA ADS] [Google Scholar]
- Negueruela, I., & Schurch, M. P. E. 2007, A&A, 461, 631 [NASA ADS] [CrossRef] [EDP Sciences] [Google Scholar]
- Predehl, P., & Schmitt, J. H. M. M. 1995, A&A, 293, 889 [NASA ADS] [Google Scholar]
- Rieke, G. H., & Lebofsky, M. J. 1985, ApJ, 288, 618 [NASA ADS] [CrossRef] [Google Scholar]
- Segreto, A., Cusumano, G., Ferrigno, C., et al. 2010, A&A, 510, A47 [NASA ADS] [CrossRef] [EDP Sciences] [Google Scholar]
- Ubertini, P., Lebrun, F., Di Cocco, G., et al. 2003, A&A, 411, L131 [NASA ADS] [CrossRef] [EDP Sciences] [Google Scholar]
- Wegner, W. 1994, MNRAS, 270, 229 [NASA ADS] [CrossRef] [Google Scholar]
- Winkler, C., Courvoisier, T. J.-L., Di Cocco, G., et al. 2003, A&A, 411, L1 [NASA ADS] [CrossRef] [EDP Sciences] [Google Scholar]
All Tables
All Figures
|
Fig. 1 Left panel: 15–60 keV BAT significance map of the sky region around AX J1820.5–1434. Right panel: 0.2–10 keV XRT image with superimposed BAT error box (1.08 arcmin, yellow circle) and the position of the NIR counterpart (black cross) as suggested by Kaur et al. (2010). |
| In the text | |
|
Fig. 2 a) Periodogram of Swift-BAT (15–60 keV) data for AX
J1820.5–1434. b) Light curve folded at a period
P0 = 54.0 d with 16 phase bins. The arrows mark the
orbital phase of the Swift-XRT and XMM-Newton
observations. c) Histogram distribution of the
|
| In the text | |
|
Fig. 3 15–60 keV Swift-BAT light curve. Each point represents a time interval of P0/6 = 9.0 d. The vertical shaded bars mark the phase interval of 0.44–0.62 of the folded profile in Fig. 2b. The arrows mark the epoch of the Swift-XRT and XMM-Newton observations. The third Swift-XRT observation is later than the 88-month BAT survey data analysed in this paper. |
| In the text | |
|
Fig. 4 AX J1820.5–1434 broadband (0.2–150 keV ) spectrum. Top panel: XRT (black and red data); EPIC-pn (cyan data); EPIC-MOS1 and EPIC-MOS2 (magenta and blue data); BAT data (green data) and best fit phabs*(powerlaw) model. The Swift data are marked with diamonds. Bottom panel: residuals in unit of standard deviations. |
| In the text | |
|
Fig. 5 Corbet diagram for HMXBs with known spin and orbital period. Diamond and star points represent the Be and supergiant systems, respectively. The red filled circle marks the position of AX J1820.5–1434. |
| In the text | |
Current usage metrics show cumulative count of Article Views (full-text article views including HTML views, PDF and ePub downloads, according to the available data) and Abstracts Views on Vision4Press platform.
Data correspond to usage on the plateform after 2015. The current usage metrics is available 48-96 hours after online publication and is updated daily on week days.
Initial download of the metrics may take a while.