Fig. 3
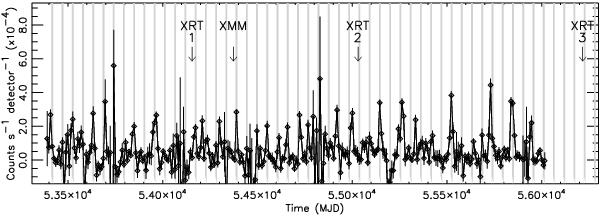
15–60 keV Swift-BAT light curve. Each point represents a time interval of P0/6 = 9.0 d. The vertical shaded bars mark the phase interval of 0.44–0.62 of the folded profile in Fig. 2b. The arrows mark the epoch of the Swift-XRT and XMM-Newton observations. The third Swift-XRT observation is later than the 88-month BAT survey data analysed in this paper.
Current usage metrics show cumulative count of Article Views (full-text article views including HTML views, PDF and ePub downloads, according to the available data) and Abstracts Views on Vision4Press platform.
Data correspond to usage on the plateform after 2015. The current usage metrics is available 48-96 hours after online publication and is updated daily on week days.
Initial download of the metrics may take a while.