Fig. 2
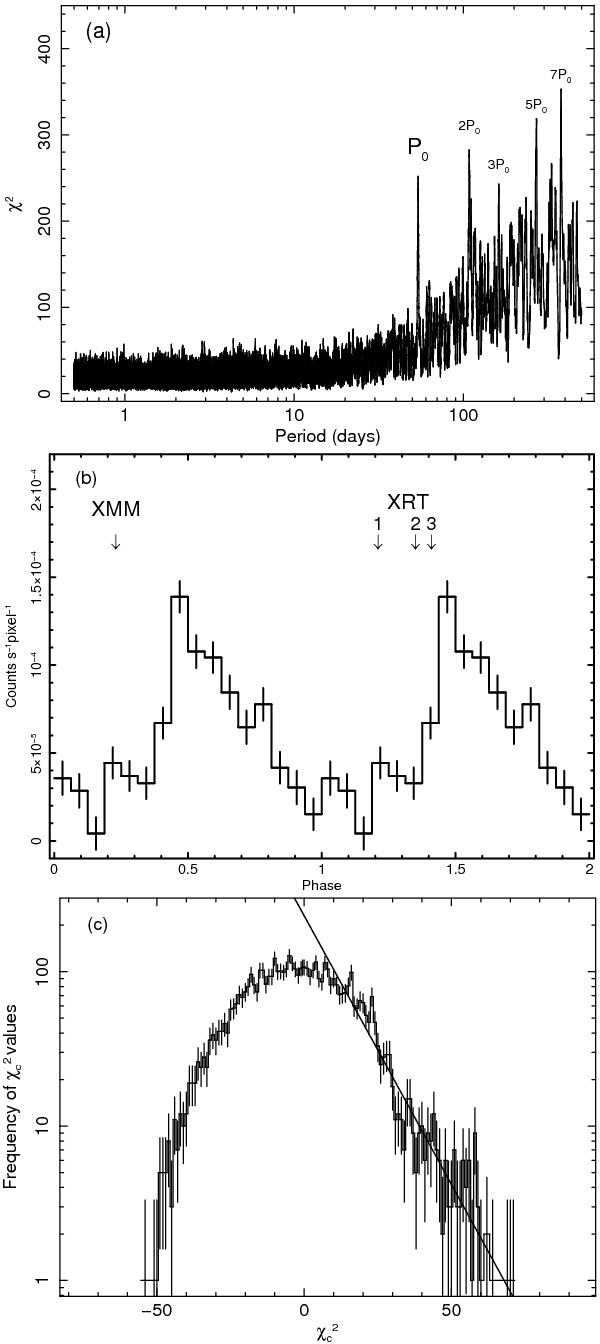
a) Periodogram of Swift-BAT (15–60 keV) data for AX
J1820.5–1434. b) Light curve folded at a period
P0 = 54.0 d with 16 phase bins. The arrows mark the
orbital phase of the Swift-XRT and XMM-Newton
observations. c) Histogram distribution of the
 values; the
solid line is the exponential function that best fits the right tail of the
distribution.
values; the
solid line is the exponential function that best fits the right tail of the
distribution.
Current usage metrics show cumulative count of Article Views (full-text article views including HTML views, PDF and ePub downloads, according to the available data) and Abstracts Views on Vision4Press platform.
Data correspond to usage on the plateform after 2015. The current usage metrics is available 48-96 hours after online publication and is updated daily on week days.
Initial download of the metrics may take a while.