Fig. 4
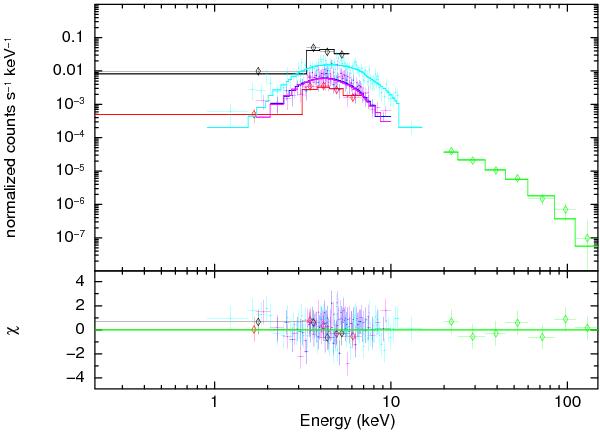
AX J1820.5–1434 broadband (0.2–150 keV ) spectrum. Top panel: XRT (black and red data); EPIC-pn (cyan data); EPIC-MOS1 and EPIC-MOS2 (magenta and blue data); BAT data (green data) and best fit phabs*(powerlaw) model. The Swift data are marked with diamonds. Bottom panel: residuals in unit of standard deviations.
Current usage metrics show cumulative count of Article Views (full-text article views including HTML views, PDF and ePub downloads, according to the available data) and Abstracts Views on Vision4Press platform.
Data correspond to usage on the plateform after 2015. The current usage metrics is available 48-96 hours after online publication and is updated daily on week days.
Initial download of the metrics may take a while.