Fig. 1
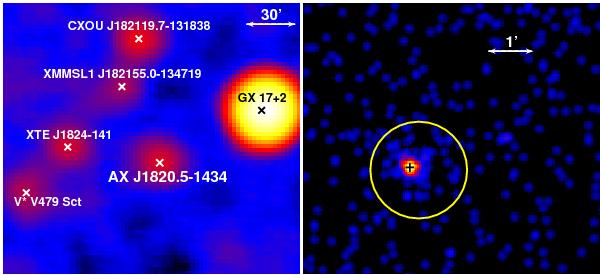
Left panel: 15–60 keV BAT significance map of the sky region around AX J1820.5–1434. Right panel: 0.2–10 keV XRT image with superimposed BAT error box (1.08 arcmin, yellow circle) and the position of the NIR counterpart (black cross) as suggested by Kaur et al. (2010).
Current usage metrics show cumulative count of Article Views (full-text article views including HTML views, PDF and ePub downloads, according to the available data) and Abstracts Views on Vision4Press platform.
Data correspond to usage on the plateform after 2015. The current usage metrics is available 48-96 hours after online publication and is updated daily on week days.
Initial download of the metrics may take a while.