Free Access
Fig. 7
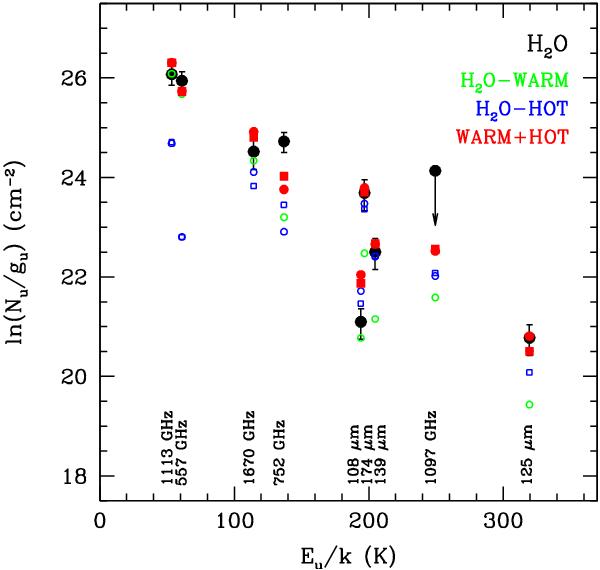
H2O rotational diagram at L1448-B2. Calibration uncertainties of 20% for the HIFI data and 30% for the PACS data have been assumed. The predictions of the two best-fit models for L1448-B2, corrected for the relative predicted filling factors, are shown (see Table 2 and Fig. 6). Symbols are as in Fig. 6.
Current usage metrics show cumulative count of Article Views (full-text article views including HTML views, PDF and ePub downloads, according to the available data) and Abstracts Views on Vision4Press platform.
Data correspond to usage on the plateform after 2015. The current usage metrics is available 48-96 hours after online publication and is updated daily on week days.
Initial download of the metrics may take a while.