| Issue |
A&A
Volume 557, September 2013
|
|
|---|---|---|
| Article Number | A22 | |
| Number of page(s) | 24 | |
| Section | Interstellar and circumstellar matter | |
| DOI | https://doi.org/10.1051/0004-6361/201321674 | |
| Published online | 20 August 2013 | |
Online material
Appendix A: PACS maps
The PACS maps of all the lines observed at the four selected shock positions (B2 and R4 along L1448 and B2 and R along L1157) are presented in this section (see also Table 1) . In particular, Figs. A.1 and A.2 are relative to the L1448 outflow (B2 and L1157 positions, respectively), whereas Figs. A.3 and A.4 concern the L1157 outflow (B2 and R positions, respectively).
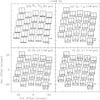 |
Fig. A.1
PACS spectra of the detected transitions at the L1448-B2 position. The centre of each spaxel box corresponds to its offset position with respect to the coordinates of the central shock position. The velocity (km s-1) and intensity scale (Kelvin) are indicated for one spaxel box and refer to all spectra of the relative transition. The labels in the top-right corner of every box indicate the relative transition. |
| Open with DEXTER | |
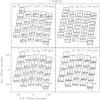 |
Fig. A.1
continued. |
| Open with DEXTER | |
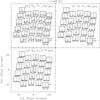 |
Fig. A.1
continued. |
| Open with DEXTER | |
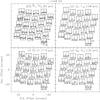 |
Fig. A.2
Same as Fig. A.1 for the L1448-R4 position. |
| Open with DEXTER | |
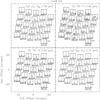 |
Fig. A.2
continued. |
| Open with DEXTER | |
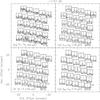 |
Fig. A.3
Same as Fig. A.1 for the L1157-B2 position. |
| Open with DEXTER | |
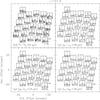 |
Fig. A.4
Same as Fig. A.1 for the L1157-R position. |
| Open with DEXTER | |
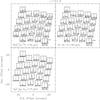 |
Fig. A.4
continued. |
| Open with DEXTER | |
© ESO, 2013
Current usage metrics show cumulative count of Article Views (full-text article views including HTML views, PDF and ePub downloads, according to the available data) and Abstracts Views on Vision4Press platform.
Data correspond to usage on the plateform after 2015. The current usage metrics is available 48-96 hours after online publication and is updated daily on week days.
Initial download of the metrics may take a while.


