Fig. 6
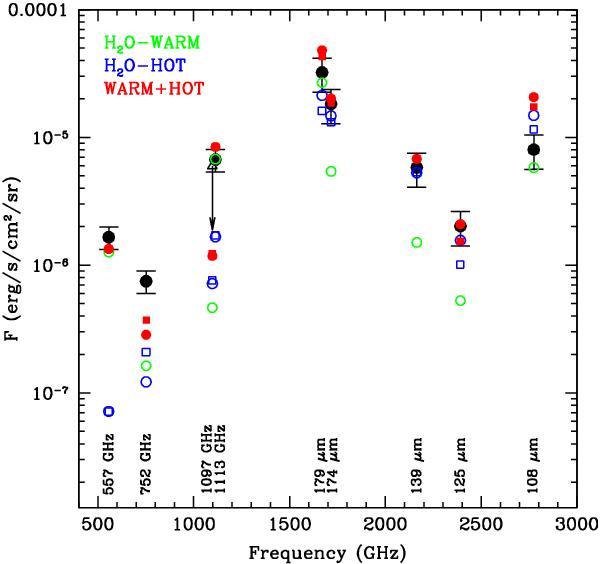
Comparison between the observed H2O fluxes (black dots) and the two best-fit models for L1448-B2, which are given in Table 2: the green model is the fit to the HIFI H2O lines and the two blue models are the extremes of the obtained density range that fits the PACS H2O lines (squares represent n(H2) = 5 × 105 cm-3 and circles represent n(H2) = 5 × 106 cm-3). The red model represents the sum of the fluxes predicted for each line by the green and the two blue models. The fluxes predicted by the models have been corrected for the relative predicted filling factors. Calibration uncertainties of 20% for the HIFI data and 30% for the PACS data have been assumed. The open triangle represents the upper limits of the HIFI H2O 312 − 303 line (Eu = 249 K).
Current usage metrics show cumulative count of Article Views (full-text article views including HTML views, PDF and ePub downloads, according to the available data) and Abstracts Views on Vision4Press platform.
Data correspond to usage on the plateform after 2015. The current usage metrics is available 48-96 hours after online publication and is updated daily on week days.
Initial download of the metrics may take a while.