| Issue |
A&A
Volume 556, August 2013
|
|
|---|---|---|
| Article Number | A101 | |
| Number of page(s) | 10 | |
| Section | Interstellar and circumstellar matter | |
| DOI | https://doi.org/10.1051/0004-6361/201321812 | |
| Published online | 02 August 2013 | |
OH/IR stars and their superwinds as observed by the Herschel Space Observatory ⋆
1
Chalmers University of Technology, Onsala Space Observatory,
439 92
Onsala, Sweden
e-mail:
This email address is being protected from spambots. You need JavaScript enabled to view it.
2
European Space Astronomy Centre, ESA, PO Box 78, 28691
Villanueva de la Cañada,
Madrid,
Spain
3
University College London, Dept. of Physics & Astronomy, Gower
Street, London,
WC1E 6BT,
UK
4
Space Science and Technology Department, Rutherford Appleton
Laboratory, Oxfordshire
OX11 0QX,
UK
5
SRON Netherlands Institute for Space Research,
Sorbonnelaan 2,
3584 CA
Utrecht, The
Netherlands
6
Sterrenkundig Instituut Anton Pannekoek, Universiteit van
Amsterdam, Postbus
94249, 1090 GE
Amsterdam, The
Netherlands
Received:
1
May
2013
Accepted:
7
June
2013
Abstract
Aims. In order to study the history of mass loss in extreme OH/IR stars, we observed a number of these objects using CO as a tracer of the density and temperature structure of their circumstellar envelopes.
Methods. Combining CO observations from the Herschel Space Observatory with those from the ground, we trace mass loss rates as a function of radius in five extreme OH/IR stars. Using radiative transfer modelling, we modelled the dusty envelope as well as the CO emission. The high-rotational transitions of CO indicate that they originate in a dense superwind region close to the star while the lower transitions tend to come from a more tenuous outer wind which is a result of the mass loss since the early AGB phase.
Results. The models of the circumstellar envelopes around these stars suggest that they have entered a superwind phase in the past 200–500 years. The low 18O/17O (~0.1 compared to the solar abundance ratio of ~5) and 12C/13C (3–30 cf. the solar value of 89) ratios derived from our study support the idea that these objects have undergone hot-bottom burning and hence that they are massive M ≥ 5 M⊙ AGB stars.
Key words: stars: AGB and post-AGB / stars: mass-loss / submillimeter: stars
Herschel is an ESA space observatory with science instruments provided by European-led Principal Investigator consortia and with important participation from NASA.
© ESO, 2013
1. Introduction
A class of asymptotic giant branch (AGB) stars known as extreme OH/IR stars are among the objects which undergo intensive mass loss. They were originally identified by the presence of strong 1612 MHz OH masers (e.g., Johansson et al. 1977; te Lintel Hekkert et al. 1989; Sevenster 2002). Later IRAS LRS survey found that these stars have highly dusty circumstellar envelopes with the 10 and 20 μm silicate features both in absorption. Although dust features of OH/IR stars indicate a very high mass loss rate, ground-based CO observations of some of these objects showed very weak emission (Heske et al. 1990) which implied that the mass loss rates were a couple of order of magnitudes lower than those derived from the dust. A detailed study of OH 26.5+0.6 revealed that the star has recently increased its mass loss rate in the past ~200 years (Justtanont et al. 1996). This sudden increase in mass loss rate is called a superwind (Iben & Renzini 1983). Theoretical calculations show that the superwind phase occurs towards the end of the AGB evolution (e.g., Vassiliadis & Wood 1993) when most of the initial mass of the star is lost, allowing the central star to evolve towards a planetary nebula phase. Delfosse et al. (1997) observed low 12CO/13CO ratios in this class of objects and concluded that the central stars underwent hot-bottom burning to achieve such a ratio.
Herschel Observations of objects in this study with the observing time (tobs) in seconds.
The isotopic ratios of AGB stars are keys to determining the stellar mass and the subsequent evolution, because the AGB nucleosynthesis processes depend heavily on their initial masses. Observations by Smith & Lambert (1990) of several O-rich AGB stars in the Magellanic Clouds showed unexpectedly large lithium abundances with a correlation between the abundance and the pulsation period. Sackmann & Boothroyd (1992) predicted a high lithium abundance of log ϵ(7Li)~ 4–4.5, an order of magnitude higher than the cosmic value, for a star which has undergone hot-bottom burning at the base of its convective envelope. The temperature in this layer is 5 × 10⁶ K and is reached by stars of mass >4 M⊙. The Li abundance in these models depended on the initial metallicity. However, Li is easily destroyed as it passes through the convective envelope. A few carbon-rich AGB stars have also been observed to have high Li abundances. These are probably AGB stars with an initial mass of ~4 M⊙ which have begun hot-bottom burning. Both the carbon and oxygen isotopes are affected by this process – 13C is produced from 12C, thereby reducing the 12C abundance throughout the envelope, which results in a lowering of the C/O ratio. This can lead carbon-rich AGB stars to ultimately become oxygen-rich again. Also, 18O is destroyed while 17O remains unchanged relative to 16O during this process. The phase with a low 12C/13C ratio can last ~105 yr for a 5–6 M⊙ star (Lattanzio & Wood 2003).
Many of the envelopes around these extreme OH/IR stars exhibit the presence of water-ice (e.g. Sylvester et al. 1999; Dijkstra et al. 2003; Maldoni et al. 2003; Justtanont et al. 2006) as well as crystalline silicates (e.g. Cami et al. 1998; Sylvester et al. 1999; Molster et al. 2002; Suh 2002). The dust temperature is expected to be below 100–200 K for amorphous and crystalline water-ice to condense out onto existing silicate grains (Hudgins et al. 1993) which requires that the envelope be highly self-shielded, i.e., the density is high. The formation of crystalline silicates requires heating of the amorphous silicate (Kozasa & Sogawa 1999) which can occur in the innermost part of the envelope due to both dust-drag and radiative back-heating of the grains themselves.
In this paper, we present observations of CO rotational lines from a number of extreme OH/IR stars observed by the Herschel Space Observatory (Pilbratt et al. 2010) in order to study the temporal behaviour of the mass loss in these objects, as well as of isotopologues of H2O which can be used as initial mass indicators. Section 2 describes the observations and the results of the radiative transfer modelling are presented in Sect. 3 for individual objects. The implications of the isotopologues of CO and H2O and the superwind are discussed in Sect. 4 and the results are summarized in Sect. 5.
2. Observations
We obtained spectrally resolved observations of the CO lines using the heterodyne instrument (HIFI, de Graauw et al. 2010) aboard Herschel from the guaranteed time programs HIFISTARS (P.I. V. Bujarrabal) and SUCCESS (P.I. D. Teyssier) which observed a total of 5 OH/IR stars in different combinations of CO J = 5–4, 6–5, 9–8, 10–9 and 16–15 (Table 1). The HIFI data were averaged over both H- and V-polarizations and corrected for the beam efficiency (Roelfsema et al. 2012), as well as being corrected baseline distortion by subtracting a polynomial fit to the spectra. A full description of how the data are treated can be found in Justtanont et al. (2012). The high-J transitions probe the warm molecular envelope close to the wind acceleration zone where dust grains impart their momentum to the gas and drive the wind to the observed terminal velocity. Observations of the three most abundant isotopologues of H2O were obtained as part of the HIFISTARS program. In this paper, we present recently obtained data for AFGL 5379 and OH 26.5+0.6 for the transition 312−303.
We also have Herschel SPIRE FTS (Griffin et al. 2010) observations (calibration file SPG v9.1.0) of WX Psc and OH 26.5+0.6 (P.I. Barlow) as well as archival PACS (Poglitsch et al. 2010) spectra of these objects (calibration file SPG v6.1.0) from the MESS guaranteed time program (Groenewegen et al. 2011), which are used to constrain the spectral energy distribution (SED) of individual objects. The PACS spectra were extracted from the central spaxel with no further correction hence the absolute flux for long wavelengths may be underestimated. The SPIRE data for OH 26.5+0.6 show a strong flux excess at the high frequency end of the SLW subspectra. This effect is due to the pick-up of extended emission, either from the source itself, or from its background, by the multi-moded beam applying to this range of the SLW array (see e.g., Swinyard et al. 2010). Inspection of the spectra in the surrounding pixels confirms the compactness of the CO emission detected in the central pixel. The CO envelope is also known to be compact from the BIMA map (Fong et al. 2002). We therefore corrected for this excess using the smoothed average of the spectra collected over the first ring of surrounding detectors. This correction yields the expected continuity between the calibrated spectra of both SLW and SSW central pixels. The spectral resolution of both the FTS and PACS data makes it impossible to study individual CO line profiles and the line fluxes can be affected by blending from other molecules, notably, H2O. The CO line fluxes are calculated by fitting a Gaussian to individual lines in the PACS spectra and sinc functions to unapodized SPIRE spectra (Table 2). The error estimates of these line fluxes are due to the noise of the baseline and do not include possible blends with other molecules. It can be seen that for high-J lines in the PACS range, the baseline gets increasingly noisy. To better constrain the mass loss rate throughout the envelope, we extracted archival CO ground-based data from APEX, JCMT and IRAM (De Beck et al. 2010).
CO line fluxes from Gaussian fitting the SPIRE (up to J = 13−12) and PACS observations.
3. Dust and gas mass loss rates
In order to derive the dust mass loss rate for each object, we fit the SED using the archival data from the Infrared Space Observatory (ISO) and Herschel as well as published photometry. Since the main dust species is silicates, which are responsible for driving the wind, we derived the dust mass loss rate, Ṁd, by mainly fitting the silicate 10 and 20 μm features and use the photometric points as a guide for the overall shape (Fig. 1). The radiative transfer code used is based on Haisch (1979) and the dust opacity is from Justtanont et al. (2006). The input parameters for the SED fitting (Table 3) include the stellar luminosity as calculated from the stellar effective temperature (T∗) and radius (R∗). The expansion velocity, ve, is that measured from CO observations. The distance, D, is taken from the literature. Assuming spherical symmetry and that the dust and gas are fully momentum coupled, we can derive the dynamical mass loss rate, Ṁdyn, due to the dust driven wind (see Goldreich & Scoville 1976; Justtanont et al. 2006). One of the unknown parameters in this calculation is the mass of the star, which we assume to be 5 M⊙ in all cases. This stems from the fact that these stars show the signature of hot-bottom burning via their low 12C/13C ratio (Delfosse et al. 1997). This process operates in stars more massive than ~5 M⊙ (Boothroyd et al. 1993). We discuss this point later in Sect. 4. The derived dynamical mass loss rate is the total gas mass loss rate which is driven by the dust grains to the observed terminal velocity. It can be seen that the derived dynamical mass loss rates for our sample of OH/IR stars are relatively high.
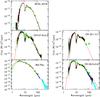 |
Fig. 1 SED fits for the sample stars (solid line) to the ISO spectra (black dots) and photometric points from IRAS (filled green circles). The PACS (blue dots) and SPIRE (cyan dots) spectra are also plotted when available. The published photometric data (open circles) are taken from Dyck et al. (1974) and Epchtein et al. (1980) for WX Psc, Persi et al. (1990) for OH 127.8+0.0, Garcia-Lario et al. (1997) and Lepine et al. (1995) for AFGL 5379, Werner et al. (1980) for OH 26.5+0.6, and Justtanont et al. (2006) for both OH 26.5+0.6 and OH 30.1-0.7. |
Input parameters for SED and dust-drag modelling.
A correlation between observed CO line intensities and mass loss rates has been well established (e.g., Knapp & Morris 1985; Olofsson et al. 1993; De Beck et al. 2010). In spite of this, a number of extreme OH/IR stars which exhibit silicate absorption bands observed by Heske et al. (1990) showed anomalously weak CO J = 1–0 and 2–1 emission. These authors proposed scenarios where the high density is efficient in cooling the gas or that the star had increased its mass loss rate recently and the high density has not propagated out to where the lowest rotational transitions originate. In order to calculate the CO emission, we use a code based on the work by Schoenberg & Hempe (1986). For the mass loss rate, We used the values derived from the SED fitting and dynamical calculation as an input for individual object. For very optically thick envelopes, a change in the gas density has much less effect than a change of gas temperature of the same factor, hence in calculating the CO emission in these stars, the input gas temperature affects the relative distribution of population and hence the calculated line fluxes. The gas temperature is calculated from the energy balance between the dust-drag heating and the cooling by adiabatic expansion and molecular cooling, following Goldreich & Scoville (1976). We also include the effect of photoelectric heating due to photoejected electrons in the outer part of the envelope (Tielens & Hollenbach 1985). The main uncertainty is due to the H2O cooling rate which is crudely estimated. The difficulty with the full radiative transfer calculation for H2O is due to numerous transitions within the temperature range of the circumstellar environment (T ~ 10−2000 K) and that theses lines have very high optical depths, so that our current code fails to converge. However, progress is being made in modelling H2O in S-stars (Schöier et al. 2011; Danilovich et al., in prep.) and in O-rich stars (Maercker et al. 2009) with low mass loss rates. The H2O cooling in OH/IR stars will be addressed in a future work, together with the HIFI observations. For our calculations, the H2O cooling rate is unconstrained and we vary the gas temperature until it gives reasonable fits to all the rotational CO lines observed. Hence, we can constrain the gas kinetic temperature of the high-density superwind rather well. In our sample of objects observed with Herschel, the CO emission indicates that the mass loss rate in all but one star (WX Psc) has recently increased. Using the calculated dynamical mass loss rate for each system, we derived the 12CO abundance relative to H2 which is relatively constant for all the sources, i.e., all have a value of 3 × 10⁻⁴.
3.1. WX Psc (IRC+10011)
This star shows a moderate dust mass loss rate compared to the others in our sample as the 10 μm silicate feature shows self-absorbed emission. The derived dynamical mass loss rate is 1.7 × 10⁻⁵M⊙ yr-1. The SED is best fitted by the dust grains which have an emissivity dependence λ-1.5 (see Fig. 1). The model fit to individual CO transitions from ground-based telescopes and Herschel assumes an outflow with a constant mass loss rate (Fig. 2). We note that Decin et al. (2007) reported a variation in mass loss rate by fitting the ground-based CO observations. Their reported JCMT observations of this object are not consistent with the HIFI J = 6–5 line and the JCMT J = 7−6 line is weaker than that observed with the smaller APEX telescope (De Beck et al. 2010). This suggests that there is a problem with calibration for JCMT observations of this star. The object has been observed to be spherically symmetric on a large scale (Mauron & Huggins 2006) but with a small scale extension (e.g., Hofmann et al. 2001; Inomata et al. 2007; Ladjal et al. 2010). In view of this, we take the simplest approach of fitting the HIFI and ground-based lines with a constant mass loss rate.
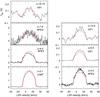 |
Fig. 2 Observed 12CO rotational spectra (black histogram) of WX Psc with the model fit (smooth red line). |
PACS spectrometer and SPIRE FTS data were extracted for this object. A series of CO rotational lines can be seen. The measured line fluxes are plotted in Fig. 3 as crosses and open symbols, respectively. After careful baseline subtraction, it can be seen that the line fluxes of CO 6–5 as measured by HIFI and SPIRE agree extremely well. The high observed J = 10–9 flux from SPIRE is due to a blend with the H2O 312–221 transition which is about twice as strong as the CO line (Justtanont et al. 2012). Our model of the CO emission follows the general rising trend of the fluxes from the Herschel observations. The model, however, predicts lower line fluxes than observed with SPIRE, while the observed PACS CO lines become increasingly noisy. The mismatch between the SPIRE observation and the model may be due to the assumption of a constant mass loss rate and the assumption of spherical symmetry in the calculation.
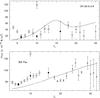 |
Fig. 3 CO line fluxes taken SPIRE (open circles), HIFI (filled squares) and PACS (crosses) are shown together with the predicted fluxes from the model which is the best fit to both ground-based observations and HIFI for WX Psc (bottom) and OH 26.5+0.6 (top). The high SPIRE flux of J = 10–9 is due to a blend with a strong H2O line. |
HIFISTARS observed four transitions of 13CO J = 6–5, 9−8, 10–9 and 16–15 (Justtanont et al. 2012), although the highest transition is extremely noisy and can be viewed as an upper limit (Fig. 4). Using the same parameters as for the 12CO model, we derive an abundance for 13CO relative to H2 of (3 ± 1) × 10-5, i.e., 12C/13C ~ 10 ± 4 (Table 4). The estimated uncertainty of this ratio is a combination of the uncertainty of the derived 13CO/H2 ratio and a canonical 20% uncertainty for 12CO abundance. This ratio is at the lower end of the estimated range of 10–35 for a sample of O-rich AGB stars (Milam et al. 2009).
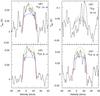 |
Fig. 4 Observed HIFI 13CO rotational spectra (black histogram) of WX Psc with the model fit (smooth red line). Also plotted are the abundance limits for 13CO/H2 of 2 × 10⁻⁵ (blue line) and 4 × 10⁻⁵ (green line). |
3.2. OH 127.8+0.0
The infrared spectrum of this object displays deep silicate absorption bands at 10 and 20 μm, indicating a very high current mass loss rate (Fig. 1). The derived dynamical mass loss rate of the star is 9.2 × 10⁻⁴M⊙ yr-1.
However, using a constant mass loss rate results in overestimating the ground based CO observations. In order to fit both the Herschel HIFI and IRAM (Delfosse et al. 1997) observations, the mass loss rate in the outer part where the J = 1–0 and 2–1 originate is taken to be a fraction of the derived dynamical mass loss rate (Fig. 5). The radius where the superwind ends, rsw (Table 4), is 130 R∗, i.e., 1.2 × 1016 cm and the mass loss rate beyond this radius is set to 2.8 × 10⁻⁶M⊙ yr-1. The HIFI lines taken from the SUCCESS program are noisy due to shorter integration time compared with spectra taken from HIFISTARS. The fits to these lines, although not perfect, are reasonable given the relatively low signal-to-noise ratio. Recently, Lombaert et al. (2013) studied the mass loss of this star and concluded that in order to fit all the available CO data, the mass loss rate in the outer part must be lower compared to the inner superwind.
Derived superwind radius, rsw and 13CO abundances for the stars in this study.
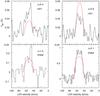 |
Fig. 5 Observed 12CO rotational spectra (black histogram) of OH 127.8+0.0 with the model fit (smooth red line) which has an inner superwind surrounded by a tenuous outer wind. |
Delfosse et al. (1997) also observed 13CO 1–0 and 2–1 from this object. Using the same approach as for WX Psc, we used the same input parameters except for the abundance to fit the two lines (Fig. 6). We derive a 13CO/H2 abundance of 1.5 ± 0.5 × 10⁻⁴, i.e., a 12C/13C ratio of 2 ± 1 (Table 4). This is consistent with the central star having undergone hot-bottom burning, destroying 12C and reaching the equilibrium 12C/13C ratio of ~3. (Lattanzio & Wood 2003).
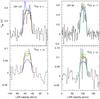 |
Fig. 6 Observed 13CO spectra from IRAM (black histogram) for OH 127.8+0.0 (left panels) and OH 30.1–0.7 (right panels) with the model fit (smooth red line) and the upper (green) and lower (blue) limits to the abundances for the species (see text). |
3.3. AFGL 5379
For this object we use a distance of 580 pc, taken from van der Veen & Rugers (1989), rather than the larger distance of 1190 pc derived by Yuasa et al. (1999). As can be seen from the SED in Fig. 1, its flux level is an order of magnitude higher than the other extreme OH/IR stars in the sample and is similar to that of WX Psc. The infrared spectrum shows deep silicate absorption features, reflected in the high derived dynamical mass loss rate of 1.6 × 10⁻⁴M⊙ yr-1. The far-IR silicate dust efficiency is best fitted with a slope of λ-1.5, as in the case of WX Psc.
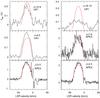 |
Fig. 7 Observed 12CO rotational spectra (black histogram) of AFGL 5379 with the model fit (smooth red line) which has an inner superwind surrounded by a tenuous outer wind. |
In order to fit the observed CO lines, the superwind has to be truncated at a radius of 1016 cm. The outer mass loss rate for this model is 3.9 × 10⁻⁶M⊙ yr-1. The model gives reasonable fits to all the lines (Fig. 7), except for the J = 16–15 line where the observation is highly affected by the sinusoidal effect seen in HIFI observation in bands 6 and 7 (1.44–1.92 THz) due to standing waves in the instrument (Roelfsema et al. 2012). However, further careful analysis confirms the line is much weaker than the model. The misfit of the model indicates that the simple assumption of spherical symmetry may not apply close to the star.
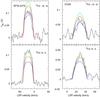 |
Fig. 8 Observed HIFI 13CO rotational spectra (black histogram) with the model fit (smooth red line) and with the upper (green line) and lower (blue line) limits to the 12C/13C abundance ratio for AFGL 5379 (left panels) and OH 26.5+0.6 (right panels). |
The fit to the HIFI observations of the two 13CO transitions leads to a
13CO/H2 abundance of (1.1 ± 0.4) × 10-5 (Fig. 8). Both lines cannot be well fitted with a single
abundance, however. The resulting ratio of 12C/13C is of 27 ± 11.
This high value could mean that the star has either just started the process of hot-bottom
burning and the 13C has not been significantly produced or the process has
already taken place and the central star has entered a phase where 12C is being
synthesized again. Further evidence that hot-bottom burning process has started in this
star is the non-detection of the  O line (see
Sect. 4).
O line (see
Sect. 4).
3.4. OH 26.5+0.6
Extensive studies have been done of OH 26.5+0.6 over the years in order to establish the superwind radius (rsw, i.e., the radius where the intense mass loss rate has propagated outwards). Fong et al. (2002) resolved the circumstellar envelope in the CO J = 1−0 line, giving an outer radius of 7 × 1016 cm but did not resolve the superwind. Mid-infrared interferometric observations established the full-width-half maximum of the dusty envelope of ~280 milliarcsec (Chesneau et al. 2005). At a distance of 1.37 kpc (van Langevelde et al. 1990), this translates to 6 × 1015 cm. Driebe et al. (2005) observed this object in the K′ band and resolved the inner radius of the dust shell to be between 29.3 mas at the minimum phase and 69.5 mas during the maximum phase.
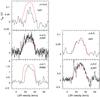 |
Fig. 9 Observed 12CO rotational spectra (black histogram) of OH 26.5+0.6 with the model fit (smooth red line) with an inner superwind surrounded by a tenuous outer wind. |
From fitting the SED and solving the equation of motion between the dust and gas interaction, we derive a dynamical mass loss rate of 3.2 × 10⁻⁴M⊙ yr-1. The continuum fluxes observed by Herschel using PACS and SPIRE (Fig. 1) follow the ISO fluxes reasonably well, except for the longest wavelength channel of SPIRE (Fig. 1). To fit the observed CO lines, we limit the superwind radius to 9 × 1015 cm, with a mass loss rate beyond this radius of 1.6 × 10⁻⁶M⊙ yr-1 (Fig. 9). The IRAM J = 2–1 line has the interstellar line component removed (Heske et al. 1990) hence its blue wing is missing. The HIFI spectrum of CO J = 10–9 displays a much narrower line than expected. It is not clear why this is the case. It is possible that the wind acceleration is not as steep, but rather that in the region where the CO 10–9 originates the velocity is lower than the result of the dust-driven wind would suggest. In Fig. 3, it can be seen that the CO 10–9 line from SPIRE show a much higher flux than the corresponding HIFI line due to the strong H2O blend. The high-J CO lines observed by PACS are noisy due to the low flux.
From HIFISTARS, two 13CO transitions were detected and our derived abundance for 13CO/H2 for this object is (1 ± 0.5) × 10-5. The uncertainty of this abundance is relatively high since the 6–5 line is more optically thick compared to the 10–9 transition. This results in a 12C/13C ratio of 30 ± 16 which is relatively high for our sample but with a large uncertainty.
3.5. OH 30.1–0.7
The star has been observed by ISO to have deep silicate absorption bands, like most other stars in our sample. It is also be seen to have water-ice and crystalline silicates (Justtanont et al. 2006). Our derived dynamical mass loss rate is 1.8 × 10⁻⁴M⊙ yr-1.
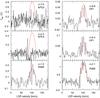 |
Fig. 10 Observed 12CO rotational spectra (black histogram) of OH 30.1–0.7 with the model fit (smooth red line) with an inner superwind surrounded by a tenuous outer wind. |
The ground-based CO observations taken at APEX reported by De Beck et al. (2010) showed a non-detection (Fig. 10) which is most likely due to the mispointing of the telescope (15′′ off in the RA direction from checking the header information of the APEX observations) as the source was readily detected by IRAM (Delfosse et al. 1997) and Herschel. To fit the IRAM and HIFI observations, the radius of the superwind is limited to 2.5 × 1016 cm with the mass loss rate in the outer region falling to 1.8 × 10⁻⁶M⊙ yr-1 (Fig. 10). The derived abundance of 13CO/H2 is (8 ± 0.3) × 10-5, resulting in a 12C/13C ratio from fitting the 13CO IRAM observations (Fig. 6) for this star of 4 ± 1, which is close to the expected equilibrium value for stars which have experienced hot-bottom burning (Boothroyd et al. 1993).
4. Discussion
From observations and CO modelling, we derived mass loss rates and CO abundances relative to H2, as well as those for 13CO for all stars in our sample. Here, we discuss the implications of our finding.
4.1. The relative abundances C and O isotopes
The solar value of 12C/13C is estimated to be 87 (Scott et al. 2006), which is similar to the value derived from meteorites (Anders & Grevesse 1989). It has been reported that the galactic ratio appears to be dependent on the distance from the galactic centre (see e.g., Henkel et al. 1994; Wilson & Rood 1994). The interstellar ratios estimated within 100 pc along different lines of sight vary between 62 and 98 (Casassus et al. 2005). A solar isotopic ratio of 480 for 16O/18O has been determined by Scott et al. (2006) while the solar 16O/17O ratio is taken to be 2600 with a large uncertainty due to the weakness of the C17O lines (Asplund et al. 2009).
There are extensive observations of CO and CN in C-rich AGB stars which show that the 12C/13C ratio has a range between 30 and 150 (e.g., Lambert et al. 1986; Ohnaka & Tsuji 1996; Schöier & Olofsson 2000) with a few stars showing a low 12C/13C ratio. Ohnaka & Tsuji (1999) found small ratios for J-type C-stars, between 2 and 10. The values derived for circumstellar envelopes of O-rich AGB stars are relatively limited and have a range of 10 to 80 (Bujarrabal et al. 1994; Milam et al. 2009). For sufficiantly high-mass AGB stars, 13C can be produced by CNO-cycle hot-bottom burning of the third dredge-up 12C and then transported to the photosphere to become part the the circumstellar envelope due to mass loss processes during the AGB phase. The ratio of the carbon isotopes can be used as a tracer of stellar mass as 13C is readily synthesized in high mass AGB stars (Lattanzio & Wood 2003).
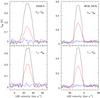 |
Fig. 11 HIFISTARS spectra of OH 26.5+0.6 (left) and AFGL 5379
(right) showing the transitions 312−303
and 111−000 of |
Three of the five stars in our sample have low 12C/13C ratios (Table 4) as derived from the CO line fluxes, based on both ground based and HIFI observations. Due to the high mass loss rates, even 13CO lines can be optically thick. It is curious to note that the ratios derived from the IRAM observations are lower than those derived from the HIFI observations. However, the derived abundance ratios from high-J lines have larger uncertainties associated with them due to the high 13CO line opacity in the superwind. A low 12C/13C ratio is expected when a star undergoes hot-bottom burning. The lower mass limit for this process to occur is >4 M⊙ (Sackmann & Boothroyd 1992). Theoretical calculations of the third dredge-up for stars more massive than 5 M⊙ show that this ratio initially increases from ~17 to 30 and then drops down to a value of 3 once the temperature at the base of the convective envelope is hot enough to produce significant 13C from 12C (Lattanzio & Wood 2003). This value increases again after the end of this phase. The implication of our derived 12C/13C ratio is that these extreme OH/IR stars have originated from the high mass end of intermediate-mass stars.
Although 12C/13C ratios have been studied in AGB stars, very little
work has been done on the isotopic ratios of 18O and even less on
17O due to thier low abundances. Thanks to the high sensitivity of
Herschel, we can begin such studies using H2O molecules. As
part of the HIFISTARS observations, three of the stars in our sample have been observed
with a frequency setting which included the 111−000
(para-H2O) and 312−303 (ortho-H2O)
transitions for  O,
O,
 O and
O (Table
1). Justtanont et
al. (2012) reported the HIFI spectra of WX Psc which showed line flux ratios for
O/O of 1.5
for both ortho and para lines. For AFGL 5379 and OH 26.5+0.6, it can be clearly seen here
that the O and
O are
detected while the O line is not
detected above the noise (Fig. 11). The estimated
line flux ratios of O/O for AFGL
5379 are 0.05 and 0.09 and for OH 26.5+0.6 are 0.13 and 0.09 for the ortho and para lines,
respectively. These values are well below the solar 18O/17O ratio of
~5 and the interstellar value of ~3.5 Wilson &
Rood (1994). The non-detection of O in AFGL
5379 and OH 26.5+0.6 and the almost equally strong O and
O line fluxes
in WX Psc provide evidence that O is
destroyed in the hot-bottom burning process which operates in more massive AGB stars
(Lattanzio et al. 1996). This result gives a
strong indication of the lower limit to the stellar mass which is not as model dependent
as for the case of the derived 12C/13C ratios.
O and
O (Table
1). Justtanont et
al. (2012) reported the HIFI spectra of WX Psc which showed line flux ratios for
O/O of 1.5
for both ortho and para lines. For AFGL 5379 and OH 26.5+0.6, it can be clearly seen here
that the O and
O are
detected while the O line is not
detected above the noise (Fig. 11). The estimated
line flux ratios of O/O for AFGL
5379 are 0.05 and 0.09 and for OH 26.5+0.6 are 0.13 and 0.09 for the ortho and para lines,
respectively. These values are well below the solar 18O/17O ratio of
~5 and the interstellar value of ~3.5 Wilson &
Rood (1994). The non-detection of O in AFGL
5379 and OH 26.5+0.6 and the almost equally strong O and
O line fluxes
in WX Psc provide evidence that O is
destroyed in the hot-bottom burning process which operates in more massive AGB stars
(Lattanzio et al. 1996). This result gives a
strong indication of the lower limit to the stellar mass which is not as model dependent
as for the case of the derived 12C/13C ratios.
4.2. The superwind
The phenomenon of a superwind has been postulated because a constant mass loss rate does not remove enough stellar mass during the AGB lifetime to allow low- and intermediate-mass stars to evolve into planetary nebulae. Vassiliadis & Wood (1993) showed that a superwind develops during the last thermal pulses while the stellar luminosity and pulsation period increase. For a 5-M⊙ star, the superwind can last 105 yr, i.e. half of the thermal-pulse AGB lifetime. From our modelling, the radius of this superwind, rsw, (Table 4) was derived for each object from fitting high- and low-J CO lines. Assuming a constant expansion velocity for these lines, we can calculate the lifetime of the superwind for individual stars. This implies that the stars in our sample have entered the superwind phase only in the past few hundred years, i.e., 0.3% of the theoretical lifetime of the superwind phase. During the Infrared Astronomical Satellite (IRAS) all sky survey, 50 000 low resolution spectrometer (LRS) spectra were taken, of which about 150 show silicate absorption with a blue continuum (class 3n) which are associated with OH/IR stars (Likkel 1989). However, there may still be some contamination in this classification. Suh & Kwon (2009) searched the IRAS LRS catalogue and found that out of 1400 spectra of O-rich stars and 931 C-stars, 180 objects showed the 10 μm silicate feature in absorption, a similar number to that found by Likkel (1989). This indicates that from an unbiased all-sky survey the fraction of extreme OH/IR stars is ~8% of the AGB population – much higher than the ratio of the estimated superwind lifetime to the total thermal-pulse time on the AGB. When stars enter a superwind phase, they become very bright in the infrared and luminous in OH masers – OH 26.5+0.6 and AFGL 5379 are among the AGB stars which exhibit the strongest OH 1612 MHz masers (te Lintel Hekkert et al. 1989). Even though these objects are confined to the galactic plane and hence suffer from heavy extinction as well as from confusion due to the high density of stars in the plane, the luminosity bias means that they are easily picked up in maser and infrared surveys. This could partially be the reason why we detect an enhanced fraction of these objects.
5. Summary
From fitting the SEDs of a sample of extreme OH/IR stars, we have derived very high mass loss rates, reflecting the absorption seen in the 10 μm silicate dust feature. Using CO as a mass loss tracer, from ground based observations and those obtained by Herschel, we propose that four out of five stars in our sample have recently increased their mass loss rates. The high-J CO lines probe the warm envelope inside the superwind while the low-J lines originate from outer cooler regions where the mass loss is lower. The timescale since the start of the superwind phase is estimated to vary between ~200–500 years. From the ground based observations done so far, there is no evidence that there has been a superwind phase earlier than observed by us, i.e., there is no obvious evidence of multiple shells of mass loss around the objects (Cox et al. 2012).
The derived 12C/13C ratios in some objects are much lower than the canonical value of ~20–30 observed for stars with initial masses of 4–6 M⊙ after the third dredge-up (Lattanzio & Wood 2003). Due to the effect of hot-bottom burning, this ratio can be reduced to closer to 3–4 over a timescale of ~105 yr. Our modelling gives a range for this ratio of between 2–30, with some stars having a large uncertainty on this ratio. The low observed 18O/17O (~0.1) ratios for the stars in our sample compared, with the solar value of ~5, give a strong indication that these stars have undergone the process of hot-bottom burning, implying that they are massive (≥5 M⊙) AGB stars.
These stars are seen to be presently losing mass at prodigious rates of ~10-4M⊙ yr-1. High mass loss rate AGB stars may be the dominant source of dust and gas return to the ISM (Matsuura et al. 2009) and these stars can have a significant impact on the chemical and dust enrichment of the interstellar medium. They are thus crucial in studies of galactic chemical evolution.
Acknowledgments
This research is party funded by the Swedish National Space Board. We would like to thank Leen Decin for her valuable comments to the manuscript. We also thank both the referee and the editor (Malcolm Walmsley) for further comments for improvement of this paper. HIFI has been designed and built by a consortium of institutes and university departments from across Europe, Canada and the United States under the leadership of SRON Netherlands Institute for Space Research, Groningen, The Netherlands and with major contributions from Germany, France and the US. Consortium members are: Canada: CSA, U.Waterloo; France: CESR, LAB, LERMA, IRAM; Germany: KOSMA, MPIfR, MPS; Ireland, NUI Maynooth; Italy: ASI, IFSI-INAF, Osservatorio Astrofisico di Arcetri-INAF; Netherlands: SRON, TUD; Poland: CAMK, CBK; Spain: Observatorio Astronómico Nacional (IGN), Centro de Astrobiologia (CSIC-INTA). Sweden: Chalmers University of Technology – MC2, RSS & GARD; Onsala Space Observatory; Swedish National Space Board, Stockholm University – Stockholm Observatory; Switzerland: ETH Zurich, FHNW; USA: Caltech, JPL, NHSC. PACS has been developed by a consortium of institutes led by MPE (Germany) and including UVIE (Austria); KU Leuven, CSL, IMEC (Belgium); CEA, LAM (France); MPIA (Germany); INAF-IFSI/OAA/OAP/OAT, LENS, SISSA (Italy); IAC (Spain). This development has been supported by the funding agencies BMVIT (Austria), ESA-PRODEX (Belgium), CEA/CNES (France), DLR (Germany), ASI/INAF (Italy), and CICYT/MCYT (Spain). SPIRE has been developed by a consortium of institutes led by Cardiff University (UK) and including Univ. Lethbridge (Canada); NAOC (China); CEA, LAM (France); IFSI, Univ. Padua (Italy); IAC (Spain); Stockholm Observatory (Sweden); Imperial College London, RAL, UCL-MSSL, UKATC, Univ. Sussex (UK); and Caltech, JPL, NHSC, Univ. Colorado (USA). This development has been supported by national funding agencies: CSA (Canada); NAOC (China); CEA, CNES, CNRS (France); ASI (Italy); MCINN (Spain); SNSB (Sweden); STFC and UKSA (UK); and NASA (USA).
References
- Anders, E., & Grevesse, N. 1989, Geochim. Cosmochim. Acta, 53, 197 [Google Scholar]
- Asplund, M., Grevesse, N., Sauval, A. J., & Scott, P. 2009, ARA&A, 47, 481 [NASA ADS] [CrossRef] [Google Scholar]
- Boothroyd, A. I., Sackmann, I.-J., & Ahern, S. C. 1993, ApJ, 416, 762 [NASA ADS] [CrossRef] [Google Scholar]
- Bujarrabal, V., Fuente, A., & Omont, A. 1994, A&A, 285, 247 [NASA ADS] [Google Scholar]
- Cami, J., de Jong, T., Justtannont, K., Yamamura, I., & Waters, L. B. F. M. 1998, Ap&SS, 255, 339 [Google Scholar]
- Casassus, S., Stahl, O., & Wilson, T. L. 2005, A&A, 441, 181 [NASA ADS] [CrossRef] [EDP Sciences] [Google Scholar]
- Chesneau, O., Verhoelst, T., Lopez, B., et al. 2005, A&A, 435, 563 [NASA ADS] [CrossRef] [EDP Sciences] [Google Scholar]
- Cox, N. L. J., Kerschbaum, F., van Marle, A.-J., et al. 2012, A&A, 537, A35 [NASA ADS] [CrossRef] [EDP Sciences] [Google Scholar]
- De Beck, E., Decin, L., de Koter, A., et al. 2010, A&A, 523, A18 [NASA ADS] [CrossRef] [EDP Sciences] [Google Scholar]
- Decin, L., Hony, S., de Koter, A., et al. 2007, A&A, 475, 233 [NASA ADS] [CrossRef] [EDP Sciences] [Google Scholar]
- de Graauw, T., Helmich, F. P., Phillips, T. G., et al. 2010, A&A, 518, L6 [NASA ADS] [CrossRef] [EDP Sciences] [Google Scholar]
- Delfosse, X., Kahane, C., & Forveille, T. 1997, A&A, 320, 249 [NASA ADS] [Google Scholar]
- Dijkstra, C., Dominik, C., Hoogzaad, S. N., de Koter, A., & Min, M. 2003, A&A, 401, 599 [NASA ADS] [CrossRef] [EDP Sciences] [Google Scholar]
- Driebe, T., Riechers, D., Balega, Y., et al. 2005, Astron. Nachr., 326, 648 [NASA ADS] [Google Scholar]
- Dyck, H. M., Lockwood, G. W., & Capps, R. W. 1974, ApJ, 189, 89 [NASA ADS] [CrossRef] [Google Scholar]
- Epchtein, N., Guibert, J., Nguyen-Quang-Rieu, Turon, P., & Wamsteker, W. 1980, A&A, 85, L1 [NASA ADS] [Google Scholar]
- Fong, D., Justtanont, K., Meixner, M., & Campbell, M. T. 2002, A&A, 396, 581 [NASA ADS] [CrossRef] [EDP Sciences] [Google Scholar]
- Garcia-Lario, P., Manchado, A., Pych, W., & Pottasch, S. R. 1997, A&AS, 126, 479 [NASA ADS] [CrossRef] [EDP Sciences] [Google Scholar]
- Goldreich, P., & Scoville, N. 1976, ApJ, 205, 144 [Google Scholar]
- Griffin, M. J., Abergel, A., Abreu, A., et al. 2010, A&A, 518, L3 [Google Scholar]
- Groenewegen, M. A. T., Waelkens, C., Barlow, M. J., et al. 2011, A&A, 526, A162 [NASA ADS] [CrossRef] [EDP Sciences] [Google Scholar]
- Haisch, B. M. 1979, A&A, 72, 161 [NASA ADS] [Google Scholar]
- Henkel, C., Wilson, T. L., Langer, N., Chin, Y.-N., & Mauersberger, R. 1994, in The Structure and Content of Molecular Clouds, eds. T. L. Wilson, & K. J. Johnston (Berlin: Springer Verlag), Lect. Not. Phys., 439, 72 [Google Scholar]
- Heske, A., Forveille, T., Omont, A., van der Veen, W. E. C. J., & Habing, H. J. 1990, A&A, 239, 173 [NASA ADS] [Google Scholar]
- Hofmann, K.-H., Balega, Y., Blöcker, T., & Weigelt, G. 2001, A&A, 379, 529 [NASA ADS] [CrossRef] [EDP Sciences] [Google Scholar]
- Hudgins, D. M., Sandford, S. A., Allamandola, L. J., & Tielens, A. G. G. M. 1993, ApJS, 86, 713 [NASA ADS] [CrossRef] [Google Scholar]
- Iben, Jr., I., & Renzini, A. 1983, ARA&A, 21, 271 [NASA ADS] [CrossRef] [Google Scholar]
- Inomata, N., Imai, H., & Omodaka, T. 2007, PASJ, 59, 799 [NASA ADS] [Google Scholar]
- Johansson, L. E. B., Andersson, C., Goss, W. M., & Winnberg, A. 1977, A&A, 54, 323 [NASA ADS] [Google Scholar]
- Justtanont, K., Skinner, C. J., Tielens, A. G. G. M., Meixner, M., & Baas, F. 1996, ApJ, 456, 337 [NASA ADS] [CrossRef] [Google Scholar]
- Justtanont, K., Olofsson, G., Dijkstra, C., & Meyer, A. W. 2006, A&A, 450, 1051 [NASA ADS] [CrossRef] [EDP Sciences] [Google Scholar]
- Justtanont, K., Khouri, T., Maercker, M., et al. 2012, A&A, 537, A144 [NASA ADS] [CrossRef] [EDP Sciences] [Google Scholar]
- Knapp, G. R., & Morris, M. 1985, ApJ, 292, 640 [NASA ADS] [CrossRef] [Google Scholar]
- Kozasa, T., & Sogawa, H. 1999, in Asymptotic Giant Branch Stars, eds. T. Le Bertre, A. Lebre, & C. Waelkens, IAU Symp., 191, 239 [Google Scholar]
- Ladjal, D., Justtanont, K., Groenewegen, M. A. T., et al. 2010, A&A, 513, A53 [NASA ADS] [CrossRef] [EDP Sciences] [Google Scholar]
- Lambert, D. L., Gustafsson, B., Eriksson, K., & Hinkle, K. H. 1986, ApJS, 62, 373 [NASA ADS] [CrossRef] [Google Scholar]
- Lattanzio, J., & Wood, P. R. 2003, in Asymptotic giant branch stars, by H. J. Habing, & H. Olofsson, Astronomy and astrophysics library (New York, Berlin: Springer), eds. H. J. Habing, & H. Olofsson, 23 [Google Scholar]
- Lattanzio, J., Frost, C., Cannon, R., & Wood, P. R. 1996, Mem. Soc. Astron. Italiana, 67, 729 [Google Scholar]
- Lepine, J. R. D., Ortiz, R., & Epchtein, N. 1995, A&A, 299, 453 [NASA ADS] [Google Scholar]
- Likkel, L. 1989, ApJ, 344, 350 [NASA ADS] [CrossRef] [Google Scholar]
- Lombaert, R., Decin, L., de Koter, A., et al. 2013, A&A, 554, A142 [NASA ADS] [CrossRef] [EDP Sciences] [Google Scholar]
- Maercker, M., Schöier, F. L., Olofsson, H., et al. 2009, A&A, 494, 243 [NASA ADS] [CrossRef] [EDP Sciences] [Google Scholar]
- Maldoni, M. M., Egan, M. P., Smith, R. G., Robinson, G., & Wright, C. M. 2003, MNRAS, 345, 912 [NASA ADS] [CrossRef] [Google Scholar]
- Matsuura, M., Barlow, M. J., Zijlstra, A. A., et al. 2009, MNRAS, 396, 918 [NASA ADS] [CrossRef] [Google Scholar]
- Mauron, N., & Huggins, P. J. 2006, A&A, 452, 257 [NASA ADS] [CrossRef] [EDP Sciences] [Google Scholar]
- Milam, S. N., Woolf, N. J., & Ziurys, L. M. 2009, ApJ, 690, 837 [NASA ADS] [CrossRef] [Google Scholar]
- Molster, F. J., Waters, L. B. F. M., Tielens, A. G. G. M., & Barlow, M. J. 2002, A&A, 382, 184 [NASA ADS] [CrossRef] [EDP Sciences] [Google Scholar]
- Ohnaka, K., & Tsuji, T. 1996, A&A, 310, 933 [NASA ADS] [Google Scholar]
- Ohnaka, K., & Tsuji, T. 1999, A&A, 345, 233 [NASA ADS] [Google Scholar]
- Olofsson, H., Eriksson, K., Gustafsson, B., & Carlstrom, U. 1993, ApJS, 87, 267 [NASA ADS] [CrossRef] [Google Scholar]
- Persi, P., Ferrari-Toniolo, M., Ranieri, M., Marenzi, A., & Shivanandan, K. 1990, A&A, 237, 153 [NASA ADS] [Google Scholar]
- Pilbratt, G. L., Riedinger, J. R., Passvogel, T., et al. 2010, A&A, 518, L1 [CrossRef] [EDP Sciences] [Google Scholar]
- Poglitsch, A., Waelkens, C., Geis, N., et al. 2010, A&A, 518, L2 [NASA ADS] [CrossRef] [EDP Sciences] [Google Scholar]
- Roelfsema, P. R., Helmich, F. P., Teyssier, D., et al. 2012, A&A, 537, A17 [NASA ADS] [CrossRef] [EDP Sciences] [Google Scholar]
- Sackmann, I.-J., & Boothroyd, A. I. 1992, ApJ, 392, L71 [NASA ADS] [CrossRef] [Google Scholar]
- Schoenberg, K., & Hempe, K. 1986, A&A, 163, 151 [NASA ADS] [Google Scholar]
- Schöier, F. L., & Olofsson, H. 2000, A&A, 359, 586 [NASA ADS] [Google Scholar]
- Schöier, F. L., Maercker, M., Justtanont, K., et al. 2011, A&A, 530, A83 [NASA ADS] [CrossRef] [EDP Sciences] [Google Scholar]
- Scott, P. C., Asplund, M., Grevesse, N., & Sauval, A. J. 2006, A&A, 456, 675 [NASA ADS] [CrossRef] [EDP Sciences] [Google Scholar]
- Sevenster, M. N. 2002, AJ, 123, 2772 [NASA ADS] [CrossRef] [Google Scholar]
- Smith, V. V., & Lambert, D. L. 1990, ApJ, 361, L69 [NASA ADS] [CrossRef] [Google Scholar]
- Suh, K.-W. 2002, MNRAS, 332, 513 [NASA ADS] [CrossRef] [Google Scholar]
- Suh, K.-W., & Kwon, Y.-J. 2009, J. Korean Astron. Soc., 42, 81 [NASA ADS] [CrossRef] [Google Scholar]
- Swinyard, B. M., Ade, P., Baluteau, J.-P., et al. 2010, A&A, 518, L4 [Google Scholar]
- Sylvester, R. J., Kemper, F., Barlow, M. J., et al. 1999, A&A, 352, 587 [NASA ADS] [Google Scholar]
- te Lintel Hekkert, P., Versteege-Hensel, H. A., Habing, H. J., & Wiertz, M. 1989, A&AS, 78, 399 [NASA ADS] [Google Scholar]
- Tielens, A. G. G. M., & Hollenbach, D. 1985, ApJ, 291, 722 [NASA ADS] [CrossRef] [Google Scholar]
- van der Veen, W. E. C. J., & Rugers, M. 1989, A&A, 226, 183 [NASA ADS] [Google Scholar]
- van Langevelde, H. J., van der Heiden, R., & van Schooneveld, C. 1990, A&A, 239, 193 [NASA ADS] [Google Scholar]
- Vassiliadis, E., & Wood, P. R. 1993, ApJ, 413, 641 [NASA ADS] [CrossRef] [Google Scholar]
- Werner, M. W., Beckwith, S., Gatley, I., et al. 1980, ApJ, 239, 540 [NASA ADS] [CrossRef] [Google Scholar]
- Wilson, T. L., & Rood, R. 1994, ARA&A, 32, 191 [NASA ADS] [CrossRef] [Google Scholar]
- Yuasa, M., Unno, W., & Magono, S. 1999, PASJ, 51, 197 [NASA ADS] [Google Scholar]
All Tables
Herschel Observations of objects in this study with the observing time (tobs) in seconds.
CO line fluxes from Gaussian fitting the SPIRE (up to J = 13−12) and PACS observations.
All Figures
|
Fig. 1 SED fits for the sample stars (solid line) to the ISO spectra (black dots) and photometric points from IRAS (filled green circles). The PACS (blue dots) and SPIRE (cyan dots) spectra are also plotted when available. The published photometric data (open circles) are taken from Dyck et al. (1974) and Epchtein et al. (1980) for WX Psc, Persi et al. (1990) for OH 127.8+0.0, Garcia-Lario et al. (1997) and Lepine et al. (1995) for AFGL 5379, Werner et al. (1980) for OH 26.5+0.6, and Justtanont et al. (2006) for both OH 26.5+0.6 and OH 30.1-0.7. |
| In the text | |
|
Fig. 2 Observed 12CO rotational spectra (black histogram) of WX Psc with the model fit (smooth red line). |
| In the text | |
|
Fig. 3 CO line fluxes taken SPIRE (open circles), HIFI (filled squares) and PACS (crosses) are shown together with the predicted fluxes from the model which is the best fit to both ground-based observations and HIFI for WX Psc (bottom) and OH 26.5+0.6 (top). The high SPIRE flux of J = 10–9 is due to a blend with a strong H2O line. |
| In the text | |
|
Fig. 4 Observed HIFI 13CO rotational spectra (black histogram) of WX Psc with the model fit (smooth red line). Also plotted are the abundance limits for 13CO/H2 of 2 × 10⁻⁵ (blue line) and 4 × 10⁻⁵ (green line). |
| In the text | |
|
Fig. 5 Observed 12CO rotational spectra (black histogram) of OH 127.8+0.0 with the model fit (smooth red line) which has an inner superwind surrounded by a tenuous outer wind. |
| In the text | |
|
Fig. 6 Observed 13CO spectra from IRAM (black histogram) for OH 127.8+0.0 (left panels) and OH 30.1–0.7 (right panels) with the model fit (smooth red line) and the upper (green) and lower (blue) limits to the abundances for the species (see text). |
| In the text | |
|
Fig. 7 Observed 12CO rotational spectra (black histogram) of AFGL 5379 with the model fit (smooth red line) which has an inner superwind surrounded by a tenuous outer wind. |
| In the text | |
|
Fig. 8 Observed HIFI 13CO rotational spectra (black histogram) with the model fit (smooth red line) and with the upper (green line) and lower (blue line) limits to the 12C/13C abundance ratio for AFGL 5379 (left panels) and OH 26.5+0.6 (right panels). |
| In the text | |
|
Fig. 9 Observed 12CO rotational spectra (black histogram) of OH 26.5+0.6 with the model fit (smooth red line) with an inner superwind surrounded by a tenuous outer wind. |
| In the text | |
|
Fig. 10 Observed 12CO rotational spectra (black histogram) of OH 30.1–0.7 with the model fit (smooth red line) with an inner superwind surrounded by a tenuous outer wind. |
| In the text | |
|
Fig. 11 HIFISTARS spectra of OH 26.5+0.6 (left) and AFGL 5379
(right) showing the transitions 312−303
and 111−000 of |
| In the text | |
Current usage metrics show cumulative count of Article Views (full-text article views including HTML views, PDF and ePub downloads, according to the available data) and Abstracts Views on Vision4Press platform.
Data correspond to usage on the plateform after 2015. The current usage metrics is available 48-96 hours after online publication and is updated daily on week days.
Initial download of the metrics may take a while.