Fig. 1
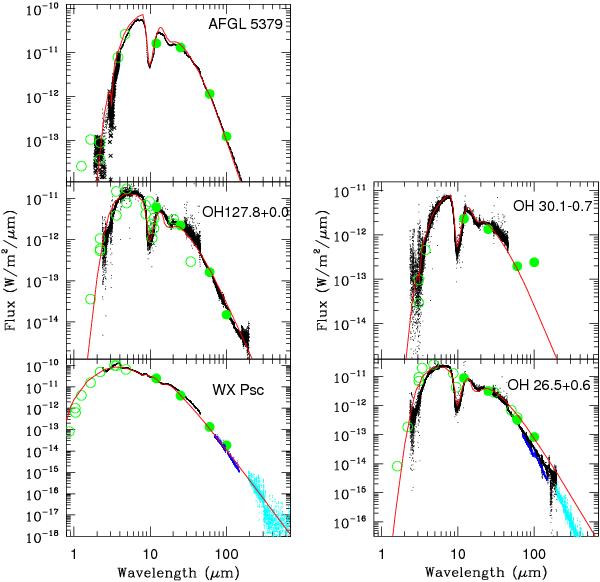
SED fits for the sample stars (solid line) to the ISO spectra (black dots) and photometric points from IRAS (filled green circles). The PACS (blue dots) and SPIRE (cyan dots) spectra are also plotted when available. The published photometric data (open circles) are taken from Dyck et al. (1974) and Epchtein et al. (1980) for WX Psc, Persi et al. (1990) for OH 127.8+0.0, Garcia-Lario et al. (1997) and Lepine et al. (1995) for AFGL 5379, Werner et al. (1980) for OH 26.5+0.6, and Justtanont et al. (2006) for both OH 26.5+0.6 and OH 30.1-0.7.
Current usage metrics show cumulative count of Article Views (full-text article views including HTML views, PDF and ePub downloads, according to the available data) and Abstracts Views on Vision4Press platform.
Data correspond to usage on the plateform after 2015. The current usage metrics is available 48-96 hours after online publication and is updated daily on week days.
Initial download of the metrics may take a while.