Free Access
Fig. 8
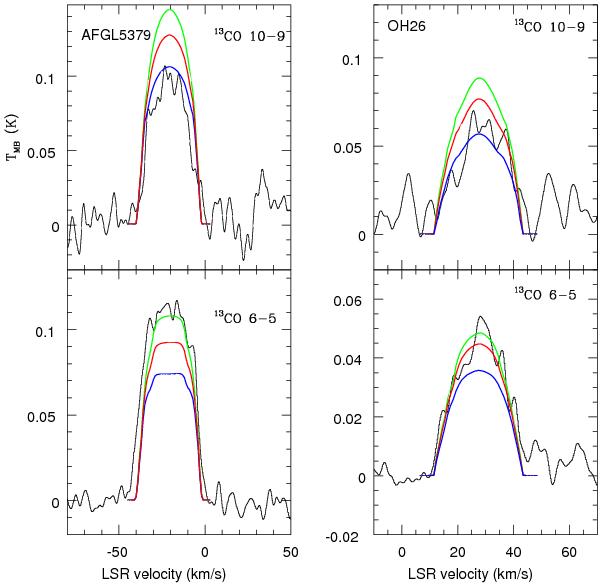
Observed HIFI 13CO rotational spectra (black histogram) with the model fit (smooth red line) and with the upper (green line) and lower (blue line) limits to the 12C/13C abundance ratio for AFGL 5379 (left panels) and OH 26.5+0.6 (right panels).
Current usage metrics show cumulative count of Article Views (full-text article views including HTML views, PDF and ePub downloads, according to the available data) and Abstracts Views on Vision4Press platform.
Data correspond to usage on the plateform after 2015. The current usage metrics is available 48-96 hours after online publication and is updated daily on week days.
Initial download of the metrics may take a while.