| Issue |
A&A
Volume 556, August 2013
|
|
|---|---|---|
| Article Number | A129 | |
| Number of page(s) | 9 | |
| Section | Interstellar and circumstellar matter | |
| DOI | https://doi.org/10.1051/0004-6361/201321422 | |
| Published online | 08 August 2013 | |
LkHα 101 at millimeter wavelengths
1
Instituto de Radio Astronomía Milimétrica,
Avenida Divina Pastora 7, Núcleo
Central,
18012
Granada,
Spain
e-mail:
This email address is being protected from spambots. You need JavaScript enabled to view it.
2
Institut de Radio Astronomie
Millimétrique,300 rue de la
Piscine, Dom. Univ. de Grenoble, 38406 Saint Martin d’Hères, France
e-mail: This email address is being protected from spambots. You need JavaScript enabled to view it.
; krips]@iram.fr
3
Centro de Astrobiología (CSIC/INTA) Ctra de Torrejón a Ajalvir, km
4, 28850 Torrejón de Ardoz, Madrid, Spain
e-mail:
This email address is being protected from spambots. You need JavaScript enabled to view it.
Received: 6 March 2013
Accepted: 15 May 2013
Abstract
We present new millimeter observations made with the IRAM interferometer and 30 m telescope of the ionized wind from the massive young stellar object LkHα 101. Several recombination lines, including higher order transitions, were detected for the first time at radio wavelengths in this source. From three α-transitions, we derive an accurate value for the stellar velocity and for the first time, an unambiguous expansion velocity of the wind that is 55 km s-1. This velocity is much slower than reported previously, and the resulting mass loss rate is 1.8 × 10⁻⁶ M⊙ yr-1. The wideband continuum spectra and the interferometer visibilities show that the density of the wind falls off more steeply than what is compatible with constant-velocity expansion. We argue that these properties indicate that the wind is launched from a radially narrow region of the circumstellar disk, and we propose that slow speed and a steep density gradient are characteristic properties of the evolutionary phase, where young stars of intermediate and high mass clear away the gaseous component of their accretion disks. The recombination lines are emitted close to local thermal equilibrium, but the higher order transitions appear systematically broader and weaker than expected, probably because of impact broadening. Finally, we show that LkHα 101 shares many properties with MWC 349, the only other stellar wind source where radio recombination lines have been detected, with some of them masing. We argue that LkHα 101 evades masing at millimeter wavelengths because of the disk’s smaller size and unfavorable orientation. Some amplification may however be detectable at shorter wavelengths.
Key words: radio lines: stars / stars: winds, outflows / radio continuum: stars / X-rays: diffuse background
© ESO, 2013
1. Introduction
Radio recombination lines have proved to be a valuable tool for investigations of the dust enshrouded environments of young massive stars. These stars are sufficiently hot to ionize part or all of the surrounding gas which then emits recombination lines as a function of its electron temperature, density, and emission measure. At centimeter wavelengths where recombination lines typically probe electron densities in the range of ne = 103−105 cm-3, the kinematics and other physical properties of numerous compact and ultracompact HII-regions were investigated (Roelfsema & Goss 1992; Sewilo et al. 2011, and references therein).
However, regions of higher electron density, like the inner parts of stellar winds or the coronae of circumstellar disks, do not often emit centimeter recombination lines. The free-free emission from these regions with ne ≳ 106 cm-3 and typical sizes ~10-3 pc are opaque at centimeter wavelengths. Sensitive millimeter observations are needed for these sources, of which the IR- and radio-bright stellar wind source MWC 349 may well be regarded as prototypical. The properties of its inner ionized disk/wind system have been the subject of numerous studies (Báez-Rubio et al. 2013, and references therein).
In this paper, we report the detection of several millimeter recombination lines, using both IRAM telescopes, from another radio star, LkHα 101 (IRAS 04269+3510), whose radio emission is a factor of three weaker than that of MWC 349. The spectral energy distribution of LkHα 101 has long been known to be rising toward shorter wavelengths (Cohen 1980), which indicates the presence of an ionized stellar wind. Interferometric observations in the near-infrared (λλ 2−12 μm) reveal the presence of a hot circumstellar disk seen nearly face-on (Tuthill et al. 2002). This complex circumstellar environment was already hinted at in earlier optical/IR spectroscopic investigations (Herbig 1971; Thompson et al. 1976; Simon & Cassar 1984; Hamann & Persson 1989), whose detections of permitted and forbidden lines demonstrated the presence ionised and neutral regions of high-density as well as low-density regions. Velocity-resolved spectroscopy (e.g. Simon & Cassar 1984) furthermore showed some high-density tracers to be double-peaked, as expected from a rotating disk. Low-density tracers showed the kinematic signature of a slowly flowing, ionized wind.
LkHα 101 illuminates NGC 1579, the brightest patch in the L1482 nebulosity. The star also created a small HII-region, and it must therefore be hot. The star’s spectral type and luminosity class cannot however be obtained from the optical spectrum, since it does not have any photospheric absorption lines (Herbig 1971). Instead, its spectral type near B0.5 is derived from optical photometry, and broad band IR photometry (Harvey et al. 1979; Barsony et al. 1990) gives its luminosity of 2−3 × 10⁴L⊙. A star of these properties at the zero-age main sequence has an effective temperature of ~30 000 K and a mass of ~15 M⊙ (Panagia 1973).
Most physical parameters of LkHα 101 depend strongly on the star’s distance, which was controversial in the past. Estimates ranged from 160 pc, placing the star near the Taurus dark cloud (which however is not known for its massive star formation), to 800 pc, which is the value originally given by Herbig (1971) on the basis of two optically identified B-stars. In a recent optical investigation of the LkHα 101 environment, Herbig et al. (2004) found five additional B-stars that each illuminate a small patch of L1482 and are therefore at a very similar distance as the nebulosity and LkHα 101. These authors derive a distance of the nebulosity of 700 pc, which is the value we use here. Data taken from the literature have been scaled to this value if necessary.
2. Observations
2.1. Plateau de Bure
The observations were carried out with the IRAM interferometer in its six-element configuration (March 13, 2010) under conditions of excellent atmospheric seeing (~0.23′′) and low zenith opacity (~0.03) at 100 GHz. The wideband correlator, WIDEX, was configured to cover the 97.7–101.3 GHz radio frequency band in both polarizations with a velocity resolution of 6.0 km s-1. This 3.6 GHz wide band includes five recombination lines, H40α and four higher order transitions whose relative calibration is better than 3% owing to their inclusion in the same correlator band. The narrowband correlator was adjusted to observe the line transitions in horizontal polarization with a velocity resolution of 0.24 km s-1. Line frequencies and Gaussian fits are listed in Table 2.
The radio-frequency bandpass calibration was performed on 2 MHz channels using B0415+379. The slope of the spectrum (Fig. 2) was found to be within LkHα 101’s spectral index uncertainties over the range of 10 to 200 GHz. Amplitude and phase were calibrated by interleaving observations of B0411+341 and B0415+379 every 24 min. To reduce phase noise, visibilities were self-calibrated in phase on all baselines using the clean-component model as input. The flux density scale, which was derived from observations of 3C 273 and adjusted to fit the radio spectrum of MWC349 (Krips et al., in prep.), is estimated to be accurate within 10%. The synthesized beam of 1.43′′ × 0.99′′ was calculated, adopting natural weighting. The data were calibrated and analyzed with the GILDAS1 software package.
2.2. 30 m telescope
The observations at the IRAM 30 m telescope were made during 16–17 October 2011 using the facility receiver EMIR (Carter et al. 2012) in the setup where each of the 3 and 1.3 mm bands were in dual polarization and observed simultaneously. Both bands of 4 GHz width were connected to the autocorreletor WILMA which provides a spectral resolution of 2 MHz. The 3 mm band is centered at 106.7 GHz and contains the recombination lines H39α and H49β. The 1.3 mm band is centered at 257.0 GHz and contains H29α and H41γ. Line frequencies are listed in Table 2 together with Gaussian fits.
Observing conditions were good with zenith opacities not exceeding 0.15 at 257 GHz. System temperatures ranged between 200 and 250 K at 257 GHz, and were around 100 K in the 3 mm band. Line and continuum antenna temperatures were derived from the usual hot/cold load calibration and then converted to flux densities using the Jy/K ratios of 6.1 (8.4) at 107 (257) GHz as given on the observatory’s web pages. Table 2 gives statistical errors. The absolute calibration uncertainty is estimated to be about 15% at 1 mm and 10% for the longer wavelengths.
3. Results
3.1. Continuum emission
3.1.1. Interferometer data
The uv coverage obtained during the 3.6 h on-source was sufficient to obtain a high quality continuum map of LkHα 101. The source is slightly offset from the phase center and appears to be extended. From fitting the visibilities in the uv-plane we derive a total flux of 230 ± 25 mJy (Table 1). No other source is seen in the primary beam (46′′ at 100 GHz) down to a 3σ limit of 7.2 mJy. The companion detected by Tuthill et al. (2002) in the near-infrared at ~0.17′′ from LkHα 101 cannot be distinguished from the main source because of insufficient angular resolution. The “necklace” of radio sources discovered by Becker & White (1988) lies outside of our primary field of view.
Parameters of the continuum source.
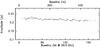 |
Fig. 1 Visibilities of LkHα 101 at 99.5 GHz observed with the IRAM interferometer over baselines ranging to 450 m. The straight line represents the fit of a wind model, as described in the text. |
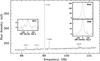 |
Fig. 2 Interferometer spectrum obtained with the new wideband correlator (WIDEX) that is centered at 99.5 GHz. The five recombination lines that fall in the 3.6 GHz wide spectrum are labeled. The zoomed-in spectra of the three clearly detected lines are shown in the insets on velocity scales with the continuum subtracted. The dotted red curves indicate Gaussian fits whose parameters are listed in Table 2. |
The shape of the visibility function (Fig. 1), azimuthally averaged and plotted against uv-radius, clearly shows that the source is resolved. The visibility amplitude drops by ~10% over the range of baselines observed. We have tried to fit this data with several shape functions, including Gaussians, but we obtain a satisfactory fit only in the case where the electron density ne falls off with radius r as a power law ( . The radius r1 and the exponent γ are given in Table 1. Density laws of this type are typical of ionized winds as discussed below.
The fit assumes spherical symmetry of the wind and derives an inner cut-off radius r0, which turns out to be close to the radius r1 where the source becomes optically thick (τ = 1 at 3 mm). With the electron density n0 at r0, the fit gives the parameter n0 , which characterizes the strength of the wind. The exponent γ of the density law and the electron temperature Te are not well constrained by the fit. While Te ~ 9500 K, γ ranges from −2 for the constant velocity wind to −3 where the wind would be strongly accelerated. The derived value of r1 implies that the wind has a small optically thick core whose blackbody emission amounts to ~85 mJy. The major part (65%) of the observed 3mm flux must therefore come from the optically thin envelope.
3.1.2. The spectral energy distribution
We combined the flux density obtained at 99.5 GHz from the interferometer with the observations at 106 and 257 GHz from the 30 m telescope (Table 2) and with data from the literature to construct the spectral energy distribution (SED) of LkHα 101 (Fig. 3). Since the source is embedded in an extended HII-region (Becker & White 1988), we use at the lower frequencies only observations of high angular resolution. At frequencies above ~30 GHz, the HII-region is much weaker than LkHα 101 in beams smaller than 30′′. From the 5 GHz map shown in Fig. 2 of Becker & White (1988), we estimate that the total flux of the HII-region is less than 30 mJy. At millimeter wavelengths, the HII-region is even weaker, and its contribution in the 3 mm beam of the 30 m telescope is less than 10 mJy and completely negligible in both the interferometer beam and in the 1 mm beam of the 30 m telescope.
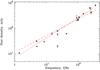 |
Fig. 3 Spectral energy distribution of LkHα 101 in the radio/millimeter regime. Data are taken from Becker & White (1988) (°); Gibb & Hoare (2007) (△); Altenhoff et al. (1994) (×); Sandell et al. (2011) (▴); priv. comm. by Krips (•); and this paper (■). The continuous red line is a weighted fit to the observations and has a slope of α = 0.86 in logarithmic units. The dashed red line is a fit to the same data, where the slope has been fixed to its canonical value α = 0.60. |
The source has the inverted spectrum typical of an ionized wind, as reported extensively in the literature (Simon & Cassar 1984; Becker & White 1988; Hamann & Persson 1989; Altenhoff et al. 1994; Gibb & Hoare 2007; Sandell et al. 2011). While the spectral slope α (defined as Sν ∝ ν α) is 0.6 for the canonical case of an isothermal plasma expanding isotropically at constant velocity (Panagia & Felli 1975), we derive the slightly higher value of α = 0.86 ± 0.03 from the data shown in Fig. 3. We have excluded the VLA-A observations at 22.5 and 43 GHz from our fit that appear anomalously low, possibly because of calibration problems. If this data were retained, the result (α = 0.89 ± 0.07) however would be essentially the same.
The higher than canonical value of α is strongly supported by i) the slope of the 3.6 GHz wide interferometer spectrum; and ii) the fit to the visibilities. From the slope of the spectral baseline (Fig. 2), we derive α = 0.90 ± 0.10, which is fully compatible with the value derived from the SED. The power law exponent γ derived from the fit of the visibilities is directly related to the spectral slope of the SED (Panagia & Felli 1975; Olnon 1975), and we derive α = 0.95 ± 0.15, which is again higher than the canonical value.
The data used for representing the SED were taken by many independent projects over the course of two decades. Any time variations of the source or calibration biases may then distort the derived α. We therefore give higher weight to the values of α that are derived from the interferometer spectrum and visibilities and adopt a best estimate of α = 0.90 ± 0.10. As a corollary, the electron density of the ionized wind falls off like r-2.4, which is slightly steeper than in the canonical case.
3.1.3. Wind structure
From the continuum data we derive some physical properties of the ionized wind. Following Panagia & Felli (1975) and adapting their equations to our non-canonical slope of α = 0.90, we get  (1)where Ṁ is the mass loss rate and υexp the expansion velocity of the wind. Assuming that the wind is isotropic, we calculate the characteristic radius R(ν), inside of which half of the emission at frequency ν is generated, and the electron density ne at this radius as
 ![Mathematical equation: \begin{eqnarray} \label{e:Rnu} R(\nu) &= &11.1\ \left[\frac{\nu}{300\ {\rm~GHz}}\right]^{-0.55},\\ \label{e:ne} [4mm] n_{\rm e} &=& 5\,10^7\ \left[\frac{R(\nu)}{10\,{\rm AU}}\right]^{-2.4}, \end{eqnarray}](/articles/aa/full_html/2013/08/aa21422-13/aa21422-13-eq74.png) where R(ν) is in astronomical units, AU, and ne in cm-3.
where R(ν) is in astronomical units, AU, and ne in cm-3.
For the frequency of 99.5 GHz at which our interferometer observations were made, Eq. (2) predicts a characteristic radius of 20 AU or 29 mas. This is greater than r1, the radius where the source becomes optically thick at 3 mm (Table 1). This relation, R(ν) ≳ r1, must be expected because of the different definition of these radii and because most of the emission comes from the optically thin envelope.
Encouraged by this agreement, we proceed to use these parameterizations to infer several important properties of the ionized wind. First, we obtain an estimate of the electron density, ~3 × 107 cm-3, at 13 AU Emission around 260 GHz, the frequency of our H29α and H41γ transitions, comes predominantly from this region. Correspondingly, our various transitions near 100 GHz come from R(ν) ~ 26 AU, where the electron density is on the order 8 × 106 cm-3. These densities are several orders of magnitude higher than those in the well studied compact HII-regions (Gordon & Walmsley 1990). Unusual behavior of the millimeter recombination lines as indeed found here (Sect. 3.3) may then be expected.
Secondly, the emission at 300 GHz, the highest frequency where the non-canonical slope is known to hold, originates at radii near 11 AU (Eq. (2)). This is inside the dusty torus that surrounds the star at ~15 AU (Tuthill et al. 2002). Either the wind is launched from this inner dust-free region, or more likely in our view, the assumption of an isotropic stellar wind breaks down at radii smaller than the dust disk.
As a consistency check of the derived parameterization of the stellar wind, we calculate the beam-averaged continuum brightness temperature measured with the interferometer. Using the relation between flux density Sν (in mJy) and brightness temperature Tmb (in K) for a Gaussian beam of equivalent FWHP θb (in arcsec) valid at λ = 3 mm 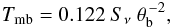 we derive a beam-averaged brightness temperature of 17.5 K. We estimate the beam dilution, adopting the source radius predicted by Eq. (2) to be a factor of 1.7 × 10⁻³. The source brightness temperature then follows as ~104 K, which is typical of photo-ionized nebulae. Given the approximations involved, the derived brightness temperature is also in reasonable agreement with the electron temperature derived by Becker & White (1988), who obtain 7000 K from directly fitting the fall-off of the visibility function with uv-radius. This agreement confirms that the ionized wind is optically thick even at millimeter wavelengths.
Recombination lines (rest frequency ν) observed and Gaussian fits.
3.2. The α-transitions
We have detected six recombination lines in LkHα 101, among which there are three α-transitions in the 1–3 mm wavelength range. The only other stellar wind source where radio recombination lines have so far been detected is MWC 349 (Altenhoff et al. 1981) where the lines are found masing over a wide range of wavelengths (Martín-Pintado et al. 1989; Thum et al. 1998). It is therefore worth checking whether the recombination lines in LkHα 101 are in local thermal equilibrium.
3.2.1. Line-to-continuum ratios
The line-to-continuum ratios (L/C) offer the best quantitative tool for investigating any strong departures from local thermal equilibrium (LTE). The velocity-integrated L/C observed for H40α in LkHα 101 is  using the values given in Table 2. The L/C expected for an optically thin plasma is in the range from 47.6 to 30.6 km s-1 for LTE electron temperatures,
  , ranging from 7000 to 104 K. (Mezger & Höglund 1967). We note that we have neglected any ionized helium in this calculation in line with the low upper limit observed (Sect. 3.2.4).
This range of expected L/C barely includes the observed value. We know however that the L/C is reduced in wind sources compared to the fully optically thin case. Altenhoff et al. (1981) derive a reduction factor of  for the canonical case of a constant-velocity wind. This reduction factor is further decreased to 0.53 (Rodríguez et al. 2009) if the electron density falls off like r-2.4, as suggested above. We then derive LTE electron temperatures of 7400 K for the canonical r-2 wind and 6300 K for the r-2.4 case. This range of temperatures includes the 7000 K derived at the end of Sect. 3.1 and obtained by Becker & White (1988). This agreement supports our view that the α-transitions are emitted near LTE.
This view is further strengthened by the L/C, which we derive for H39α and H29α (Table 2). Both ratios are fully compatible with our H40α value, which is the most precise of the three measurements. Extrapolating the mean of the 3 mm L/C to 256 GHz like ν1.1, as appropriate for plasma under LTE conditions, we predict a H29α L/C of 90 km s-1, which agrees with the observed value within observational error.
3.2.2. Systemic velocity
The center velocities of our three α-transitions are in the range of −2.5 to + 0.4 km s-1. The individual values are mildly incompatible with each other, probably because of small departures from gaussianity of the line profiles. A weighted average gives the systemic velocity of the wind in the local standard of rest, LSR, as  which we also take to be the radial velocity of the star (Rodríguez 1982). Very similar velocities were obtained from Brα (−2 ± 2 km s-1) and Brγ (−1 ± 2 km s-1) by Simon & Cassar (1984). The star appears to be at rest in its natal molecular cloud, as demonstrated by the very close agreement in velocity (−1.7 km s-1) of its optically thin HCN emission (Pirogov 1999). Velocities of Balmer transitions, by contrast, appear to be shifted to the blue by −2...−4 km s-1 (Herbig et al. 2004). Other optical lines also appear to be blue shifted by similar amounts, as found by the same authors. This behavior is to be expected if dust in the disk obscures part of the receding flow. Velocities of absorption lines are also blue shifted as by ≲1 km s-1, as shown by the vibrationally excited transition of CO at λ4.7 μm (Mitchell et al. 1990), the 1–0 rotational transition of CO (Knapp et al. 1976; Gibb et al. 2010), and atomic hydrogen (Dewdney & Roger 1986). These neutral components may be evidence of a slow expansion of the molecular cloud in which LkHα 101 is embedded.
3.2.3. Wind expansion velocity and rate of mass loss
We estimate the wind expansion velocity υexp from H40α, which is the line with the best observed profile. Because of the low inclination of the (nearly face-on) disk, its contribution to the line profile appears at low radial velocities near the line center, whereas the wind dominates the line wings. This decomposition of the line profile into disk and wind components is also justified on grounds of the symmetry properties of the profile. Whereas the Gaussian line core is rather symmetric, the wings are not. Again due to the near face-on geometry, emission from the approaching and receding parts of the wind must be expected to differ as a consequence of optical depth and stimulation. The blue-shifted part of the wind should then be brighter, as is indeed observed (right inset of Fig. 2). We detect emission from the wind out to + 50 and −70 km s-1. Considering the thermal broadening of ~20 km s-1, we conclude that υexp is 55 km s-1with an estimated uncertainty of 10 km s-1. We postpone a more detailed discussion of the observed line profiles to a follow-up paper (Báez-Rubio et al., in prep.).
Adopting our estimate of υexp= 55 km s-1 and using the ratio /Ṁυexp derived above (Eq. (1)) we obtain the rate of mass loss of the wind: (4)The first derivation of [Ṁentity!#x20!]in LkHα 101 (Cohen et al. 1982) combines the radio flux with an optical υexp based on Hα. The width of Hα, ~1300 km s-1, was however later shown to be caused electron scattering (Hamann & Persson 1989), and the derived [Ṁentity!#x20!]was thus much too high. In an attempt to correct for this effect, Hamann & Persson model the Hα profile assuming a location, density and temperature structure of the electron scattering layer. They conclude that the Hα line wings outside ~350 km s-1 can all be explained by electron scattering. Later determinations of [Ṁentity!#x20!](e.g. Gibb & Hoare 2007) then use this value as the expansion velocity of the wind, despite that these large velocities are not supported by the widths of other optical/near-infrared hydrogen or helium lines. Their widths are much smaller (30...60 km s-1) and more in line with our measurement. Since our millimeter observations are not affected by the uncertainties of dust obscuration and of the precise Hα profile modeling, we think that our measurement provides the first reliable determination of .Ṁ
3.2.4. Helium
The recombination lines of singly ionized helium are offset from the transitions of hydrogen with the same quantum numbers by −122 km s-1. We have inspected the four spectra of α-transitions (e.g. see Fig. 2) and do not find any evidence of ionized helium. We give an upper limit for its abundance (by number) of  This low He+ abundance compounds earlier conclusions by Simon & Cassar (1984), who find that y+ cannot be larger than 0.05 based on transitions in the near-infrared. The low y+ is generally attributed to the low effective temperature of the central star whose spectral type B0.5 (Cohen 1980) implies a very low luminosity of photons energetic enough to ionize helium (Panagia 1973).
3.3. Higher order recombination lines
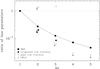 |
Fig. 4 Ratios of close frequency pairs. Each ratio relates a parameter of a recombination line of order Δn (= nupper−nlower = 1,2,3,4 for the α,β,γ, or δ transitions) to that of the α transition at a nearby frequency (See Table 2). Parameter ratios are shown for the peak line intensity and whenever available, the line full width at half power (FWHP) and the integrated intensity. The continuous line labeled “B&S” gives the ratios expected for optically thin plasma at low-density (Brocklehurst & Seaton 1972). |
Higher order recombination lines, i.e. transitions where the principal quantum number changes by Δn > 1, are another tool for investigating departures from thermal equilibrium. Traditionally, the ratio of a higher order line and an α-line at a nearby frequency is used to minimize calibration problems. The practicality of this tool at millimeter wavelengths has been demonstrated on a number of compact HII-regions by Gordon & Walmsley (1990). The tool was also applied to the stellar wind source MWC 349 (Thum et al. 1995), where the line ratios clearly show that some α-transitions are amplified. Here, we apply this tool for the first time to the supposedly “ordinary” stellar wind source LkHα 101.
Several close frequency pairs have been selected for this investigation (Table 2). We show their observed ratios of both their integrated line flux and their peak line flux, as a function of Δn in Fig. 4. The thick continuous line gives the ratio expected for optically thin, low-density plasma. We also show the ratio of the widths of the line pairs.
We find that all flux ratios are significantly below their classical values with the discrepancy increasing with Δn, while their width ratios are significantly higher than unity and also increasing with Δn. We note that close frequency pairs observed in different wavelength bands and with different telescopes consistently follow this same trend. This behavior is the signature of impact broadening.
Motivated by this finding and the inadequacy of Gaussians for fitting the stronger lines (Fig. 2), we have fitted the four transitions with the best observed line profiles with Voigt functions (Fig. 5). These fits are clearly better than those obtained with Gaussians, particularly near the line centers. There are still significant discrepancies, mainly on the blue line wings, which are discussed below. Table 3 gives the parameters obtained from the Voigtian fits. Statistical uncertainties are on the order of 1...2 km s-1. The Doppler widths of all well-detected lines come out to be close to σ = 10 km s-1, corresponding to a FWHP ~ 24 km s-1. This value is greater than the thermal line width of hydrogen at 7000 K (17.9 km s-1). The resulting Lorentz impact parameter δ clearly increases with Δn. For the α-lines, δ is smaller than the Doppler width and impact broadening is barely noticeable. For H50β, we already have δ > σ, and the width of the γ-line is fully dominated by impact broadening.
Recombination theory gives the magnitude of impact broadening as a function of the electron density ne and the quantum number n. For the range of n of interest here, δ is approximated (Walmsley 1990) as  (5)Taking ne in the various line emitting regions from our scaling relations Eqs. (2) and (3), we estimate the model δ as listed in Table 3. Given the approximative nature of these relations, the agreement of the model δ with the δ obtained from the Voigt function must be considered satisfactory. This agreement supports our claim that the higher order transitions are affected or even dominated by impact broadening.
This finding may then also explain why the ratio of integrated line fluxes in close frequency pairs (Fig. 4) is lower than expected from recombination theory. Impact broadening, while not affecting the integrated flux of a line, transports a fraction of the line flux into the wings where it quickly gets lost in the noise. The losses become more severe with increasing Δn. Observations with higher signal-to-noise than those presented here are needed to confirm this conjecture.
Parameters of Voigt function fits and prediction of the impact broadening parameter δ.
Because of the orders of magnitude lower densities in compact HII-regions, this effect is absent there (Gordon & Walmsley 1990) but must be reckoned with in wind sources. A more exact modeling of the line broadening will be included in the forthcoming paper (Báez-Rubio et al., in prep.), which uses the MORELI code (Báez-Rubio et al. 2013) to model recombination line and continuum emission.
3.4. Stimulated emission?
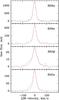 |
Fig. 5 Line profiles of the four transitions observed with the highest signal-to-noise. The underlying continuum emission has been subtracted. The continuous red lines represent Voigt functions (see text). All four transitions display excess emission on the blue line wing, which is unaccounted for by Doppler and impact broadening of the thermal line profiles. |
We have argued in Sect. 3.2.1 on the basis of the integrated line-to-continuum ratio that the millimeter recombination lines are emitted close to LTE. Investigation of the line profiles allows to carry this discussion a bit further. As pointed out already above, all the four best observed lines display emission on their blue wings in excess of the fitted Voigt profile (Fig. 5). The blue excess is most pronounced in H40α and barely detected in H29α.
There are two possible causes of the blue excess. Both scenarios assume that the emission in the wings predominantly comes from gas in the outflow. In the first scenario, the lines might be intrinsically symmetric. Excess emission on red wing may be absorbed by the optically thick continuum core which partially hides the receding part of the outflow from the observer. In the second scenario, the optically thick core enhances the emission of the approaching outflow cone by stimulation. This weak amplification of line wings has already been seen in MWC 349, where Báez-Rubio et al. (2013) called them “wing humps”.
Detailed modeling of the emission with the MORELI code may help to decide between the two scenarios, and more observations at wavelengths longer than 3mm and/or at higher angular resolution may directly show whether obscuration or stimulated emission is at work.
4. Discussion
The principal characteristic of LkHα 101 in the radio/millimeter range is its SED, which has a constant slope through this whole wavelength range. To our knowledge, the only other source whose slope has been measured and also found to be constant over an even broeader wavelength range is MWC 349. It is therefore of interest to compare the properties of these two radio stars (Sect. 4.2), to investigate why, despite the overall similarities between these two stars, their continuum slope is different (Sect. 4.1), and last but not least, to investigate why one star is masing and the other one not (Sect. 4.3).
4.1. A non-canonical wind
As described in Sect. 3.1, three independent observations led us to the conclusion that the spectral slope α of the continuum is steeper than expected for an isothermal, isotropical ionized wind expanding at constant velocity. The wind in LkHα 101 must therefore depart from the canonical case in at least one of these four properties.
Since the continuum absorption coefficient depends on the electron temperature as  , the emitted flux must also depend on Te. Gradients of Te therefore affect α. The dependence of the emitted flux on temperature is however very weak,
  (Panagia & Felli 1975). It cannot account for the additional flux observed at 100 GHz due to the increase in α from the canonical 0.6 to the observed 0.90, which is a factor of 2.5 compared to 5 GHz. To explain this factor, Te would have to increase by an implausible factor of >103 when approaching the star from R(5 GHz) to R(100 GHz). We note that an opposite Te gradient, such as due to reheating of the wind at larger radii, would also affect α but in the wrong sense. We thus conclude that gradients of Te cannot explain the observed steepening of the SED.
Is it possible that the wind is not ionized throughout the flow, as required by the canonical case? If the wind recombines at larger radii, some of the emission expected at lower frequency is missing, and the SED is steepening. This is however unlikely, since in wind sources virtually all of the recombinations occur very close to the base of the flow which is usually optically thick at radio wavelengths (Felli & Panagia 1981). The existence of an HII-region excited by LkHα 101 clearly demonstrates that the star driving the wind provides more ionizing photons than can be absorbed by the entire flow.
Since departures from spherical symmetry, notably a polar double-cone geometry, do not generally change α (Schmid-Burgk 1982), we are thus left with the only option that the density law of the ionized wind in LkHα 101 departs from r-2. The straightforward case where the wind is accelerated leads to a steeper density dependence and a larger α (see e.g. Panagia & Felli 1975). We consider this case however as very implausible, since it requires a force acting on the wind uniformly over the very broad range of radii from R(300 GHz) out to R(1 GHz). We are not aware of any force with these characteristics.
Instead, we propose that the departure from the r-2 law is related to the presence of a massive circumstellar disk from where the wind is launched. We envision two possible scenarios. In the first scenario, the wind originates in a radially narrow ring-like region near the inner edge of the disk, possibly due to photo-evaporation. Tuthill et al. (2002) give the radius where dust evaporates around a star of the luminosity of LkHα 101 as rC ~ 15 AU, which is in close agreement with the radius where they find the peak of the dust torus. The wind then flows away from the disk into cones with opening angles that increase with increasing height above the disk. The increase in the opening angle is a natural consequence of the thermal pressure of the wind, which causes the plasma to expand laterally into the neighboring empty space. The density of the constant-velocity wind then falls off more rapidly than r-2, since it expands into volume segments that increase more rapidly than r2. Quantitatively, the increase in the opening angle becomes significant only in slow winds where υexp is not much greater than the thermal speed of the plasma.
The second scenario, not necessarily exclusive of the first one, postulates that the wind originates in the corona of a massive disk whose density falls of exponentially with height above the disk plane, much like in the photo-evaporative disks modeled by Hollenbach et al. (1994). We expect that this rapid decrease of the electron density with distance from the disk generates a steep SED, even if the detailed SED for such photo-evaporative flows has not yet been modeled to our knowledge. The density structure might be even more complicated if the disk corona contains active regions, as in the solar corona, which may be instrumental in launching the wind. Although there are no confirmed reports of a magnetic field in LkHα 101(Zinnecker & Preibisch 1994; Osten & Wolk 2009; Gibb et al. 2010), a strong magnetic field has been discovered in the phenomenologically similar (see next section) MWC 349 (Thum & Morris 1999). These authors argue that the magnetic pressure is comparable to the thermal energy density of the plasma and thus dynamically important. The field in MWC 349 is claimed to be generated by a disk dynamo. As the parameters under which these dynamos operate are very general (Tout & Pringle 1992), it is quite possible, that the disk of LkHα 101 is also magnetic.
The second scenario gets some support from the consideration that the gravitational radius rg (Hollenbach et al. 1994), outside of which plasma at 7000 K is not gravitationally bound anymore by a 15 M⊙ star is 160 AU or 0 22. Since both the millimeter source (Table 1) and the near-infrared source (Tuthill et al. 2002) are much smaller, the wind is obviously launched from deep inside rg. It then needs an additional force, apart from thermal pressure, to get started. A magnetic field can provide this force.
4.2. LkHα 101and MWC 349: Stellar twins?
The main characteristic of LkHα 101 in the radio/millimeter range is its SED, which has a constant slope through this whole wavelength range that is very close to α = 0.9. The SED of MWC 349 has been studied over an even larger wavelength range (Tafoya et al. 2004; Krips et al., in prep.). Its slope is also constant (α = 0.6) but much closer to the canonical value. In both cases, the expansion velocity of the ionized wind is small, ~60 km s-1 for MWC 349 and 55 km s-1 for LkHα 101, which sets these disk wind sources apart from the much more numerous class of mass-losing OB stars whose radiation driven winds reach terminal velocities of ≳1000 km s-1 (Lamers & Nugis 2002). It is curious that the small difference in υexp between the two sources is in the same sense as their mass loss rate, which is a factor 5 higher in MWC 349, and their luminosity, which is a factor ≳5 higher in MWC 349.
Similarities between LkHα 101 and MWC 349 are also strong at shorter wavelengths. Both stars have been found by their bright Hα (and other optical) emission lines, and they are both massive, have hot circumstellar disks, and their optical spectra are characterized by a complete absence of any photospheric absorption lines. As a result, the spectral type and luminosity class of both stars are inferred only indirectly through their bolometric luminosities and the presence or absence of ionized helium. Their evolutionary state is therefore not well known. Whereas for MWC 349, evidence has accumulated for a post-main-sequence evolutionary state (Hartmann et al. 1980; Hofmann et al. 2002; Gvaramadze & Menten 2012), LkHα 101 is likely at or near the zero age main sequence, as suggested by its close association with an HII-region and with a cluster of pre-main-sequence stars.
Both stars have very broad Hα line wings, attributed to scattering of line photons in a dense electron gas in both cases (Hartmann et al. 1980; Herbig et al. 2004). This gas is thought to be located within a few astronomical units from the star, possibly also causing the strong veiling of the photospheric absorption lines. In summary, the two stars display strong phenomenological similarities over the electromagnetic spectrum, while one of them is at the beginning, and the other is at the end of their evolution.
4.3. Millimeter recombination lines are not masing
If LkHα 101 bears such a strong similarity to MWC 349, why are its millimeter recombination lines also not masing? We think that the absence of masing is caused by two adverse circumstances: i) its disk is smaller than that of MWC 349; and ii) the disk has an unfavorable orientation.
Martín-Pintado et al. (2011) have shown that the blue and red H30α maser spikes in MWC 349 are located on opposite sides of the circumstellar disk at 29 AU from the star. At these positions, the maser spikes are barely inside the disk of hot dust whose size was measured at λ3.8 μm by Danchi et al. (2001) to be 75 AU. The H30α maser in MWC 349 operates at ne ≃ 3 × 107 cm-3 (Martín-Pintadoet al. 1989), which is very close to the density where the net amplification is highest (Strelnitski et al. 1996). At this density, the net line absorption coefficient at the line center is κL = −1.4 × -12 m-1, assuming the electron temperature derived in Sect. 3.2.1 and no additional line broadening. The unit e-folding gain length is then 4.7 AU Knowing that the maser propagates along tangential lines above the nearly edge-on disk, it is easy to see that the MWC 349 disk is large enough to accommodate a few gain lengths leading to a modest amplification at 1.3 mm, τ ~ −3, as already inferred by Martín-Pintado et al. (1989).
The disk around LkHα 101 is considerably smaller. We argued above (Sect. 4.1) that the wind may be launched from the torus at rC ~ 15 AU where the emission from hot dust peaks (Tuthill et al. 2002). Assuming that the plasma density also peaks in this ring, it is reasonable to expect that maser propagation conditions are optimum there. We then derive a very modest amplification of τ ~ −1 from simply scaling with the disk dimensions. However, even this very small amplification would only be achieved if the LkHα 101 disk had a near edge-on orientation like MWC 349. This is however not the case. Tuthill et al. infer a likely inclination angle of ≲35°. This nearly face-on viewing geometry foreshortens the maser path where it would propagate through the high densities near the disk surface. Taking these arguments together, the conditions for maser amplification in LkHα 101 are at least an order of magnitude worse than in MWC 349, and no appreciable amplification results at millimeter wavelengths. Since the hydrogen absorption coefficient becomes more negative at shorter wavelengths (and higher electron densities), a noticeable amplification however may be present at submillimeter wavelengths.
5. Conclusions
Our observations at millimeter wavelengths present the first detections of radio recombination lines, including several higher order transitions, from the massive young stellar object LkHα 101. The good quality of this data gives a precise value of the stellar radial velocity, free from complications introduced by dust obscuration (Kelly et al. 1994), and we determine υexp = 55 km s-1 for the wind expansion velocity and 1.8 × 10⁻⁶M⊙ yr-1 for its mass loss rate. The value of υexp is much lower than previous claims based on optical/near-infrared observations (Cohen et al. 1980; Simon & Cassar 1984; Hamann & Persson 1989) which were complicated by uncertain amounts of non-Doppler line broadening. LkHα 101 shares the low υexp with the recombination line maser source MWC 349, and we argue that the slow and massive ionized wind in LkHα 101 is also caused by photo-evaporation from the circumstellar disk, as claimed for MWC 349 (Hollenbach et al. 1994; Martín-Pintado et al. 2011).
From the broadband interferometer spectrum and visibility data, we derive the slope α = 0.90 of the continuum spectrum. This value which is significantly larger than the canonical value of 0.6 for an isotropic constant-velocity wind, is compatible with the value derived from longer wavelength radio data. These larger than canonical values of α imply that the density of the wind drops faster than r-2. We propose a scenario where the wind is launched from a radially narrow part of the circumstellar disk, which is likely at the radius where dust sublimates and the disk is flared. As the wind expands away from the disk, we postulate that it also expands laterally resulting in a drop of the density that is the steeper than r-2. As more ionized winds from massive young stellar objects become detectable, we expect that their radio/millimeter continuum spectral slopes will often be steeper than canonical, particularly in those sources that are in the evolutionary stage where they disperse the gaseous component of their accretion disks. Steepened SEDs have already been seen in a number of radio stars (Altenhoff et al. 1994) and a few highly compact HII-regions (Franco et al. 2000).
Our data of the higher order radio recombination lines – that is the first observations in a stellar wind source apart from MWC 349 – display a novel phenomenon. All ratios of close frequency pairs (Fig. 4) are significantly lower than observed in compact HII-regions. We show that this trend most likely results from the circumstance that the higher order lines, which are emitted from levels of higher principal quantum numbers n than the corresponding α-transition, are affected by pressure broadening in the high densities of the ionized wind. We plan to study this novel phenomenon more quantitatively in a forthcoming paper using the modeling code MORELI (Báez-Rubio et al., in prep.).
Despite the strong phenomenological similarities between LkHα 101 and MWC 349, the recombination lines in LkHα 101 are emitted near LTE. The blue line wings may however be weakly amplified like the “wing humps” in MWC 349. The absence of strong disk masers at millimeter wavelengths is quantitatively explained by the smaller size of the LkHα 101 disk and its unfavorable orientation. Notwithstanding, noticeable amplification may be detectable at submillimeter and shorter wavelengths if the required high electron densities (~108 cm-3) are present in this source.
Acknowledgments
We are grateful to the IRAM Director, P. Cox, for granting time on the Plateau de Bure interferometer in the context of commissioning of the broad band correlator WIDEX. We thank Malcolm Walmsley for valuable comments on impact broadening and an anonymous referee for insightful remarks.
References
- Altenhoff, W. J., Strittmatter, P. A., & Wendker, H. J. 1981, A&A, 93, 48 [NASA ADS] [Google Scholar]
- Altenhoff, W. J., Thum, C., & Wendker, H. J. 1994, A&A, 281, 161 [NASA ADS] [Google Scholar]
- Báez-Rubio, A., Martín-Pintado, Thum, C., & Planesas, P. 2013, A&A, 553, A45 [NASA ADS] [CrossRef] [EDP Sciences] [Google Scholar]
- Barsony, M., Scoville, M. Z., Schloembert, J. M., & Claussen, M. J. 1990, ApJ, 362, 674 [NASA ADS] [CrossRef] [Google Scholar]
- Becker, R. H., & White, R. L. 1988, ApJ, 324, 893 [NASA ADS] [CrossRef] [Google Scholar]
- Brocklehurst, M., & Seaton, M. J. 1972, MNRAS, 157, 179 [NASA ADS] [CrossRef] [Google Scholar]
- Carter, M., Lazareff, B., Maier, D., Chenu, J.-Y., et al. 2012, A&A, 538, 89 [Google Scholar]
- Cohen, M. 1980, MNRAS, 190, 865 [NASA ADS] [Google Scholar]
- Cohen, M., Bieging, J. H., & Schwartz, P. R. 1982, ApJ, 253, 707 [NASA ADS] [CrossRef] [Google Scholar]
- Danchi, W. C., Tuthill, P. G., & Monnier, J. D. 2001, ApJ, 562, 440 [NASA ADS] [CrossRef] [Google Scholar]
- Dewdney, P. E., & Roger, R. S. 1986, ApJ, 307, 275 [NASA ADS] [CrossRef] [Google Scholar]
- Felli, M., & Panagia, N. 1981, A&A, 102, 424 [NASA ADS] [Google Scholar]
- Franco, J., Kurtz, S., Hofner, P., et al. 2000, ApJ, 542, L143 [NASA ADS] [CrossRef] [Google Scholar]
- Gibb, A. G., & Hoare, M. G. 2007, MNRAS, 380, 246 [NASA ADS] [CrossRef] [Google Scholar]
- Gibb, E. L., Brittain, S. D., Rettig, T. W., et al. 2010, ApJ, 715, 757 [NASA ADS] [CrossRef] [Google Scholar]
- Gordon, M. A., & Walmsley, C. M. 1990, ApJ, 365, 606 [NASA ADS] [CrossRef] [Google Scholar]
- Gvaramadze, V. V., & Menten, K. M. 2012, A&A, 541, A7 [NASA ADS] [CrossRef] [EDP Sciences] [Google Scholar]
- Hamann, F., & Persson, S. E. 1989, ApJS, 71, 931 [NASA ADS] [CrossRef] [Google Scholar]
- Hartmann, L., Jaffe, D., & Huchra, J. P. 1980, ApJ, 239, 905 [NASA ADS] [CrossRef] [Google Scholar]
- Harvey, P. M., Thronson, H. A., & Gatley, I. 1979, ApJ, 231, 115 [NASA ADS] [CrossRef] [Google Scholar]
- Herbig, G. H. 1971, ApJ, 169, 537 [NASA ADS] [CrossRef] [Google Scholar]
- Herbig, G. H., Andrews, S. M., & Dahm, S. E. 2004, AJ, 128, 1233 [NASA ADS] [CrossRef] [Google Scholar]
- Hofmann, K.-H., Balega, Y., Ikhsanov, N. R., Miroshnichenko, A. S., & Weigelt, G. 2002, A&A, 395, 891 [NASA ADS] [CrossRef] [EDP Sciences] [Google Scholar]
- Hollenbach, D., Johnstone, D., Lizano, L., & Shu, F. 1994, ApJ, 248, 654 [NASA ADS] [CrossRef] [Google Scholar]
- Kelly, D. M., Rieke, G. H., & Campbell, M. 1994, ApJ, 425, 231 [NASA ADS] [CrossRef] [Google Scholar]
- Knapp, G. R., Kuiper, T. B. H., Knapp, S. L., & Brown, R. L. 1976, ApJ, 206, 443 [NASA ADS] [CrossRef] [Google Scholar]
- Lamers, H. J. G. L. M., & Nugis, L. 2002, A&A, 395, L1 [NASA ADS] [CrossRef] [EDP Sciences] [Google Scholar]
- Martín-Pintado, J., Bachiller, R., Thum, C., & Walmsley, C. M. 1989, A&A, 215, L13 [NASA ADS] [Google Scholar]
- Martín-Pintado, Thum, C., Planesas, P., & Báez-Rubio, A. 2011, A&A, 530, L15 [NASA ADS] [CrossRef] [EDP Sciences] [Google Scholar]
- Mezger, P. G., & Höglund, B. 1967, ApJ, 147, 490 [NASA ADS] [CrossRef] [Google Scholar]
- Mitchell, G. F., Maillard, J.-P., Allen, M., Beer, R., & Belcourt, K. 1990, ApJ, 363, 554 [NASA ADS] [CrossRef] [Google Scholar]
- Olnon, F. M. 1975, A&A, 39, 217 [NASA ADS] [Google Scholar]
- Osten, R. A., & Wolk, S. J. 2009, ApJ, 691, 1128 [NASA ADS] [CrossRef] [Google Scholar]
- Panagia, N. 1973, AJ, 78, 929 [NASA ADS] [CrossRef] [Google Scholar]
- Panagia, N., & Felli, M. 1975, A&A, 39, 1 [NASA ADS] [Google Scholar]
- Pirogov, L. 1999, A&A, 348, 600 [NASA ADS] [Google Scholar]
- Roelfsema, P. R., & Goss, W. M. 1992, ARA&A, 4, 161 [Google Scholar]
- Rodríguez, L. F. 1982, Rev. Mex. Astron. Astrophys., 5, 179 [NASA ADS] [Google Scholar]
- Rodríguez, L. F., Zapata, L. A., & Ho, P. T.P 2009, ApJ, 692, 162 [NASA ADS] [CrossRef] [Google Scholar]
- Sandell, G., Weintraub, D. A., & Hamidouche, M. 2011, ApJ, 727, 26 [NASA ADS] [CrossRef] [Google Scholar]
- Schmid-Burgk, J. 1982, A&A, 108, 169 [NASA ADS] [Google Scholar]
- Sewilo, M., Churchwell, E., Kurtz, S., Goss, W. M., & Hofner, P. 2011, ApJS, 194, 44 [NASA ADS] [CrossRef] [Google Scholar]
- Simon, M., & Cassar, L. 1984, ApJ, 283, 179 [NASA ADS] [CrossRef] [Google Scholar]
- Strelnitski, V., Ponomarev, V., & Smith, H. A. 1996, ApJ, 470, 1118 [NASA ADS] [CrossRef] [Google Scholar]
- Tafoya, D., Gómez, Y., & Rodríguez, L. F. 2004, ApJ, 610, 827 [NASA ADS] [CrossRef] [Google Scholar]
- Thompson, R. I., Erickson, E. F., Witteborm, F. C., & Strecker, D. W. 1976, ApJ, 210, L13 [NASA ADS] [CrossRef] [Google Scholar]
- Thum, C., & Morris, D. 1999, A&A, 344, 923 [NASA ADS] [Google Scholar]
- Thum, C., Strelnitski, V. S., Matthews, H. E., Martín-Pintado, J., & Smith, H. A. 1995, A&A, 300, 843 [NASA ADS] [Google Scholar]
- Thum, C., Martín-Pintado, J., Quirrenbach, A., & Matthews, H. E. 1998, A&A, 333, L63 [NASA ADS] [Google Scholar]
- Tout, C. A., & Pringle, J. E. 1992, MNRAS, 259, 604 [NASA ADS] [Google Scholar]
- Tuthill, P. G., Monnier, J. D., Danchi, W. C., Hale, D. D., & Townes, C. H. 2002, ApJ, 577, 826 [NASA ADS] [CrossRef] [Google Scholar]
- Walmsley, C. M. 1990, A&AS, 82, 201 [NASA ADS] [Google Scholar]
- Zinnecker, H., & Preibisch, Th. 1994, A&A, 292, 152 [NASA ADS] [Google Scholar]
All Tables
Parameters of Voigt function fits and prediction of the impact broadening parameter δ.
All Figures
|
Fig. 1 Visibilities of LkHα 101 at 99.5 GHz observed with the IRAM interferometer over baselines ranging to 450 m. The straight line represents the fit of a wind model, as described in the text. |
| In the text | |
|
Fig. 2 Interferometer spectrum obtained with the new wideband correlator (WIDEX) that is centered at 99.5 GHz. The five recombination lines that fall in the 3.6 GHz wide spectrum are labeled. The zoomed-in spectra of the three clearly detected lines are shown in the insets on velocity scales with the continuum subtracted. The dotted red curves indicate Gaussian fits whose parameters are listed in Table 2. |
| In the text | |
|
Fig. 3 Spectral energy distribution of LkHα 101 in the radio/millimeter regime. Data are taken from Becker & White (1988) (°); Gibb & Hoare (2007) (△); Altenhoff et al. (1994) (×); Sandell et al. (2011) (▴); priv. comm. by Krips (•); and this paper (■). The continuous red line is a weighted fit to the observations and has a slope of α = 0.86 in logarithmic units. The dashed red line is a fit to the same data, where the slope has been fixed to its canonical value α = 0.60. |
| In the text | |
|
Fig. 4 Ratios of close frequency pairs. Each ratio relates a parameter of a recombination line of order Δn (= nupper−nlower = 1,2,3,4 for the α,β,γ, or δ transitions) to that of the α transition at a nearby frequency (See Table 2). Parameter ratios are shown for the peak line intensity and whenever available, the line full width at half power (FWHP) and the integrated intensity. The continuous line labeled “B&S” gives the ratios expected for optically thin plasma at low-density (Brocklehurst & Seaton 1972). |
| In the text | |
|
Fig. 5 Line profiles of the four transitions observed with the highest signal-to-noise. The underlying continuum emission has been subtracted. The continuous red lines represent Voigt functions (see text). All four transitions display excess emission on the blue line wing, which is unaccounted for by Doppler and impact broadening of the thermal line profiles. |
| In the text | |
Current usage metrics show cumulative count of Article Views (full-text article views including HTML views, PDF and ePub downloads, according to the available data) and Abstracts Views on Vision4Press platform.
Data correspond to usage on the plateform after 2015. The current usage metrics is available 48-96 hours after online publication and is updated daily on week days.
Initial download of the metrics may take a while.