Fig. 5
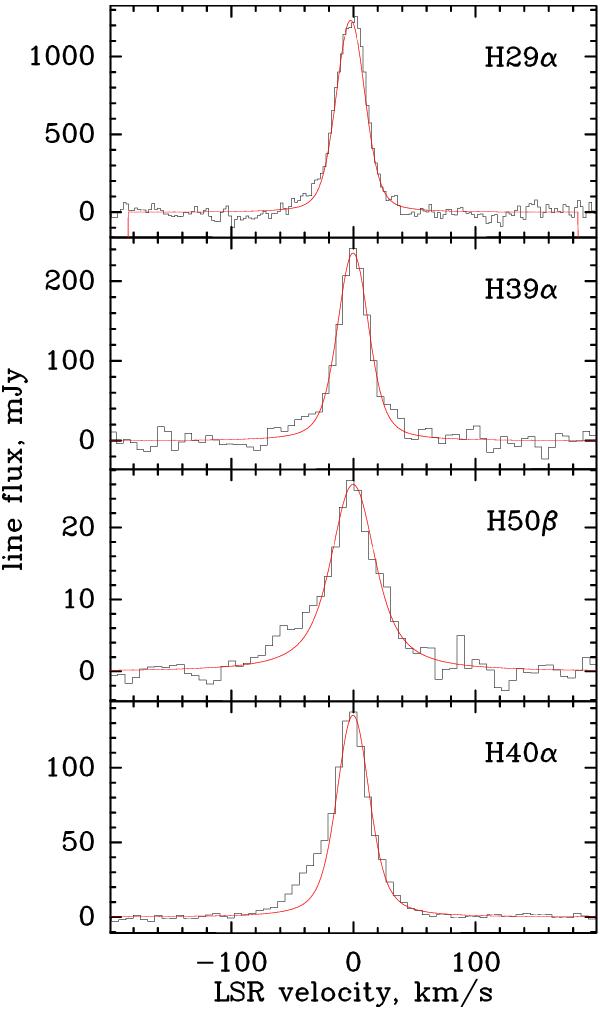
Line profiles of the four transitions observed with the highest signal-to-noise. The underlying continuum emission has been subtracted. The continuous red lines represent Voigt functions (see text). All four transitions display excess emission on the blue line wing, which is unaccounted for by Doppler and impact broadening of the thermal line profiles.
Current usage metrics show cumulative count of Article Views (full-text article views including HTML views, PDF and ePub downloads, according to the available data) and Abstracts Views on Vision4Press platform.
Data correspond to usage on the plateform after 2015. The current usage metrics is available 48-96 hours after online publication and is updated daily on week days.
Initial download of the metrics may take a while.